
Trade The World
Cardano Price Forecast: ADA eyes recovery as bullish momentum builds
بواسطة Manish Chhetri
تاريخ النشر: 25 Aug 2025 | تاريخ التعديل: 25 Aug 2025


POPULAR ARTICLES

Cardano (ADA) price is showing signs of recovery after rebounding from a crucial support level last week. This price optimism is further supported by rising Open Interest and stablecoin market capitalization, pointing toward improving market sentiment.
- Cardano price hovers around $0.92 on Monday after rebounding from its key support at $0.84 last week.
- Derivatives and on-chain data show rising Open Interest and stablecoin market capitalization, hinting at improving sentiment.
- Technical indicators point to bearish exhaustion, suggesting room for an upside rally.
Cardano (ADA) price is showing signs of recovery after rebounding from a crucial support level last week. This price optimism is further supported by rising Open Interest and stablecoin market capitalization, pointing toward improving market sentiment. The technical indicators suggest that the recent bearish momentum may be fading, opening the door for a potential upside rally.
Cardano’s derivatives and on-chain data hint at recovery
CoinGlass data show that Cardano’s futures’ OI at exchanges rose from $1.54 billion on Friday to $1.77 billion on Monday, nearing its record high of $1.87 billion. Rising OI represents new or additional money entering the market and new buying, which could fuel the current ADA price rally.
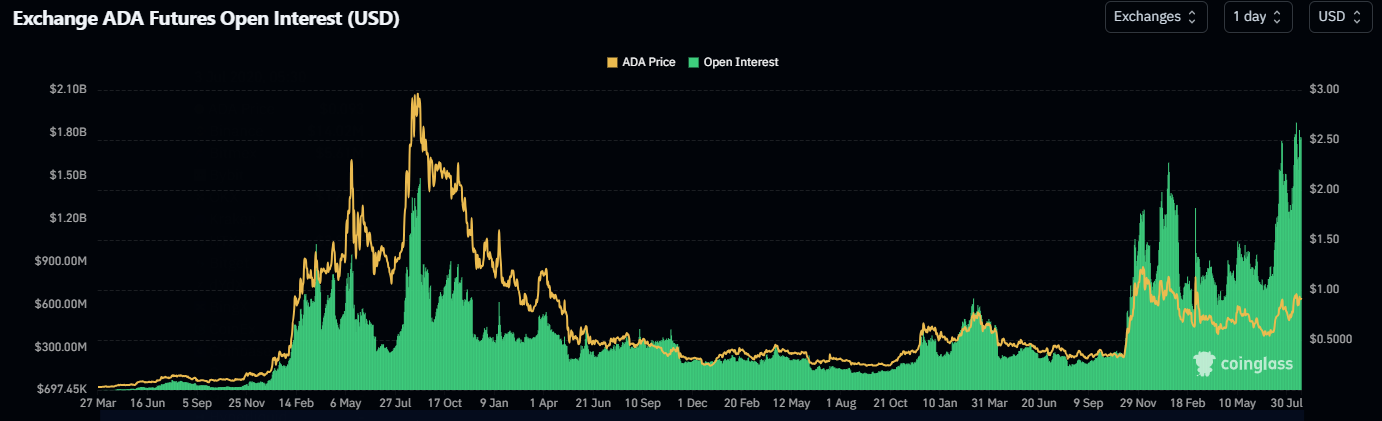
ADA Open Interest chart. Source: Coinglass
Data from crypto intelligence tracker DefiLlama shows that Cardano’s stablecoin market capitalization has been consistently rising since the end of July and currently stands at $38.58 on Monday. Such stablecoin activity and value increase on the ADA project indicate a bullish outlook, as they boost network usage and can attract more users to the ecosystem.
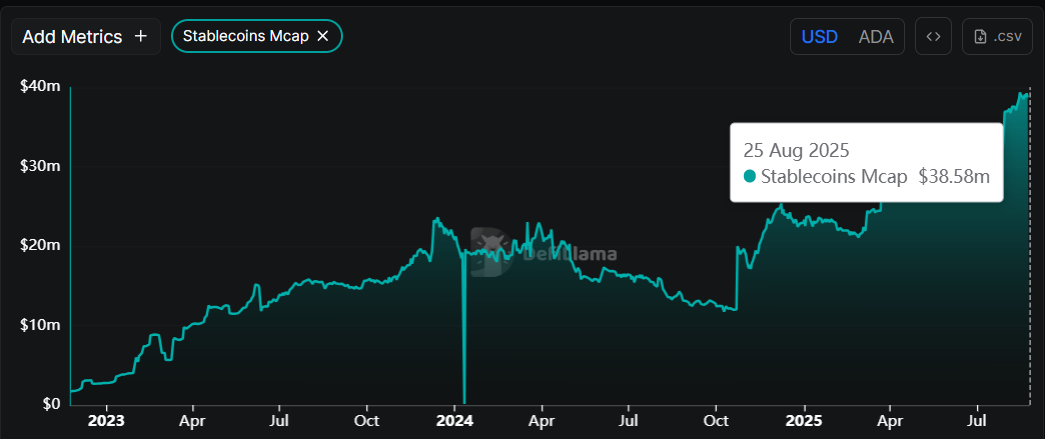
Cardano stablecoins Mcap chart. Source: DefiLlama
Cardano Price Forecast: ADA finds support around a key zone
Cardano price broke above the descending trendline (drawn by connecting multiple highs since early December) on August 13 and rallied, retesting its key psychological level of $1 the next day. However, ADA failed to sustain the upward momentum. It declined 5.4% last week, rebounding from its broken trendline support, which roughly coincides with the 61.8% Fibonacci retracement level at $0.82, making it a key support zone. At the start of this week, on Monday, it hovers at around $0.92.
If ADA continues its upward trend, it could extend the rally toward its August 14 high of $1.02. A successful close above this could extend the gains toward its yearly high at $1.17.
The Relative Strength Index (RSI) on the daily chart reads 58 above its neutral level of 50, indicating bullish momentum gaining traction. The Moving Average Convergence Divergence (MACD) lines converge against each other, indicating indecision among the traders.
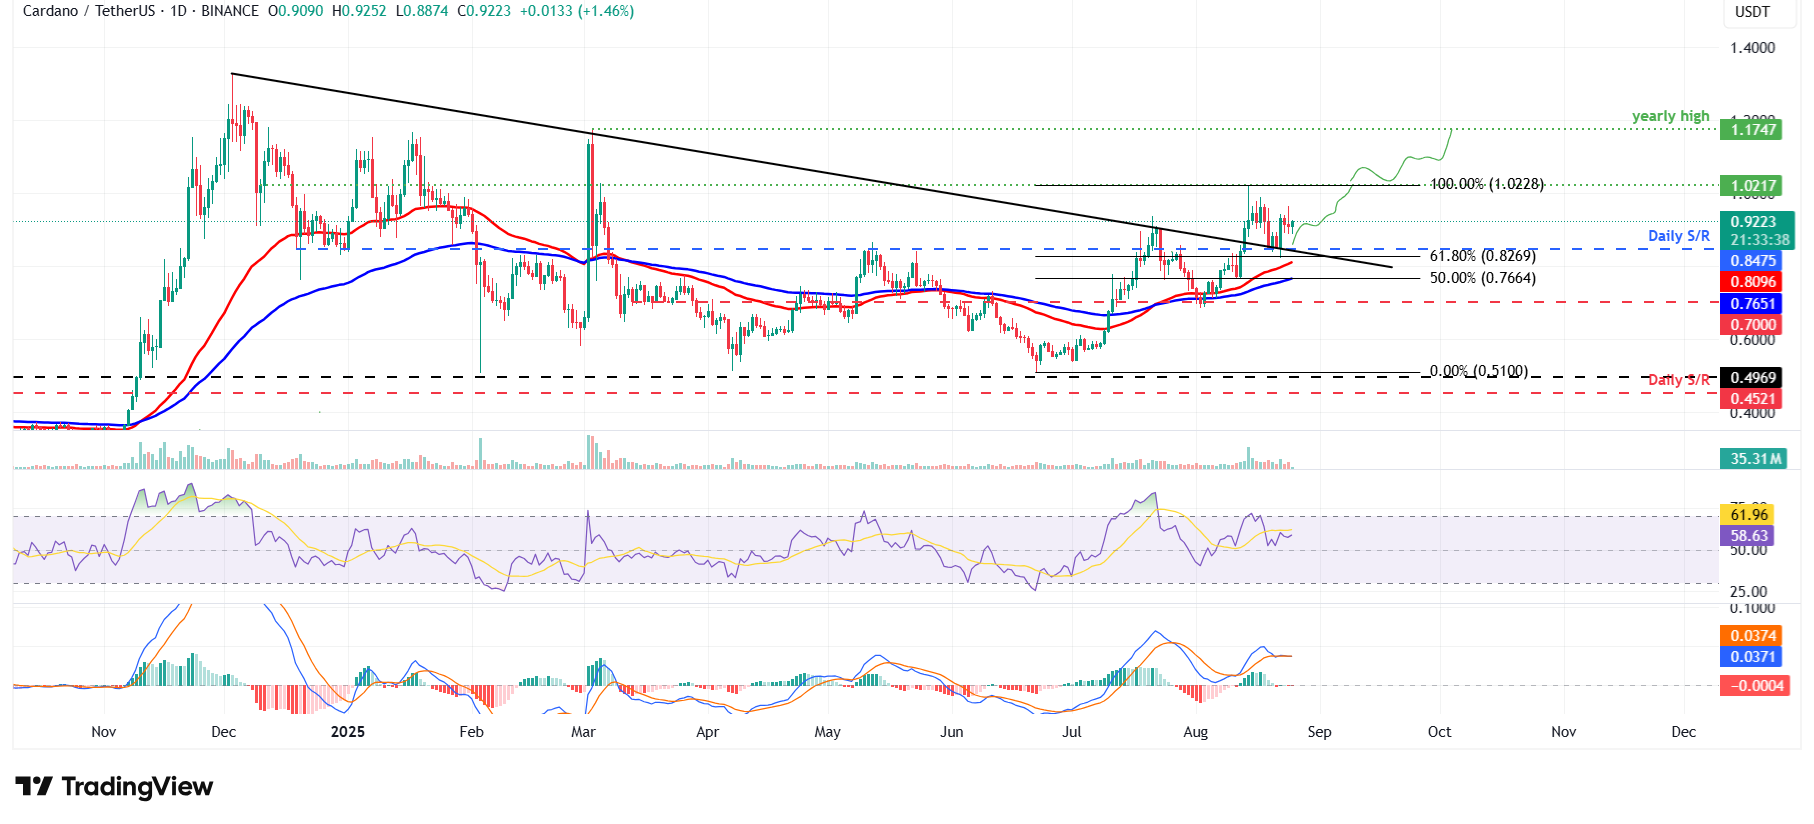
ADA/USDT daily chart
However, if ADA faces a correction, it could extend the decline toward its daily support at $0.84.

Acuity Trading
Acuity Trading هي شركة تكنولوجيا مالية مقرها لندن تأسست عام 2013، متخصصة في البيانات البديلة المدعومة بالذكاء الاصطناعي وتحليل المشاعر للتداول والاستثمار. أحدثت ثورة في تجربة التداول عبر الإنترنت عبر أدوات الأخبار البصرية والمشاعر، وتواصل اليوم ريادة السوق ببيانات بديلة مولدة للألفا وأدوات تداول جذابة مدعومة بأحدث أبحاث وتقنيات الذكاء الاصطناعي.
Read More


