
Trade The World
EUR/JPY Price Forecast: Climbs toward record highs near 185.00
بواسطة Akhtar Faruqui
تاريخ النشر: 12 Jan 2026 | تاريخ التعديل: 12 Jan 2026


POPULAR ARTICLES

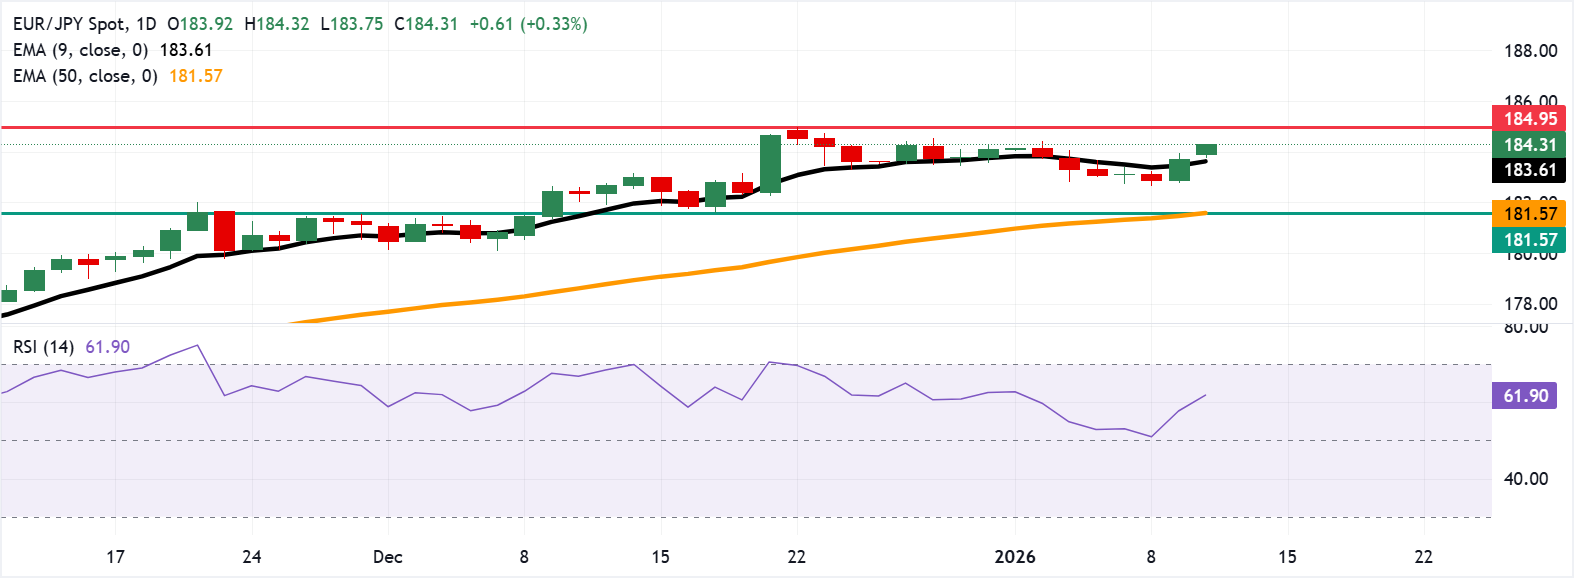
EUR/JPY extends its gains for the second successive session, trading around 184.30 during the Asian hours on Monday. The technical analysis of the daily chart suggests that the 14-day Relative Strength Index (RSI) at 61 signals firm momentum without overbought conditions.
- EUR/JPY eyes the immediate resistance at the all-time high of 184.95.
- The 14-day Relative Strength Index at 61 indicates solid momentum while remaining below overbought levels.
- The primary support lies at the nine-day EMA of 183.60.
EUR/JPY extends its gains for the second successive session, trading around 184.30 during the Asian hours on Monday. The technical analysis of the daily chart suggests that the 14-day Relative Strength Index (RSI) at 61 signals firm momentum without overbought conditions.
The nine-day Exponential Moving Average (EMA) rises above the 50-day EMA, keeping the bullish bias intact. The EUR/JPY cross holds above both averages, indicating trend continuity.
Immediate resistance aligns at the all-time high of 184.95, which was recorded on December 22, aligned with the psychological level of 185.00. A sustained break of the resistance could extend the upswing.
The EUR/JPY cross may find its initial support at the nine-day EMA of 183.60. A break below the short-term price average would weaken the momentum and put downward pressure on the currency cross to navigate the region around the 50-day EMA and the monthly low at 181.57.
Euro Price Today
The table below shows the percentage change of Euro (EUR) against listed major currencies today. Euro was the strongest against the Japanese Yen.
| USD | EUR | GBP | JPY | CAD | AUD | NZD | CHF | |
|---|---|---|---|---|---|---|---|---|
| USD | -0.17% | -0.11% | 0.17% | -0.11% | -0.10% | -0.16% | -0.20% | |
| EUR | 0.17% | 0.06% | 0.33% | 0.06% | 0.07% | 0.01% | -0.03% | |
| GBP | 0.11% | -0.06% | 0.28% | 0.00% | 0.01% | -0.05% | -0.09% | |
| JPY | -0.17% | -0.33% | -0.28% | -0.28% | -0.27% | -0.32% | -0.37% | |
| CAD | 0.11% | -0.06% | 0.00% | 0.28% | 0.00% | -0.05% | -0.09% | |
| AUD | 0.10% | -0.07% | -0.01% | 0.27% | -0.01% | -0.06% | -0.10% | |
| NZD | 0.16% | -0.01% | 0.05% | 0.32% | 0.05% | 0.06% | -0.05% | |
| CHF | 0.20% | 0.03% | 0.09% | 0.37% | 0.09% | 0.10% | 0.05% |
The heat map shows percentage changes of major currencies against each other. The base currency is picked from the left column, while the quote currency is picked from the top row. For example, if you pick the Euro from the left column and move along the horizontal line to the US Dollar, the percentage change displayed in the box will represent EUR (base)/USD (quote).
(The technical analysis of this story was written with the help of an AI tool.)

Acuity Trading
Acuity Trading هي شركة تكنولوجيا مالية مقرها لندن تأسست عام 2013، متخصصة في البيانات البديلة المدعومة بالذكاء الاصطناعي وتحليل المشاعر للتداول والاستثمار. أحدثت ثورة في تجربة التداول عبر الإنترنت عبر أدوات الأخبار البصرية والمشاعر، وتواصل اليوم ريادة السوق ببيانات بديلة مولدة للألفا وأدوات تداول جذابة مدعومة بأحدث أبحاث وتقنيات الذكاء الاصطناعي.
Read More


