
EUR/USD Price Forecast: Edges above 1.1600 near six-week lows
بواسطة Akhtar Faruqui
تاريخ النشر: 16 Jan 2026 | تاريخ التعديل: 16 Jan 2026


المقالات الشائعة

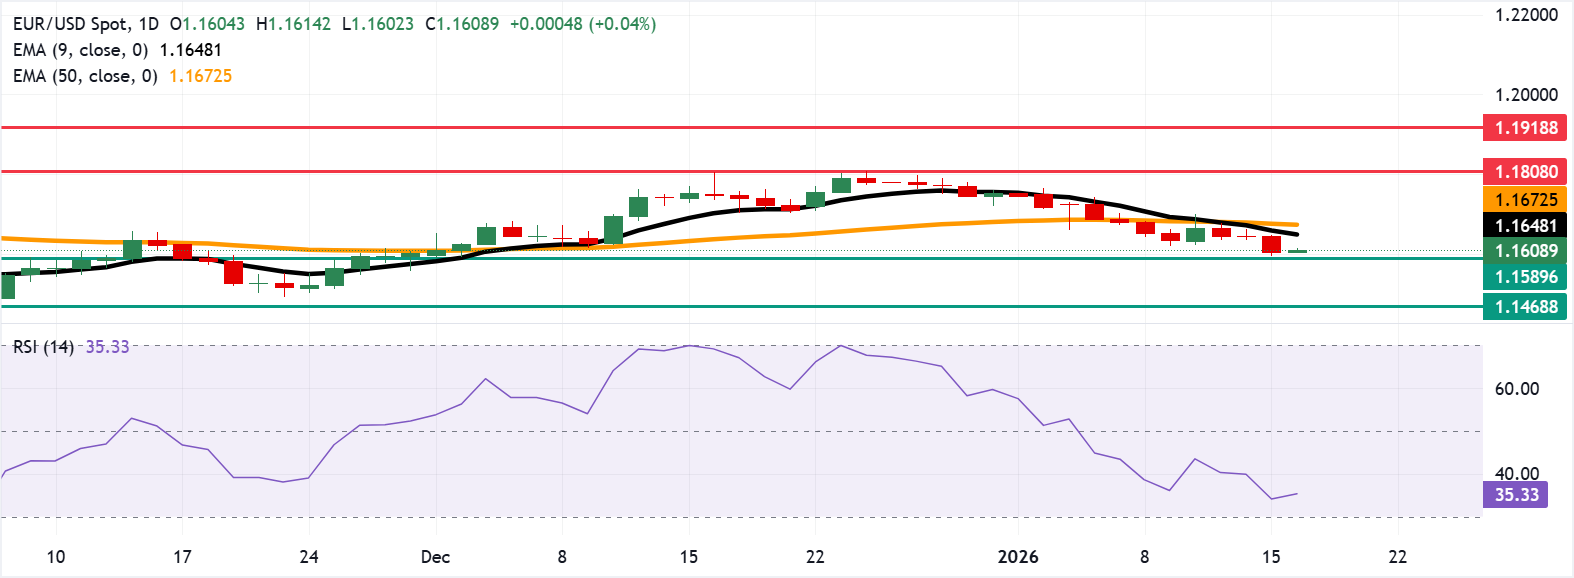
EUR/USD holds ground after three days of losses, trading around 1.1610 during the Asian hours on Friday. The 14-day Relative Strength Index (RSI) momentum indicator, currently at 35 (neutral-bearish), shows momentum skewed to the downside.
- EUR/USD rebounded from the six-week low at 1.1589.
- The 14-day Relative Strength Index, at 35, signals neutral-to-bearish conditions with momentum tilted to the downside.
- The initial resistance is seen at the nine-day EMA of 1.1648.
EUR/USD holds ground after three days of losses, trading around 1.1610 during the Asian hours on Friday. The 14-day Relative Strength Index (RSI) momentum indicator, currently at 35 (neutral-bearish), shows momentum skewed to the downside.
The technical analysis of the daily chart shows that the EUR/USD pair holds below the nine-day Exponential Moving Average (EMA) and the 50-day EMA, underscoring a bearish bias. The short-term average slopes lower beneath the medium-term gauge, capping rebounds.
The bias remains bearish while the EUR/USD pair stays below the short-term average, with downside risks focused on support near the six-week low at 1.1589, set on December 1. A sustained break below this level would open the door to the next support around 1.1468, the lowest since August 2025.
On the upside, the EUR/USD pair could target the initial resistance at the nine-and 50-day EMAs of 1.1648 and at 1.1673, respectively. Recovery through short- and medium-term averages would ease pressure and allow a test of the three-month high of 1.1808, which was recorded on December 24, followed by the 1.1918, the highest level since June 2021.
(The technical analysis of this story was written with the help of an AI tool.)
Euro Price Today
The table below shows the percentage change of Euro (EUR) against listed major currencies today. Euro was the strongest against the US Dollar.
| USD | EUR | GBP | JPY | CAD | AUD | NZD | CHF | |
|---|---|---|---|---|---|---|---|---|
| USD | -0.05% | -0.08% | -0.28% | -0.08% | -0.12% | -0.37% | -0.11% | |
| EUR | 0.05% | -0.03% | -0.24% | -0.03% | -0.06% | -0.31% | -0.06% | |
| GBP | 0.08% | 0.03% | -0.21% | 0.00% | -0.03% | -0.27% | -0.02% | |
| JPY | 0.28% | 0.24% | 0.21% | 0.24% | 0.19% | -0.06% | 0.20% | |
| CAD | 0.08% | 0.03% | -0.00% | -0.24% | -0.05% | -0.30% | -0.03% | |
| AUD | 0.12% | 0.06% | 0.03% | -0.19% | 0.05% | -0.25% | 0.00% | |
| NZD | 0.37% | 0.31% | 0.27% | 0.06% | 0.30% | 0.25% | 0.26% | |
| CHF | 0.11% | 0.06% | 0.02% | -0.20% | 0.03% | -0.01% | -0.26% |
The heat map shows percentage changes of major currencies against each other. The base currency is picked from the left column, while the quote currency is picked from the top row. For example, if you pick the Euro from the left column and move along the horizontal line to the US Dollar, the percentage change displayed in the box will represent EUR (base)/USD (quote).

Acuity Trading هي شركة تكنولوجيا مالية مقرها لندن تأسست عام 2013، متخصصة في البيانات البديلة المدعومة بالذكاء الاصطناعي وتحليل المشاعر للتداول والاستثمار. أحدثت ثورة في تجربة التداول عبر الإنترنت عبر أدوات الأخبار البصرية والمشاعر، وتواصل اليوم ريادة السوق ببيانات بديلة مولدة للألفا وأدوات تداول جذابة مدعومة بأحدث أبحاث وتقنيات الذكاء الاصطناعي.
اقرأ المزيد


