
Trade The World
GBP/JPY Price Forecast: Breaks above 203.00 as bulls eye 204.25
بواسطة Christian Borjon Valencia
تاريخ النشر: 11 Nov 2025 | تاريخ التعديل: 11 Nov 2025


POPULAR ARTICLES

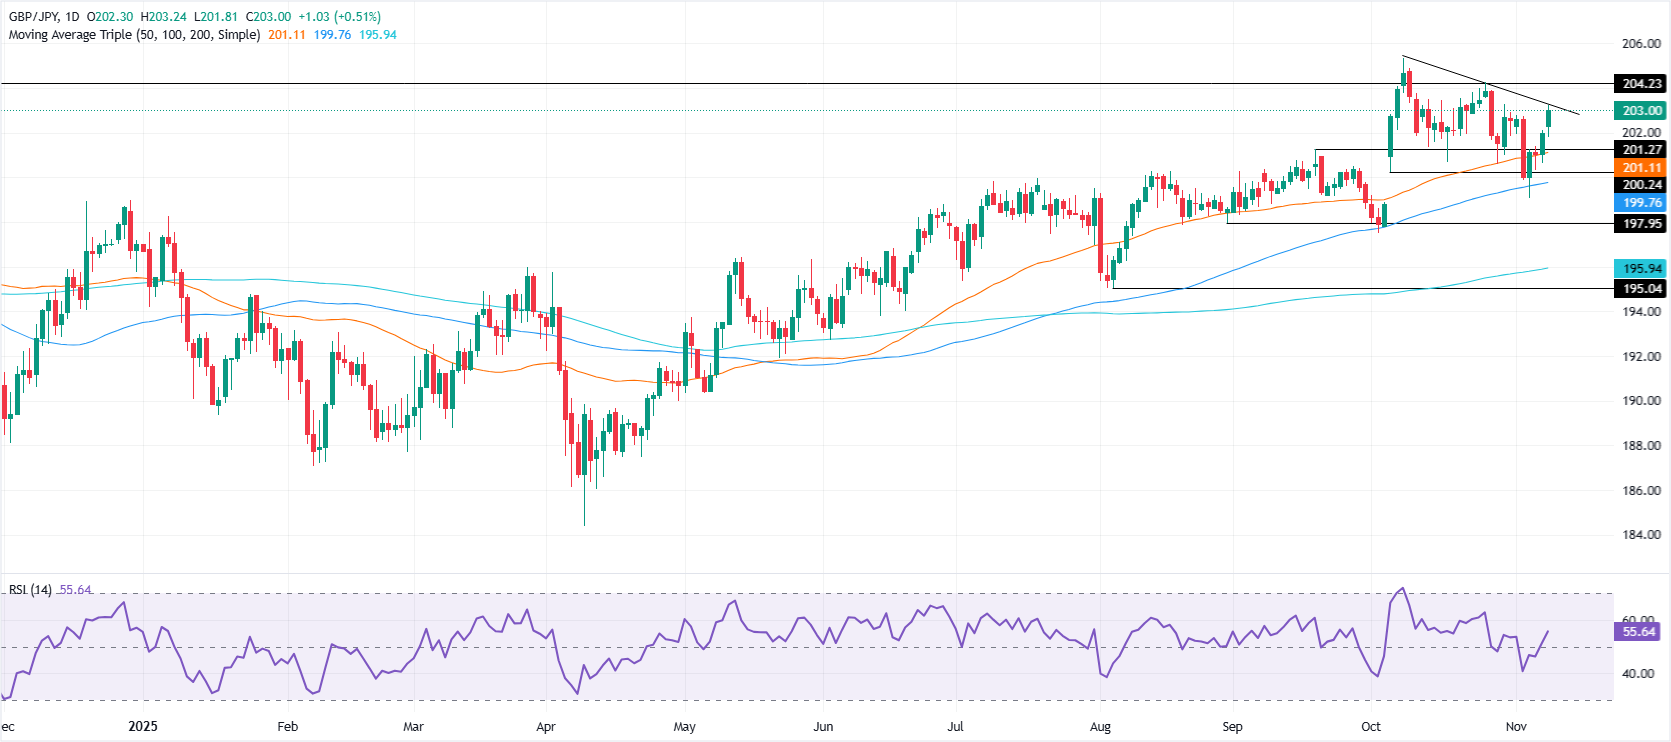
The Pound Sterling extended its gains versus the Japanese Yen on Monday, surpassing the 203.00 milestone as it gains over 0.54% clearing key previous resistance level turned support at the 20-day SMA at 202.37.
- GBP/JPY climbs above resistance amid renewed buying, turning 202.37 into key support zone.
- Bulls eye 204.24 and year-to-date high near 205.32 as RSI signals further upside momentum.
- Break below 202.00 risks deeper pullback toward 50-day SMA and November 7 swing low.
The Pound Sterling extended its gains versus the Japanese Yen on Monday, surpassing the 203.00 milestone as it gains over 0.54% clearing key previous resistance level turned support at the 20-day SMA at 202.37.
GBP/JPY Price Forecast: Technical outlook
Despite this, the GBP/JPY seems poised to consolidate unless buyers clear the next key resistance at 204.24 October 27 swing high. An uptrend resumption above the latter and the next stop would be the year-to-date (YTD) high at 205.32.
For a bearish scenario, sellers need to push the cross below the 20-dat SMA to test 202.00. Subsequent support rests at the 50-day SMA at 201.27, and a clear break, puts 201.00 to the test ahead of challenging the November 7 daily low of 200.65.
Given the backdrop described and the bullish momentum depicted by the Relative Strength Index (RSI), further upside is seen, but it is crucial for buyers, to hold firm above 203.00.
GBP/JPY Price Chart – Daily
Pound Sterling Price This week
The table below shows the percentage change of British Pound (GBP) against listed major currencies this week. British Pound was the strongest against the Swiss Franc.
| USD | EUR | GBP | JPY | CAD | AUD | NZD | CHF | |
|---|---|---|---|---|---|---|---|---|
| USD | 0.05% | 0.04% | 0.02% | 0.04% | 0.04% | -0.01% | 0.06% | |
| EUR | -0.05% | -0.01% | -0.05% | -0.01% | -0.02% | -0.07% | 0.00% | |
| GBP | -0.04% | 0.01% | 0.00% | -0.01% | -0.01% | -0.05% | 0.01% | |
| JPY | -0.02% | 0.05% | 0.00% | 0.00% | -0.00% | -0.04% | 0.02% | |
| CAD | -0.04% | 0.01% | 0.00% | -0.00% | -0.01% | -0.03% | 0.02% | |
| AUD | -0.04% | 0.02% | 0.00% | 0.00% | 0.00% | -0.04% | 0.00% | |
| NZD | 0.00% | 0.07% | 0.05% | 0.04% | 0.03% | 0.04% | 0.06% | |
| CHF | -0.06% | -0.00% | -0.01% | -0.02% | -0.02% | -0.01% | -0.06% |
The heat map shows percentage changes of major currencies against each other. The base currency is picked from the left column, while the quote currency is picked from the top row. For example, if you pick the British Pound from the left column and move along the horizontal line to the US Dollar, the percentage change displayed in the box will represent GBP (base)/USD (quote).

Acuity Trading
Acuity Trading هي شركة تكنولوجيا مالية مقرها لندن تأسست عام 2013، متخصصة في البيانات البديلة المدعومة بالذكاء الاصطناعي وتحليل المشاعر للتداول والاستثمار. أحدثت ثورة في تجربة التداول عبر الإنترنت عبر أدوات الأخبار البصرية والمشاعر، وتواصل اليوم ريادة السوق ببيانات بديلة مولدة للألفا وأدوات تداول جذابة مدعومة بأحدث أبحاث وتقنيات الذكاء الاصطناعي.
Read More


