
NZD/USD Price Forecast: Hold above 200-day SMA, Kiwi approaches 0.5900
بواسطة Christian Borjon Valencia
تاريخ النشر: 7 Mar 2026 | تاريخ التعديل: 7 Mar 2026


المقالات الشائعة

The New Zealand Dollar erases some of its earlier losses, remains above the 200-day Simple Moving Average (SMA) of 0.5874, seems poised to finish Friday’s session virtually unchanged.
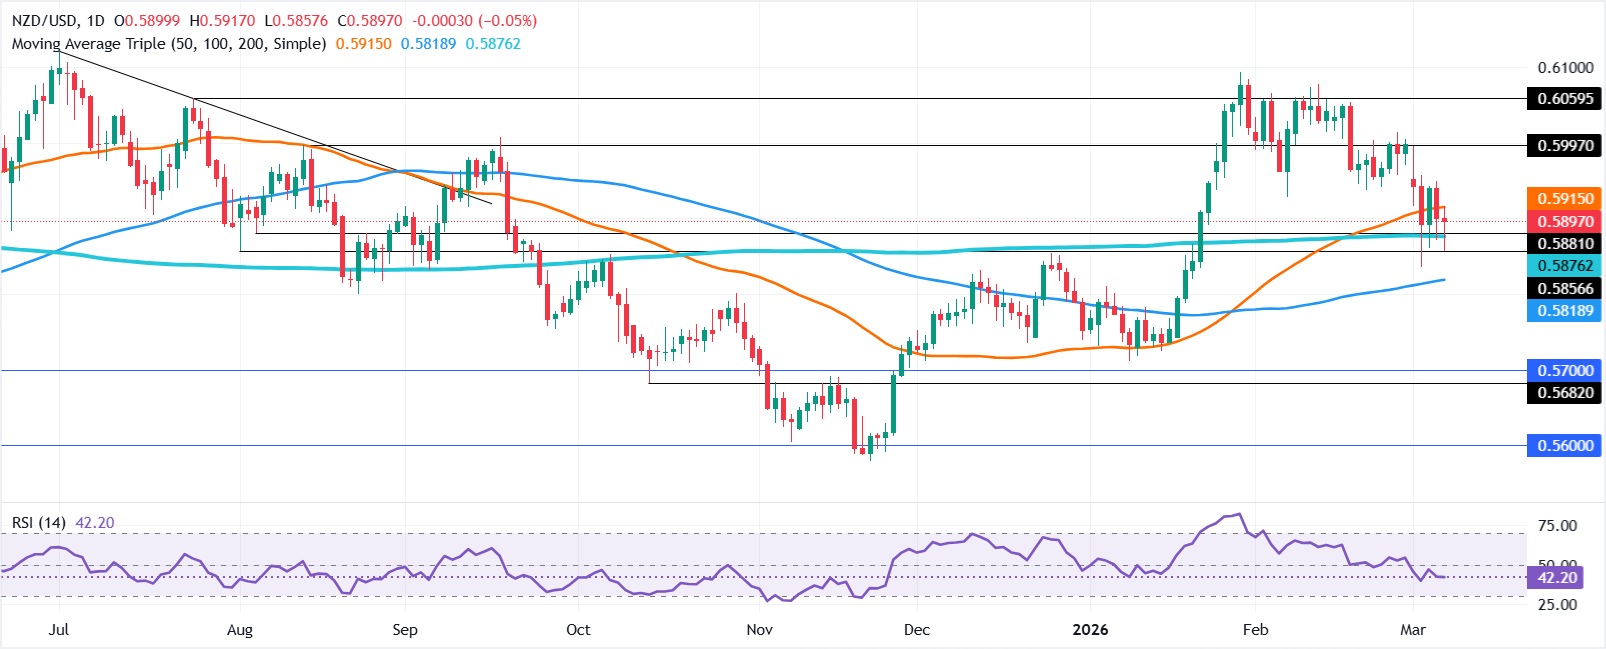
- NZD/USD steadies near 0.5900 as buyers defend the 200-day SMA at 0.5874.
- Break above 0.5900 would expose 0.5955 and the 20-day SMA at 0.5981.
- Drop below 200-day SMA risks slide toward 0.5817 and 0.5800 support.
The New Zealand Dollar erases some of its earlier losses, remains above the 200-day Simple Moving Average (SMA) of 0.5874, seems poised to finish Friday’s session virtually unchanged. At the time of writing, the NZD/USD hovers below the 0.5900 figure, which if broken, clears the path to retest weekly highs.
NZD/USD Price Forecast: Technical outlook
For the fourth straight day, the NZD/USD pierced the 200-day SMA, but buyers stepped in, driving the exchange rate within the 0.5880-0.5900 as they remain hopeful of pushing prices higher.
Nevertheless, momentum remains bearish as depicted by the Relative Strength Index (RSI), with the RSI’s slope aiming lower.
For a bullish continuation, buyers must push the exchange rate past 0.5900 followed by the March 3 high at 0.5955. On further strength the next area of interest would be the 20-day SMA at 0.5981 ahead of 0.6000.
On the flip side, and the most likely scenario the first support is the 200-day SMA. A break beneath the level will expose the 100-day SMA at 0.5817, before testing 0.5800.
NZD/USD Price Chart – Daily
New Zealand Dollar Price This week
The table below shows the percentage change of New Zealand Dollar (NZD) against listed major currencies this week. New Zealand Dollar was the strongest against the Euro.
| USD | EUR | GBP | JPY | CAD | AUD | NZD | CHF | |
|---|---|---|---|---|---|---|---|---|
| USD | 1.41% | 0.18% | 1.14% | -0.36% | 0.52% | 0.94% | 1.26% | |
| EUR | -1.41% | -1.23% | -0.31% | -1.76% | -0.88% | -0.47% | -0.16% | |
| GBP | -0.18% | 1.23% | 0.74% | -0.55% | 0.34% | 0.76% | 1.07% | |
| JPY | -1.14% | 0.31% | -0.74% | -1.43% | -0.56% | -0.08% | 0.16% | |
| CAD | 0.36% | 1.76% | 0.55% | 1.43% | 0.85% | 1.37% | 1.63% | |
| AUD | -0.52% | 0.88% | -0.34% | 0.56% | -0.85% | 0.41% | 0.71% | |
| NZD | -0.94% | 0.47% | -0.76% | 0.08% | -1.37% | -0.41% | 0.32% | |
| CHF | -1.26% | 0.16% | -1.07% | -0.16% | -1.63% | -0.71% | -0.32% |
The heat map shows percentage changes of major currencies against each other. The base currency is picked from the left column, while the quote currency is picked from the top row. For example, if you pick the New Zealand Dollar from the left column and move along the horizontal line to the US Dollar, the percentage change displayed in the box will represent NZD (base)/USD (quote).

Acuity Trading هي شركة تكنولوجيا مالية مقرها لندن تأسست عام 2013، متخصصة في البيانات البديلة المدعومة بالذكاء الاصطناعي وتحليل المشاعر للتداول والاستثمار. أحدثت ثورة في تجربة التداول عبر الإنترنت عبر أدوات الأخبار البصرية والمشاعر، وتواصل اليوم ريادة السوق ببيانات بديلة مولدة للألفا وأدوات تداول جذابة مدعومة بأحدث أبحاث وتقنيات الذكاء الاصطناعي.
اقرأ المزيد


