
Trade The World
US Dollar Index Price Forecast: Drops to near 97.00 as bearish bias strengthens
بواسطة Akhtar Faruqui
تاريخ النشر: 16 Sep 2025 | تاريخ التعديل: 16 Sep 2025


POPULAR ARTICLES

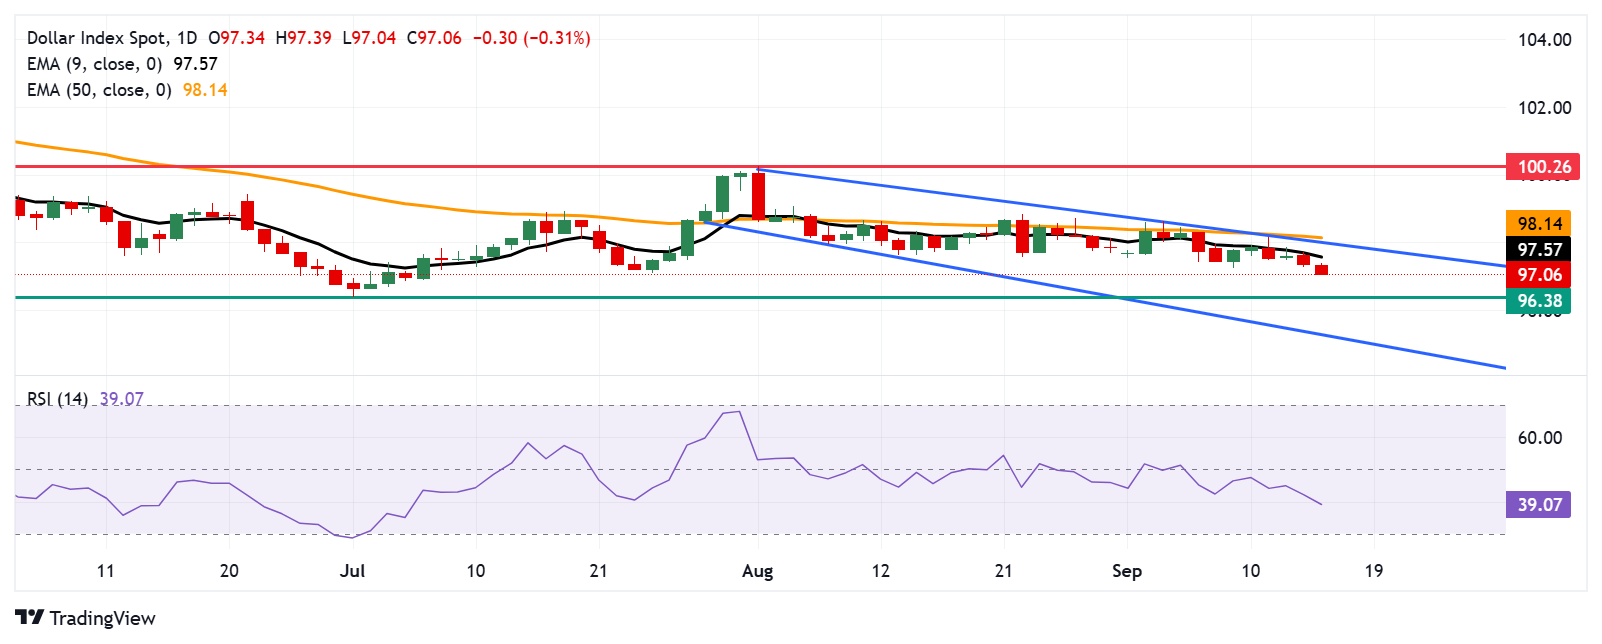
The US Dollar Index (DXY), which measures the value of the US Dollar (USD) against six major currencies, is extending its losses for the second consecutive session and trading around 97.10 during the European hours on Tuesday.
- The US Dollar Index is likely to encounter initial support around the psychological 97.00 level.
- Bearish bias prevails as the 14-day Relative Strength Index remains below the 50 level.
- The initial barrier appears at the nine-day EMA of 97.57.
The US Dollar Index (DXY), which measures the value of the US Dollar (USD) against six major currencies, is extending its losses for the second consecutive session and trading around 97.10 during the European hours on Tuesday. The technical analysis of the daily chart shows the dollar index consolidating within the descending channel pattern, suggesting a prevailing bearish bias.
The 14-day Relative Strength Index (RSI) is positioned below the 50 level, strengthening the bearish bias. Additionally, the short-term price momentum is weaker as the DXY remains below the nine-day Exponential Moving Average (EMA).
On the downside, the US Dollar Index may find its immediate support at the psychological level of 97.00, followed by 96.38, the lowest since February 2022, reached on July 1. Further declines would prompt the dollar index to test the lower boundary of the descending channel around 95.30.
The DXY may find its primary barrier at the nine-day EMA of 97.57. A break above this level would improve the short-term price momentum and support the dollar index to approach the descending channel’s upper boundary around the psychological level of 98.00, aligned with the 50-day EMA at 98.14.
US Dollar Index: Daily Chart
US Dollar Price Today
The table below shows the percentage change of US Dollar (USD) against listed major currencies today. US Dollar was the weakest against the Swiss Franc.
| USD | EUR | GBP | JPY | CAD | AUD | NZD | CHF | |
|---|---|---|---|---|---|---|---|---|
| USD | -0.33% | -0.28% | -0.26% | -0.06% | -0.01% | 0.01% | -0.34% | |
| EUR | 0.33% | 0.05% | -0.03% | 0.27% | 0.38% | 0.33% | -0.00% | |
| GBP | 0.28% | -0.05% | -0.06% | 0.22% | 0.34% | 0.29% | -0.07% | |
| JPY | 0.26% | 0.03% | 0.06% | 0.27% | 0.33% | 0.10% | -0.03% | |
| CAD | 0.06% | -0.27% | -0.22% | -0.27% | 0.06% | 0.03% | -0.28% | |
| AUD | 0.00% | -0.38% | -0.34% | -0.33% | -0.06% | 0.04% | -0.38% | |
| NZD | -0.01% | -0.33% | -0.29% | -0.10% | -0.03% | -0.04% | -0.30% | |
| CHF | 0.34% | 0.00% | 0.07% | 0.03% | 0.28% | 0.38% | 0.30% |
The heat map shows percentage changes of major currencies against each other. The base currency is picked from the left column, while the quote currency is picked from the top row. For example, if you pick the US Dollar from the left column and move along the horizontal line to the Japanese Yen, the percentage change displayed in the box will represent USD (base)/JPY (quote).

Acuity Trading
Acuity Trading هي شركة تكنولوجيا مالية مقرها لندن تأسست عام 2013، متخصصة في البيانات البديلة المدعومة بالذكاء الاصطناعي وتحليل المشاعر للتداول والاستثمار. أحدثت ثورة في تجربة التداول عبر الإنترنت عبر أدوات الأخبار البصرية والمشاعر، وتواصل اليوم ريادة السوق ببيانات بديلة مولدة للألفا وأدوات تداول جذابة مدعومة بأحدث أبحاث وتقنيات الذكاء الاصطناعي.
Read More


