
Aave Price Forecast: AAVE upside capped below $100 as DeFi rallies to support KelpDAO recovery
بواسطة John Isige
تم التحديث: 24 Apr 2026


المقالات الشائعة

Aave (AAVE) trades around $93.33 as of writing on Friday, as the liquidity crunch within decentralized finance (DeFi) continues to ripple in the sector following Sunday’s exploit on KelpDAO.
- Aave trades narrowly between $90.00 support and $100.00 resistance levels as post-hack liquidity crunch ripples through the DeFi platform.
- DeFi platforms, including LayerZero, Lido Finance, Ether.Fi and Ethena have committed to helping KelpDAO recover funds lost in Sunday’s exploit.
- KelpDAO has so far recovered 73,700 ETH with Arbitrum’s support, leaving a shortfall of roughly 89,500 ETH.
Aave (AAVE) trades around $93.33 as of writing on Friday, as the liquidity crunch within decentralized finance (DeFi) continues to ripple in the sector following Sunday’s exploit on KelpDAO.
The token’s upside appears limited below $100.00, while bulls hold firmly above $90.00 support, confining the price in a tight range. AAVE’s position below major down-sloping moving averages suggests that the broader trend is bearish, with recoveries likely to be limited or quickly absorbed.
KelpDAO recovers 74K ETH as liquidity crunch on Aave deepens
Aave and Kelp have continued to collaborate with other DeFi ecosystem partners following Sunday’s $290 million exploit. In addition to Arbitrum’s Security Council, which recovered 30,700 ETH, more platforms are joining in the quest, including LayerZero, Lido Finance, Ether.Fi, Ethena, Golem Network, Ink Foundation, Tydro, Mantle and Frax Finance.
A status report published by Kelp on Friday said that assets recovered total 73,700 ETH. Despite the efforts, Kelp DAO still faces a shortfall of approximately 89,500 ETH. Several networks, including Mantle, Stani, EtherFi, Lido and Golem, have confirmed an additional 43,500 ETH, which could help reduce the remaining gap.
Meanwhile, the liquidity crunch continues to reverberate through the Aave lending and borrowing platform, which faces an estimated $124 million to $230 million in bad debt.
Aave’s staking balance dropped by approximately 33% from $45 billion to $30 billion over a three-day period following the exploit, triggering a historic liquidity crunch.
Borrowing rates on Ethereum and stablecoins such as USDT and USDC exploded following the exploit, reaching highs of 8 and 14%, respectively. Asset holders rushed to borrow stablecoins to exit the Aave platform, which held as much as 83% of the exploited rsETH liquid staking token.
Mantle has proposed to extend a 30,000 ETH debt to Aave to help absorb the bad debt. If the proposal by the Mantle Core Contributor team passes, Aave could ease the liquidity crunch and lower borrowing rates. Mantle is expected to receive yield on the loan.
Technical outlook: AAVE extends sideways action
AAVE trades at $93.64, maintaining a bearish near-term bias as price holds well below the 50-day, 100-day, and 200-day Exponential Moving Averages (EMAs) at $103.97, $119.84, and $151.69, respectively. The SuperTrend reading at $116.63 also sits overhead, reinforcing a dominant cap from higher timeframe trend filters, while the downward resistance trendline is now referenced near $113.23.
Momentum conditions are weak rather than washed out, with the Relative Strength Index (RSI) hovering around 45 on the daily chart and the Moving Average Convergence Divergence (MACD) histogram in negative territory, hinting that sellers still retain control but without extreme downside acceleration.
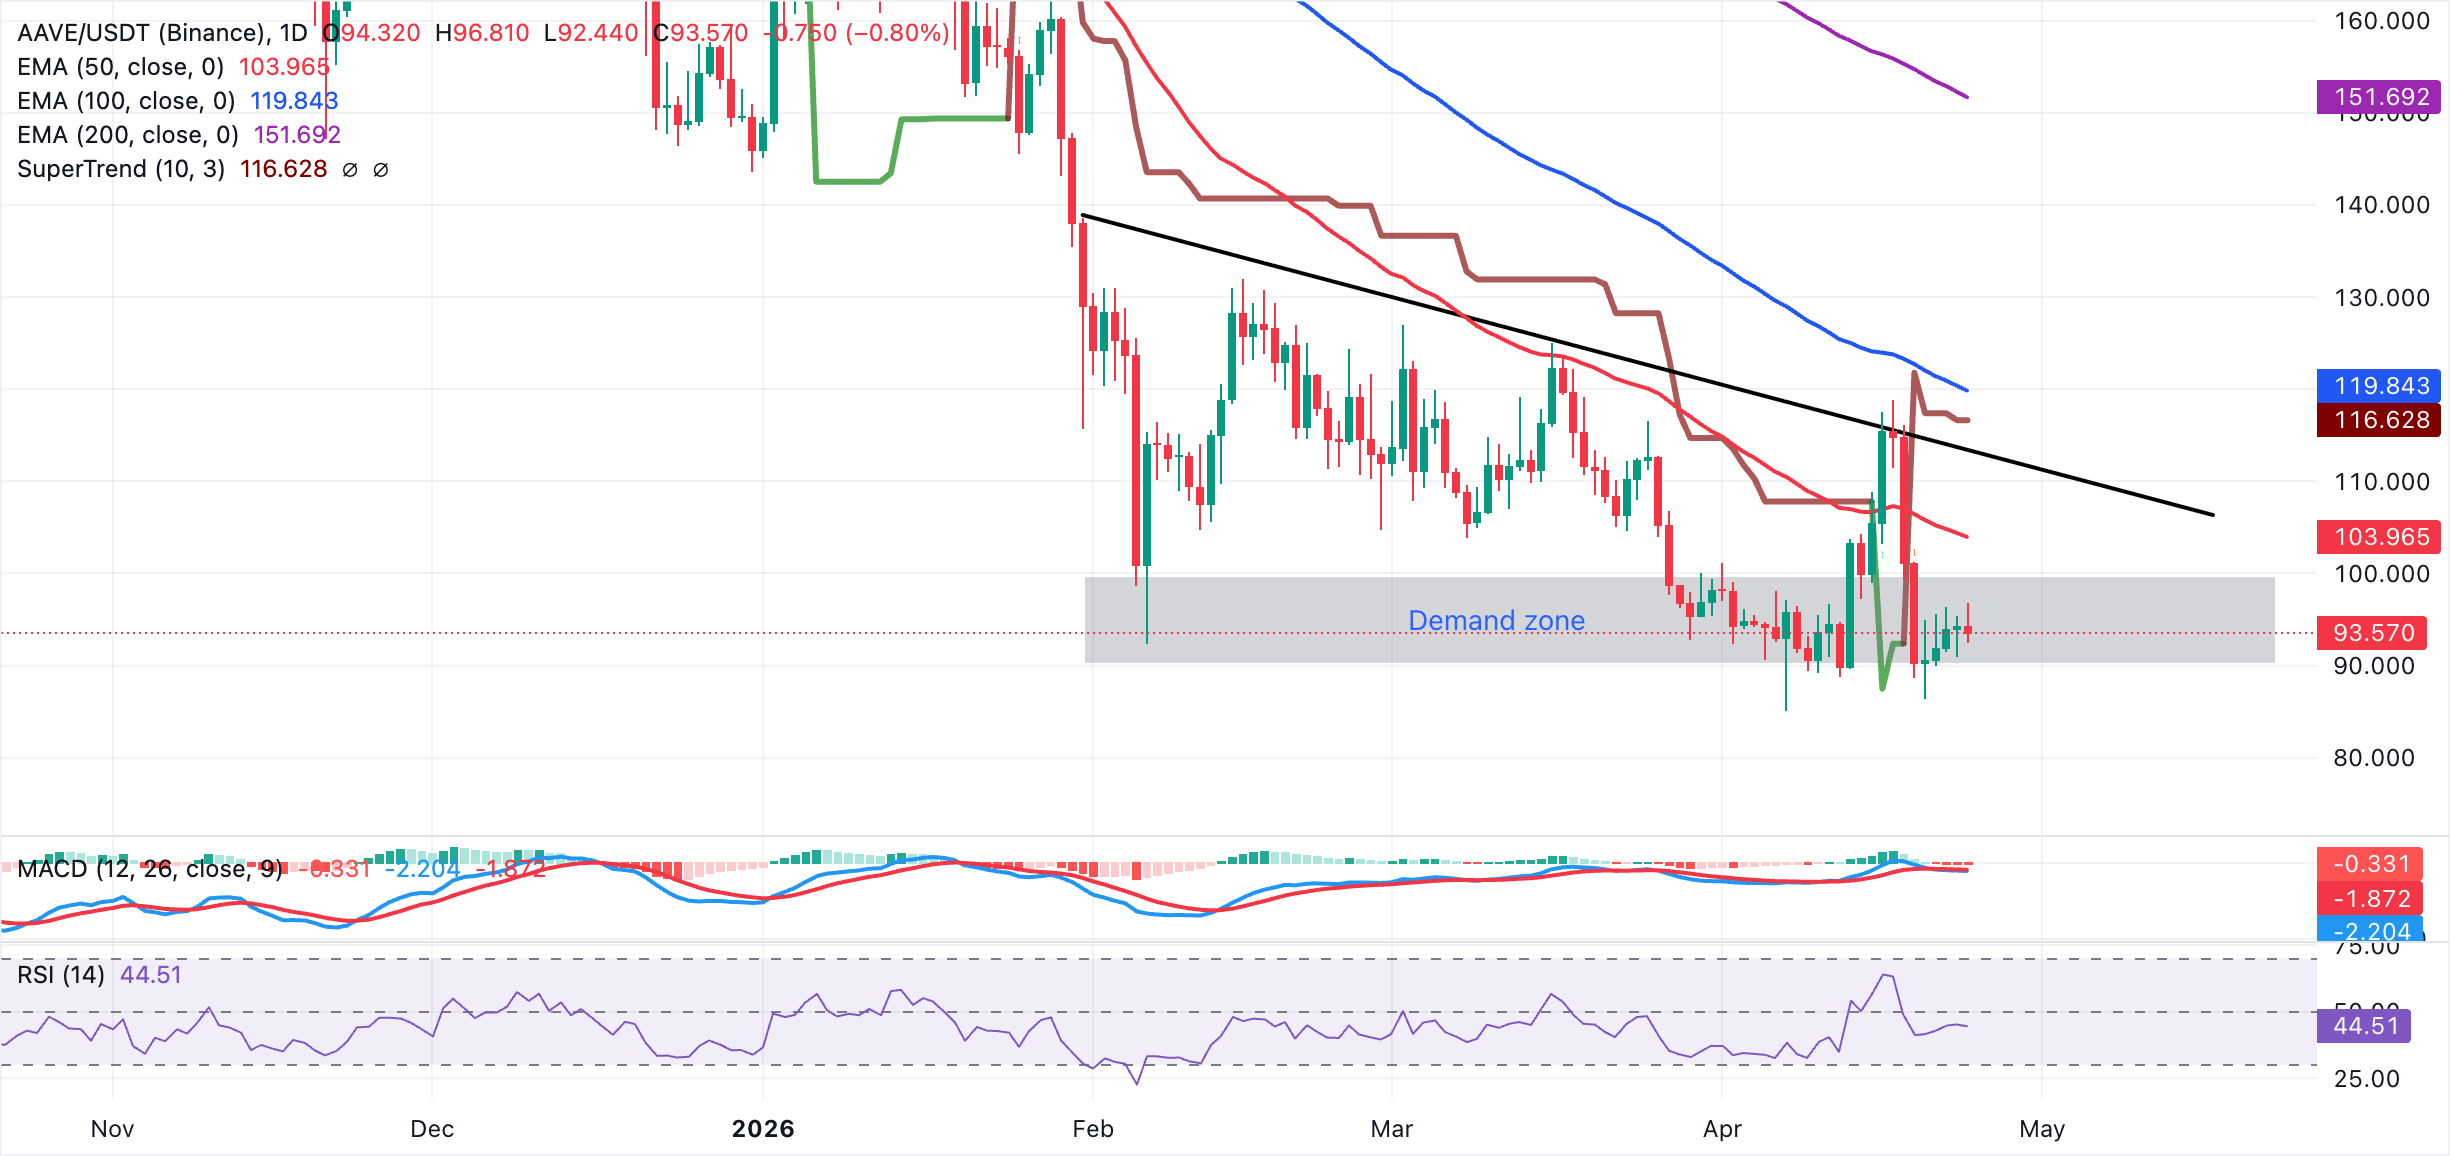
On the topside, initial resistance emerges at the 50-day EMA at $103.97, beyond which the descending trendline region around $113.23 and the SuperTrend barrier at $116.63 form a broader supply band. A sustained break above this cluster would then expose the 100-period EMA at $119.84, while the 200-period EMA at $151.69 remains a distant ceiling aligning with the broader downtrend. On the downside, initial support lies at $90.00. A drop below this demand area could leave AAVE vulnerable to further downside probes until a new base is established.
(The technical analysis of this story was written with the help of an AI tool.)
Bitcoin, altcoins, stablecoins FAQs
Bitcoin is the largest cryptocurrency by market capitalization, a virtual currency designed to serve as money. This form of payment cannot be controlled by any one person, group, or entity, which eliminates the need for third-party participation during financial transactions.
Altcoins are any cryptocurrency apart from Bitcoin, but some also regard Ethereum as a non-altcoin because it is from these two cryptocurrencies that forking happens. If this is true, then Litecoin is the first altcoin, forked from the Bitcoin protocol and, therefore, an “improved” version of it.
Stablecoins are cryptocurrencies designed to have a stable price, with their value backed by a reserve of the asset it represents. To achieve this, the value of any one stablecoin is pegged to a commodity or financial instrument, such as the US Dollar (USD), with its supply regulated by an algorithm or demand. The main goal of stablecoins is to provide an on/off-ramp for investors willing to trade and invest in cryptocurrencies. Stablecoins also allow investors to store value since cryptocurrencies, in general, are subject to volatility.
Bitcoin dominance is the ratio of Bitcoin's market capitalization to the total market capitalization of all cryptocurrencies combined. It provides a clear picture of Bitcoin’s interest among investors. A high BTC dominance typically happens before and during a bull run, in which investors resort to investing in relatively stable and high market capitalization cryptocurrency like Bitcoin. A drop in BTC dominance usually means that investors are moving their capital and/or profits to altcoins in a quest for higher returns, which usually triggers an explosion of altcoin rallies.

يعتمد أكثر من مليون مستخدم على FXStreet للحصول على بيانات سوقية لحظية، وأدوات رسوم بيانية، ورؤى خبراء، وأخبار الفوركس. يساعد تقويمهم الاقتصادي الشامل والندوات التعليمية عبر الويب المتداولين على البقاء على اطلاع واتخاذ قرارات محسوبة. لدى FXStreet فريق يضم حوالي 60 محترفًا موزعين بين مقر برشلونة ومناطق عالمية مختلفة.
اقرأ المزيد


