
Altcoins to watch: XRP and XLM rally as derivatives data signal bullish momentum
بواسطة Manish Chhetri
تاريخ النشر: 17 Mar 2026 | تاريخ التعديل: 17 Mar 2026


المقالات الشائعة

Ripple (XRP) and Stellar (XLM) are emerging as key cryptocurrencies to watch on Tuesday, as both altcoins extend gains following a bullish breakout on the previous day. XRP trades above the key resistance zone while XLM pushes higher after breaking out of a descending trendline.
- XRP price extends gains, trading above $1.54 on Tuesday after closing above the key resistance the previous day.
- XLM price trades above $0.175 after breaking above the descending trendline.
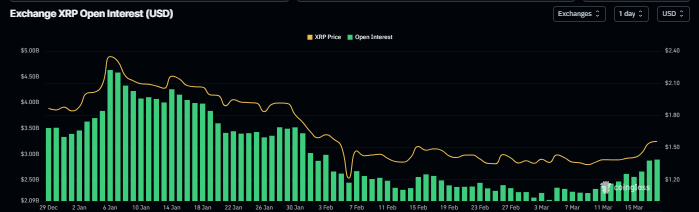
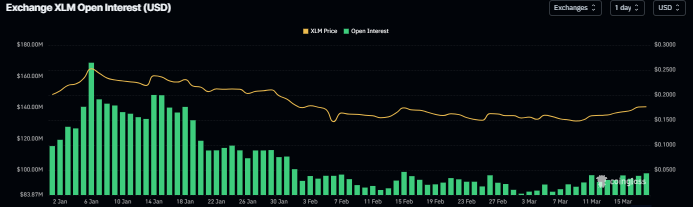
- Derivatives data for both altcoins suggest growing bullish momentum, with rising open interest backing the bullish outlook.
Ripple (XRP) and Stellar (XLM) are emerging as key cryptocurrencies to watch on Tuesday, as both altcoins extend gains following a bullish breakout on the previous day. XRP trades above the key resistance zone while XLM pushes higher after breaking out of a descending trendline. Derivatives data support this move, as both assets show rising Open Interest (OI), signaling new money entering the market and new buying, which could fuel the current price rise.
XRP and XLM open interest signal bullish outlook
CoinGlass OI for XRP and XLM surged to $2.89 billion and $97.78 million on Tuesday, respectively. For XRP, the current OI is at its highest level since early February, while for XLM, it is at its highest level since mid-February. These increasing OI represent new or additional money entering the market and new buying, which could fuel the current XRP and XLM price rally.
XRP technical outlook: XRP closes above 50-day EMA
XRP is trading at $1.54 on Tuesday after surging by more than 6% the previous day. XRP trades within a descending parallel channel that started above $2.80, but the latest rebound from near the $1.30 support and the push above the mid-$1.40s shifts the near-term bias to mildly bullish against that floor. Price now trades above the 50-day Exponential Moving Average (EMA) while remaining below the 100-day EMA, signalling an early recovery phase within a broader corrective structure.
The Relative Strength Index (RSI) on the daily chart is at 63, indicating upside momentum without overbought conditions, while the Moving Average Convergence Divergence (MACD) line is above its signal line and the zero line, with a positive histogram reinforcing improving bullish pressure.
Initial support is located at $1.45, where recent lows cluster, ahead of the stronger $1.30 horizontal level that underpinned the latest bounce and marks the lower bound of the current recovery scenario. A break below $1.30 would expose the channel base near $1.11 and weaken the nascent bullish tone.
On the upside, immediate resistance emerges at $1.60, followed by $1.75, in line with prior reaction highs within the channel. A daily close above $1.75 would open the way toward the $1.90 horizontal resistance, where the descending channel’s upper boundary is also projected to cap gains on first test.
-1773724313492-1773724313492.png)
XLM technical outlook: XLM closes above the descending trendline
XLM price is trading at $0.176 on Tuesday after breaking above the descending trendline the previous day. The near-term bias is cautiously bullish after the price extended its rebound following recent consolidation and closed above the 50-day EMA at $0.171.
However, XLM remains compressed well below the 100-day EMA near $0.195, yet the recent push back toward the former trendline break region around $0.170 signals improving sentiment.
Momentum supports this constructive tone, with the RSI on the daily chart rising to 64 and escaping its prior mid-range band, while the MACD line advances above its signal in positive territory and the histogram widens, indicating strengthening upside pressure.
Initial resistance now appears at the 23.6% Fibonacci retracement of the $0.136–$0.413 downswing at $0.201, where it converges with the 100-day EMA cluster to create a cap on the current bounce. A clear break above this barrier would open the way toward the 38.2% retracement at $0.242.
On the downside, immediate support is seen near $0.170, close to the prior downtrend resistance line’s break price at $0.171, followed by secondary support at $0.160, where recent consolidation lows formed. A daily close back below $0.160 would weaken the nascent bullish bias and expose the broader range toward $0.150.
-1773724340089-1773724340090.png)
(The technical analysis of this story was written with the help of an AI tool.)

يعتمد أكثر من مليون مستخدم على FXStreet للحصول على بيانات سوقية لحظية، وأدوات رسوم بيانية، ورؤى خبراء، وأخبار الفوركس. يساعد تقويمهم الاقتصادي الشامل والندوات التعليمية عبر الويب المتداولين على البقاء على اطلاع واتخاذ قرارات محسوبة. لدى FXStreet فريق يضم حوالي 60 محترفًا موزعين بين مقر برشلونة ومناطق عالمية مختلفة.
اقرأ المزيد


