
AUD/USD Price Forecast: Rises towards 0.7080 on overall USD weakness
بواسطة Christian Borjon Valencia
تاريخ النشر: 5 Mar 2026 | تاريخ التعديل: 5 Mar 2026


المقالات الشائعة

The AUD/USD reversed its course, climbing some 0.61% on Wednesday as the US Dollar remains on the backfoot due to an improvement in market mood, sponsored by solid US economic data. At the time of writing, the pair trades at 0.7077, poised to end near the day’s high.
- AUD/USD rises 0.61% to 0.7077 as risk appetite pushes the Dollar lower.
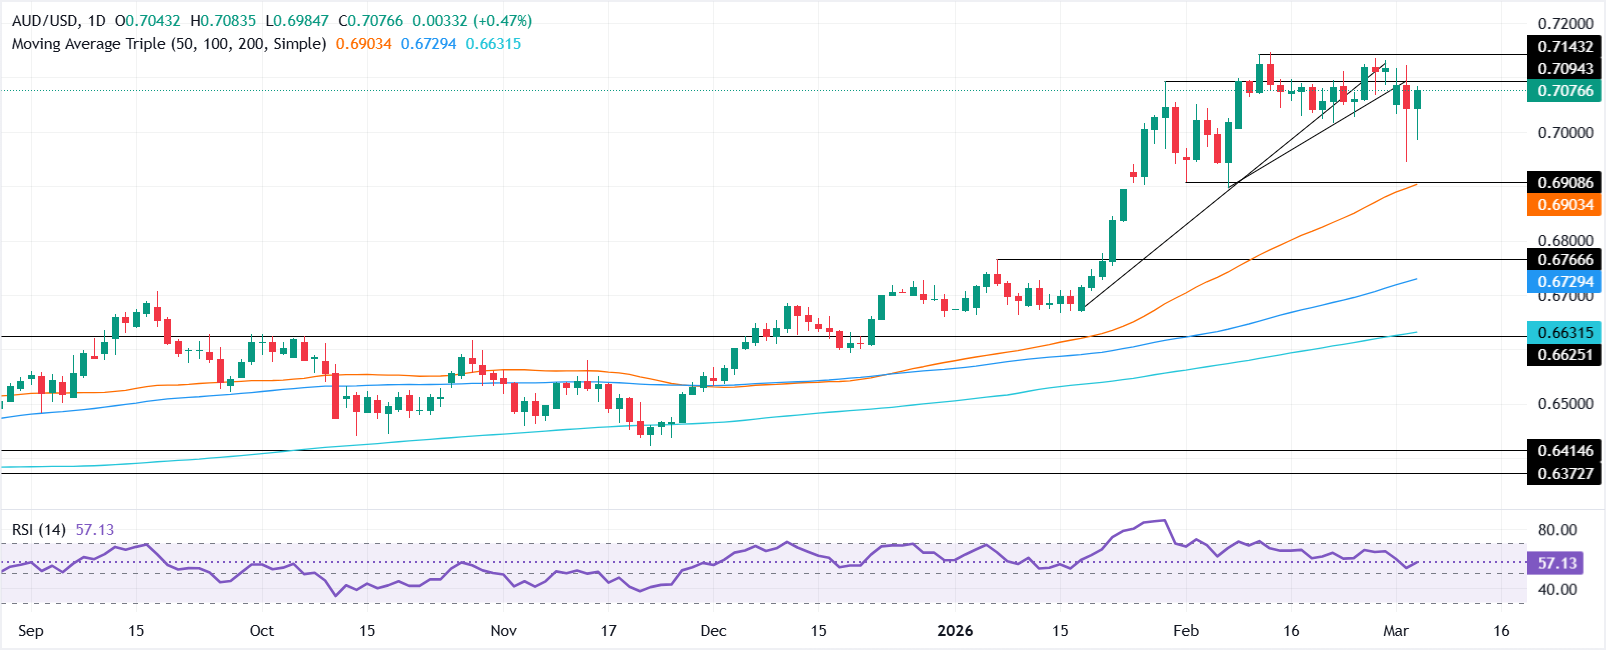
- Break above 0.7122 would expose the yearly high at 0.7147.
- Drop below 0.7000 risks retesting 0.6944 and the 50-day SMA at 0.6904.
The AUD/USD reversed its course, climbing some 0.61% on Wednesday as the US Dollar remains on the backfoot due to an improvement in market mood, sponsored by solid US economic data. At the time of writing, the pair trades at 0.7077, poised to end near the day’s high.
AUD/USD Price Forecast: Technical outlook
The AUD/USD technical picture remains bullishly biased after the nearly 1% loss on Tuesday, which pushed the Aussie to a fresh four-week low of 0.6944. Despite this, momentum seems constructive as depicted by the Relative Strength Index (RSI) with the index above its 50-neutral level and aiming higher.
Given the backdrop, the AUD/USD could extend its gains if bull reclaimed the March 3 daily high of 0.7122. A decisive break will expose the yearly high of 0.7147 ahead of 0.7200.
On the downside, the first support is seen at 0.7000. A breach of the latter will expose the March 3 swing log of 0.6944 ahead of the 50-day SMA at 0.6904.
AUD/USD Price Chart – Daily
Australian Dollar Price This week
The table below shows the percentage change of Australian Dollar (AUD) against listed major currencies this week. Australian Dollar was the strongest against the Swiss Franc.
| USD | EUR | GBP | JPY | CAD | AUD | NZD | CHF | |
|---|---|---|---|---|---|---|---|---|
| USD | 1.13% | 0.35% | 0.64% | -0.02% | -0.32% | 0.23% | 1.52% | |
| EUR | -1.13% | -0.78% | -0.49% | -1.14% | -1.44% | -0.90% | 0.38% | |
| GBP | -0.35% | 0.78% | 0.11% | -0.37% | -0.67% | -0.13% | 1.16% | |
| JPY | -0.64% | 0.49% | -0.11% | -0.62% | -0.92% | -0.30% | 0.90% | |
| CAD | 0.02% | 1.14% | 0.37% | 0.62% | -0.34% | 0.31% | 1.54% | |
| AUD | 0.32% | 1.44% | 0.67% | 0.92% | 0.34% | 0.54% | 1.85% | |
| NZD | -0.23% | 0.90% | 0.13% | 0.30% | -0.31% | -0.54% | 1.30% | |
| CHF | -1.52% | -0.38% | -1.16% | -0.90% | -1.54% | -1.85% | -1.30% |
The heat map shows percentage changes of major currencies against each other. The base currency is picked from the left column, while the quote currency is picked from the top row. For example, if you pick the Australian Dollar from the left column and move along the horizontal line to the US Dollar, the percentage change displayed in the box will represent AUD (base)/USD (quote).

يعتمد أكثر من مليون مستخدم على FXStreet للحصول على بيانات سوقية لحظية، وأدوات رسوم بيانية، ورؤى خبراء، وأخبار الفوركس. يساعد تقويمهم الاقتصادي الشامل والندوات التعليمية عبر الويب المتداولين على البقاء على اطلاع واتخاذ قرارات محسوبة. لدى FXStreet فريق يضم حوالي 60 محترفًا موزعين بين مقر برشلونة ومناطق عالمية مختلفة.
اقرأ المزيد


