
Bitcoin Price Forecast: BTC slips below $80,000 as ETF outflows, profit-taking activity intensify
بواسطة Manish Chhetri
تم التحديث: 14 May 2026


المقالات الشائعة

Bitcoin (BTC) fell below $80,000 on Thursday after failing to overcome a key overhead supply area earlier this week.
- Bitcoin edges below $80,000 after being rejected by the key 200-day EMA supply zone earlier this week.
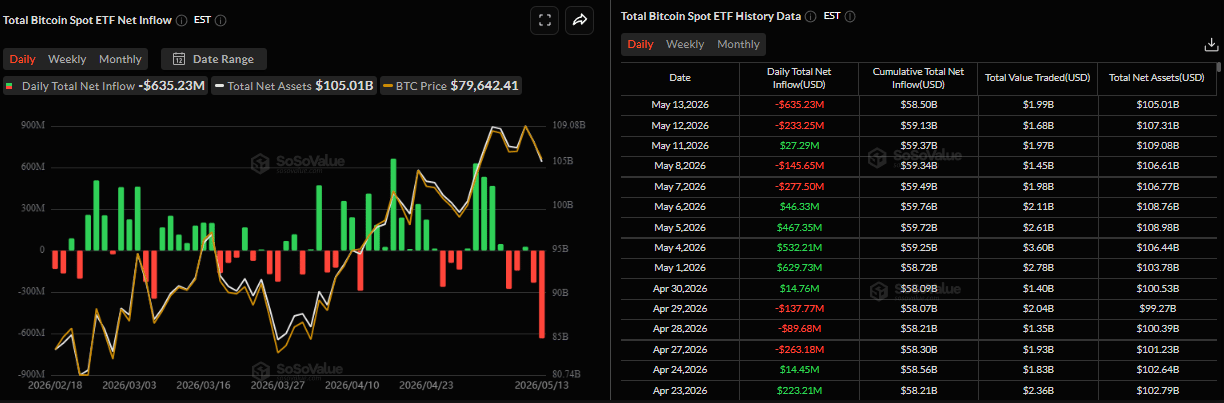
- US-listed spot ETFs recorded an outflow of $635 million on Wednesday, the highest single-day withdrawals since the end of January.
- Increasing profit-taking among investors adds to selling pressure.
Bitcoin (BTC) fell below $80,000 on Thursday after failing to overcome a key overhead supply area earlier this week. Fading institutional demand is contributing to this price pullback, with spot Exchange Traded Funds (ETFs) recording outflows of over $635 million on Wednesday, the highest single-day figure since the end of January. In addition, traders’ profit-taking activity surges to a five-month high, further intensifying selling pressure in Crypto King.
Highest single-day ETF outflow in three months
Institutional demand for Bitcoin has weakened this week so far. SoSoValue data shows that US-listed spot ETFs recorded an outflow of $635.23 million on Wednesday, marking the second consecutive day of withdrawals this week. Wednesday’s outflow was the highest since the end of January. If these outflows continue and intensify, the BTC price correction could continue.
Profit-taking activity accelerates the selling pressure
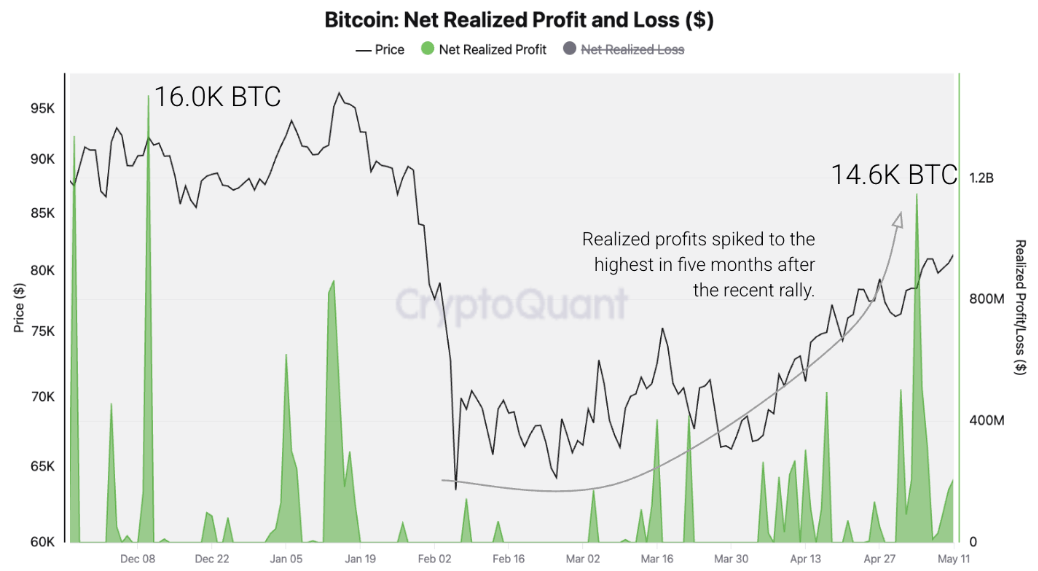
CryptoQuant’s weekly report on Wednesday said traders may have started taking profits in a significant way.
The chart below shows that Bitcoin holders realized 14,6000 BTC in daily profits on May 4, the highest level since December 10, as the 37% rally from the April lows pushed holders back into profitable territory. Historically, this anticipates lower prices as traders start to sell.
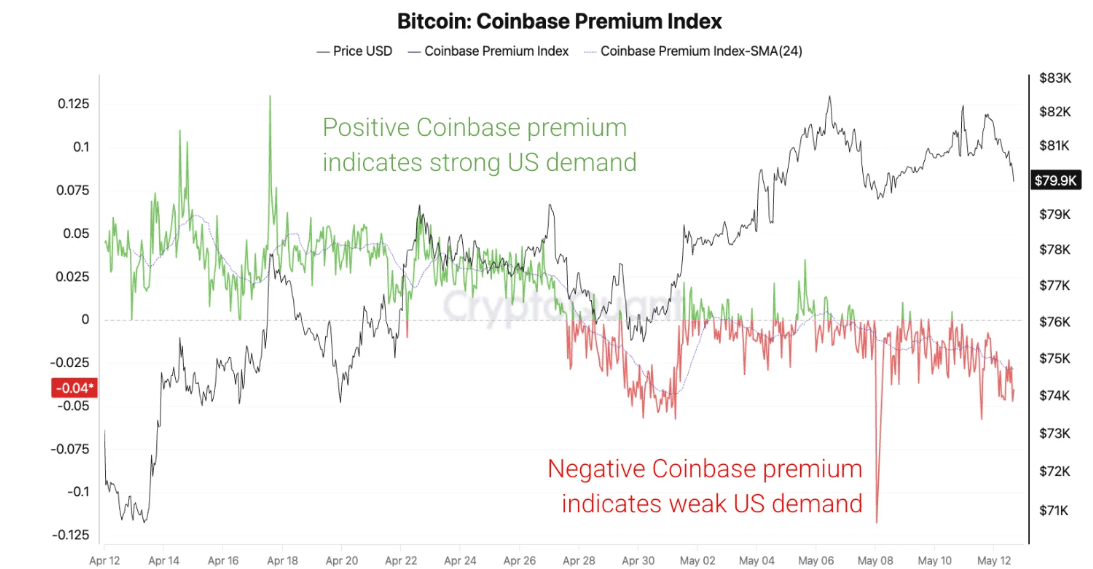
In addition to this increased profit-taking activity, US investor demand eased as Bitcoin’s price approached $80,000. The Coinbase Bitcoin Price Premium chart below has turned negative since late April, indicating that Bitcoin demand in the US has slowed (which also coincides with the ETF outflows discussed above).
Major bear market resistance
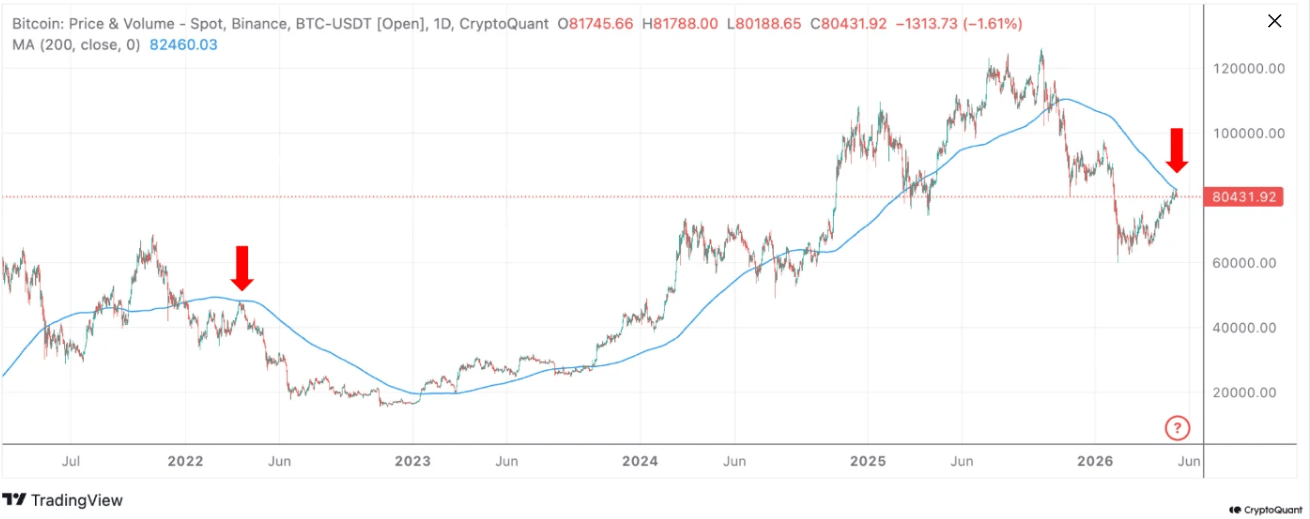
As explained in a previous report, the BTC price surge in April is mostly driven by perpetual futures demand, while spot markets remain in contraction. This market structure is more speculative than fundamental, mirroring the pattern seen at the onset of the 2022 bear market.
BTC is facing resistance at the 200-day Moving Average (MA) near $82,400, as shown in the chart below. The 200-day MA was a major resistance in the 2022 bear market: the price resumed its downward trend after hitting it in March of that year.
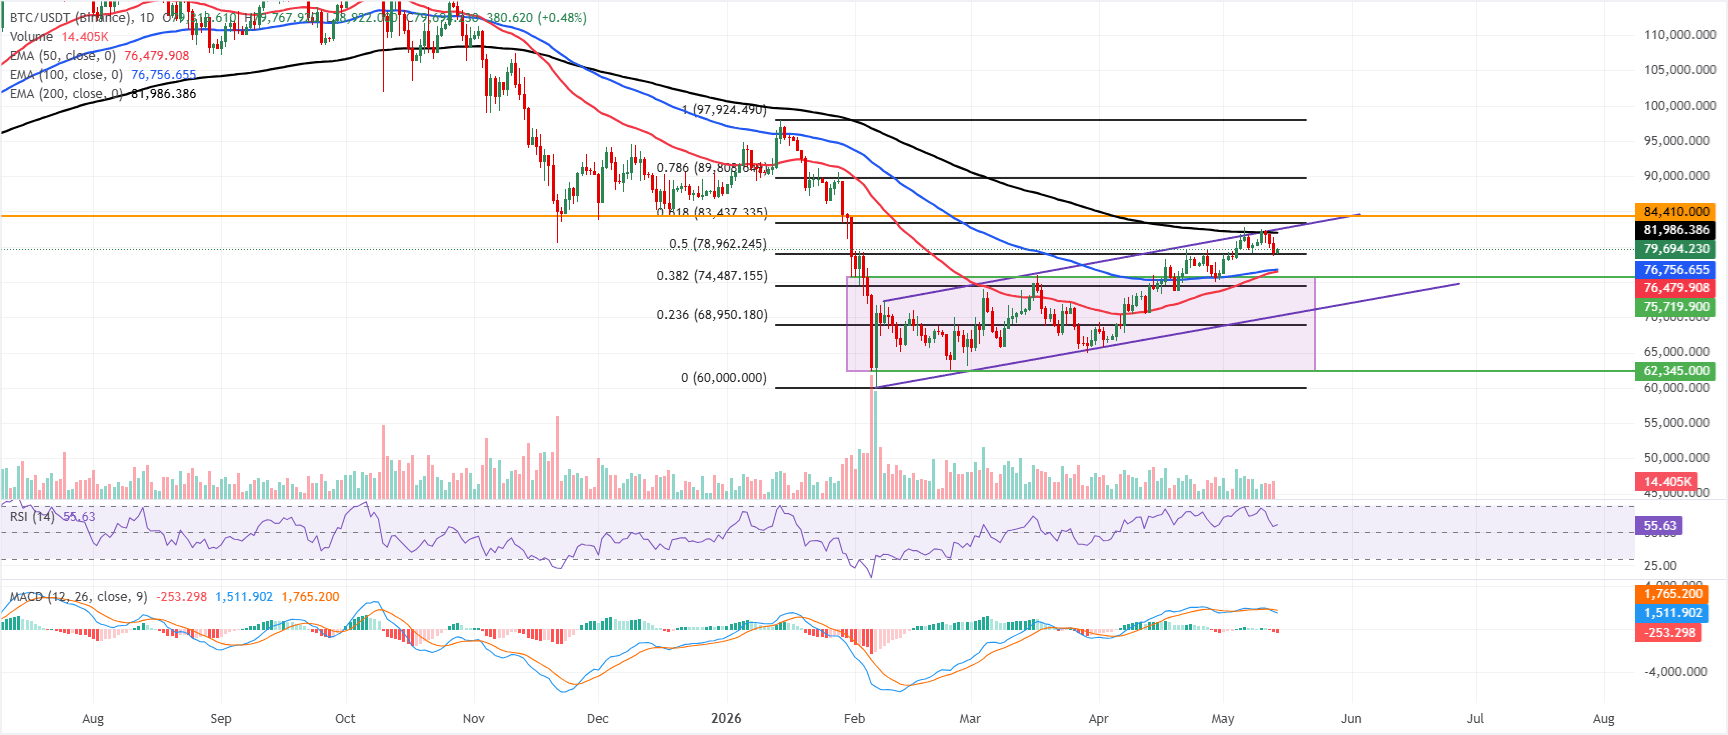
Bitcoin Price Forecast: BTC rejects from 200-day EMA
Bitcoin price is trading at $79,700 on Thursday after being rejected from the overhead supply and correcting for three consecutive days this week. The Crypto King is still holding above the 50-day and 100-day Exponential Moving Averages (EMAs), clustered just under $76,800, but still capped below the 200-day EMA at $81,986 and the key 61.8% Fibonacci retracement at $83,437 (drawn from the January high to the February low).
This configuration suggests a mildly constructive bias while the pair consolidates within the broader uptrend, with the Relative Strength Index (RSI) hovering in the mid‑50s and the Moving Average Convergence Divergence (MACD) line remaining in negative territory, hinting that upside momentum is tentative despite price resilience.
On the downside, initial support is seen at the 50% retracement around $78,962, ahead of the 100-day EMA at $76,756 and the 50-day EMA at $76,479. Further down, there's the 38.2% Fibonacci retracement near $74,487 and the previously broken upward trendline around $70,171, reinforced by the 23.6% Fibonacci retracement level at $68,950.
On the topside, bulls need to clear the 200-day EMA at $81,986 first, with further resistance emerging at the 61.8% retracement at $83,437 and then the horizontal barrier around $84,410. A daily close above that latter level would strengthen the case for a renewed push towards the January highs of $97,924.
(The technical analysis of this story was written with the help of an AI tool.)
Bitcoin, altcoins, stablecoins FAQs
Bitcoin is the largest cryptocurrency by market capitalization, a virtual currency designed to serve as money. This form of payment cannot be controlled by any one person, group, or entity, which eliminates the need for third-party participation during financial transactions.
Altcoins are any cryptocurrency apart from Bitcoin, but some also regard Ethereum as a non-altcoin because it is from these two cryptocurrencies that forking happens. If this is true, then Litecoin is the first altcoin, forked from the Bitcoin protocol and, therefore, an “improved” version of it.
Stablecoins are cryptocurrencies designed to have a stable price, with their value backed by a reserve of the asset it represents. To achieve this, the value of any one stablecoin is pegged to a commodity or financial instrument, such as the US Dollar (USD), with its supply regulated by an algorithm or demand. The main goal of stablecoins is to provide an on/off-ramp for investors willing to trade and invest in cryptocurrencies. Stablecoins also allow investors to store value since cryptocurrencies, in general, are subject to volatility.
Bitcoin dominance is the ratio of Bitcoin's market capitalization to the total market capitalization of all cryptocurrencies combined. It provides a clear picture of Bitcoin’s interest among investors. A high BTC dominance typically happens before and during a bull run, in which investors resort to investing in relatively stable and high market capitalization cryptocurrency like Bitcoin. A drop in BTC dominance usually means that investors are moving their capital and/or profits to altcoins in a quest for higher returns, which usually triggers an explosion of altcoin rallies.

يعتمد أكثر من مليون مستخدم على FXStreet للحصول على بيانات سوقية لحظية، وأدوات رسوم بيانية، ورؤى خبراء، وأخبار الفوركس. يساعد تقويمهم الاقتصادي الشامل والندوات التعليمية عبر الويب المتداولين على البقاء على اطلاع واتخاذ قرارات محسوبة. لدى FXStreet فريق يضم حوالي 60 محترفًا موزعين بين مقر برشلونة ومناطق عالمية مختلفة.
اقرأ المزيد


