
Bitcoin Price Forecast: BTC slips crucial support as Fed’s hawkish tone weighs on market sentiment
بواسطة Manish Chhetri
تاريخ النشر: 19 Mar 2026 | تاريخ التعديل: 19 Mar 2026


المقالات الشائعة

Bitcoin (BTC) is trading below $71,000 at the time of writing on Thursday, down nearly 4% so far this week and slipping under a key support zone.
- Bitcoin price slips below $71,000 on Thursday, nearly 4% down so far this week.
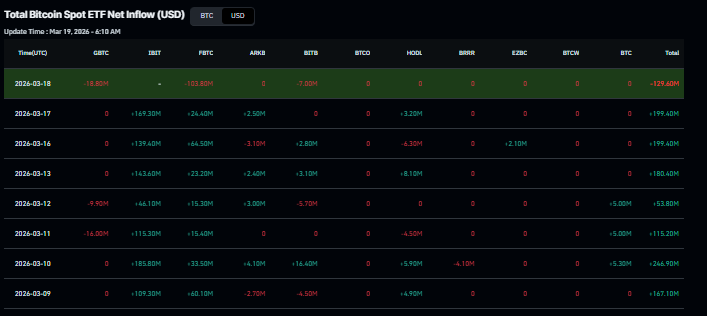
- US-listed spot BTC ETF recorded an outflow of $129 million on Wednesday, snapping a seven-day inflow streak.
- The Fed’s hawkish tone and Powell’s remarks dampen overall risk appetite.
Bitcoin (BTC) is trading below $71,000 at the time of writing on Thursday, down nearly 4% so far this week and slipping under a key support zone. Institutional demand also shows early signs of weakness as US-listed spot Bitcoin Exchange Traded Funds (ETFs) recorded mild outflows on Wednesday, breaking a seven-day inflow streak. Meanwhile, risk sentiment has dampened following the Federal Reserve's (Fed) hawkish tone in its March monetary policy decision, further weighing on the Crypto King’s price.
Fed’s hawkish tone weighs on BTC price
Bitcoin trades red for the third consecutive day so far this week, erasing Monday's gains and slipping below $71,000 during the early European trading session on Thursday.
The price pullback is further fueled by the Fed’s hawkish tone on Wednesday, when the US central bank kept the interest rates unchanged at 3.50%–3.75% after its March meeting.
In fact, the US central bank raised the year-end Personal Expenditures Price (PCE) inflation outlook to 2.7% from 2.4% in December, citing risks from higher energy prices due to the Iran war. The Fed also upgraded its 2026 growth projection and projected only one rate reduction this year, and one in 2027.
This hawkish tone boosted the US Dollar (USD), while damping risk appetite and weighing on risky assets such as Bitcoin, which lost 3.6% on the day.
In an exclusive interview with Lacie Zhang, Research Analyst at Bitget Wallet, told FXStreet, “A hawkish hold from the Fed, where rates stay unchanged but the dot plot shifts from two cuts to one, potentially delayed beyond July, would likely be a mild near-term headwind for Bitcoin.”
Zhang continued, “The issue isn’t the hold itself, which is largely priced in, but the signal that the Fed has less flexibility to ease amid rising inflation risks, particularly driven by higher energy prices linked to Middle East tensions. This keeps macro liquidity expectations constrained, which typically caps BTC upside in the short term. The key variable now is whether inflation pressures prove temporary; if energy prices stabilize, risk assets, including BTC could regain momentum, but if inflation persists, the Fed may remain in a prolonged wait-and-see mode, extending the current ceiling on crypto markets.”
Institutional demand records a mild outflow
Institutional demand for Bitcoin shows early signs of weakness. According to Coinglass data, spot Bitcoin ETFs recorded a mild outflow of $129.60 million on Wednesday, snapping a seven-day inflow streak. If this outflow trend continues and intensifies, BTC could undergo further correction in the upcoming days.
Meanwhile, the Arkham data shows that a dormant whale wallet sold another 1,000 BTC on Wednesday, worth $71.5 million. This wallet had accumulated 5,000 BTC about 13 years ago, sold nearly 3,500 BTC, and still holds around 1,500 BTC, worth about $106.8 million.
One bounce does not make a bull
Bitcoin price has shown some signs of resilience in the past week, compared to Gold and Equities amid the Iran war.
Glassnode's weekly report on Wednesday stated that while the breakout above $70,000 and the subsequent move into the ($72K to $82K) air gap are encouraging, a single constructive price push falls short of confirming a decisive structural shift.
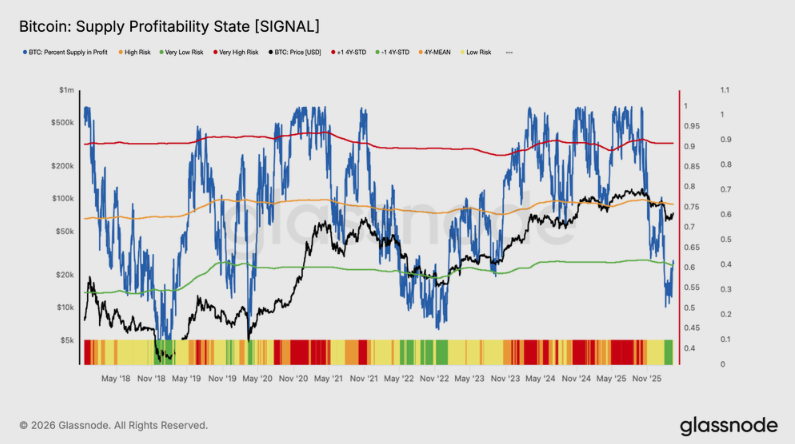
The analyst further explained that historically, recoveries from deep bear markets into early bull-market conditions have been validated by investor profitability, as shown in the chart below.
“The recent price move has lifted this metric to around 60%, a level consistent with comparable early bounces in prior cycle bottoms, where market exhaustion at first recovery attempts was a common feature. A sustained push above 75% would carry considerably more weight as confirmation of early bull-market conditions, whereas continued rejection near current levels would reinforce the bear-market recovery narrative,” said the Glassnode analyst.
Meanwhile, the report also highlighted that the Chicago Mercantile Exchange (CME) futures positioning remains subdued, indicating the recovery is being driven primarily by spot flows rather than leveraged speculation.
Bitcoin Price Forecast: BTC slips below key support
Bitcoin's price is extending its correction, trading below $71,000 at writing on Thursday, down nearly 4% so far this week. The near-term bias is mildly bearish as price holds within a parallel channel, with its upper boundary near $72,600 continuing to cap advances. BTC failed to find support around the previously broken 50-day Exponential Moving Average near $72,800, and this could weigh on recovery attempts.
The Relative Strength Index (RSI) on the daily chart at 49 leans slightly below its midline, suggesting momentum has faded after the recent bounce, while the Moving Average Convergence Divergence (MACD) indicator remains in positive territory, but its line has been slipping toward the signal line, hinting at weakening upside pressure inside the broader down-drifting structure.
Immediate resistance emerges around the channel top at $72,600, with the 50-day EMA nearly converging around $72,800 to form a stronger barrier; a daily close above this zone would be needed to challenge Monday’s high at $76,000.
On the downside, initial support is near the channel midpoint at $69,200, followed by the recent swing low at $65,900, where the channel’s lower boundary is anchored. A break below $65,900 would extend the corrective phase toward lower levels, while holding above this band keeps the pair in a contained consolidation.
-1773914657150-1773914657151.png)
(The technical analysis of this story was written with the help of an AI tool.)
Bitcoin, altcoins, stablecoins FAQs
Bitcoin is the largest cryptocurrency by market capitalization, a virtual currency designed to serve as money. This form of payment cannot be controlled by any one person, group, or entity, which eliminates the need for third-party participation during financial transactions.
Altcoins are any cryptocurrency apart from Bitcoin, but some also regard Ethereum as a non-altcoin because it is from these two cryptocurrencies that forking happens. If this is true, then Litecoin is the first altcoin, forked from the Bitcoin protocol and, therefore, an “improved” version of it.
Stablecoins are cryptocurrencies designed to have a stable price, with their value backed by a reserve of the asset it represents. To achieve this, the value of any one stablecoin is pegged to a commodity or financial instrument, such as the US Dollar (USD), with its supply regulated by an algorithm or demand. The main goal of stablecoins is to provide an on/off-ramp for investors willing to trade and invest in cryptocurrencies. Stablecoins also allow investors to store value since cryptocurrencies, in general, are subject to volatility.
Bitcoin dominance is the ratio of Bitcoin's market capitalization to the total market capitalization of all cryptocurrencies combined. It provides a clear picture of Bitcoin’s interest among investors. A high BTC dominance typically happens before and during a bull run, in which investors resort to investing in relatively stable and high market capitalization cryptocurrency like Bitcoin. A drop in BTC dominance usually means that investors are moving their capital and/or profits to altcoins in a quest for higher returns, which usually triggers an explosion of altcoin rallies.

يعتمد أكثر من مليون مستخدم على FXStreet للحصول على بيانات سوقية لحظية، وأدوات رسوم بيانية، ورؤى خبراء، وأخبار الفوركس. يساعد تقويمهم الاقتصادي الشامل والندوات التعليمية عبر الويب المتداولين على البقاء على اطلاع واتخاذ قرارات محسوبة. لدى FXStreet فريق يضم حوالي 60 محترفًا موزعين بين مقر برشلونة ومناطق عالمية مختلفة.
اقرأ المزيد


