
Bitcoin Price Forecast: BTC struggles below 200-day EMA as US CPI data looms
بواسطة Manish Chhetri
تم التحديث: 12 May 2026


المقالات الشائعة

Bitcoin (BTC) struggles around key technical levels, trading around $81,000 at the time of writing on Tuesday.
- Bitcoin price trades around $81,000 on Tuesday, facing rejection around the key 200-day EMA near $82,130.
- US-listed spot BTC ETFs recorded a fresh inflow on Monday, and Strategy added another 535 BTC to its reserve.
- Market participants await US CPI data, which could bring in fresh volatility to risky assets such as BTC.
Bitcoin (BTC) struggles around key technical levels, trading around $81,000 at the time of writing on Tuesday. Institutional and corporate demand support the Crypto King’s price with Exchange-traded Funds (ETFs) recording fresh inflow alongside Strategy (MSTR) adding another 535 BTC to its reserve on Monday. Meanwhile, traders await the key US Consumer Price Index (CPI) figures, which could trigger fresh volatility across the largest cryptocurrency by market capitalization.
US CPI could trigger volatility across risky assets
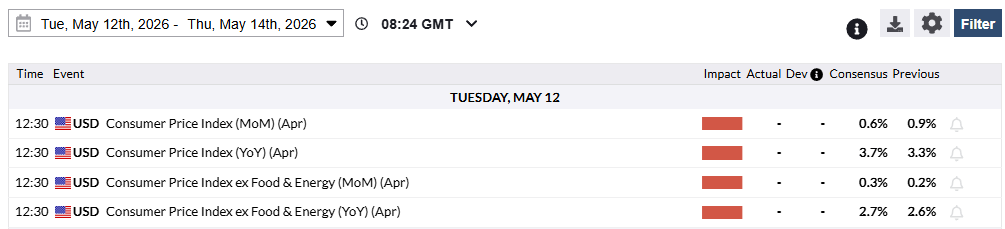
Bitcoin traders await the key US CPI data for April, scheduled for release at 12:30 GMT on Tuesday, as shown in the chart below. The report is expected to show another significant leap in consumer inflation after March’s sharp increase, driven by the elevated Oil prices due to the ongoing conflict between the US and Iran.
The monthly CPI is forecast to rise 0.6%, following the 0.9% increase recorded in March, while the annual reading is seen climbing to its highest level since September 2023 at 3.7%, from 3.3% in March. Core CPI figures, which exclude volatile food and energy prices, are expected to come in at 0.3% and 2.7% on a monthly and yearly basis, respectively.
In addition, the incoming negative headlines surrounding the Middle East crisis dampen hopes for a US-Iran peace deal, bolster the US Dollar’s (USD) status as a reserve currency, and weigh on short-term risk appetite.
Generally, the inflation data shapes expectations for upcoming Fed interest rate cuts, potentially triggering volatility in the Crypto King. The market’s reaction to April’s CPI report could influence risk sentiment and drive fresh price swings in risky assets such as Bitcoin.
Meanwhile, elevated Crude Oil prices are adding to inflationary pressures, reinforcing expectations of a more hawkish stance from major central banks, including the US Federal Reserve (Fed), which could weigh on BTC’s upside momentum.
Institutional and corporate demand hold strong
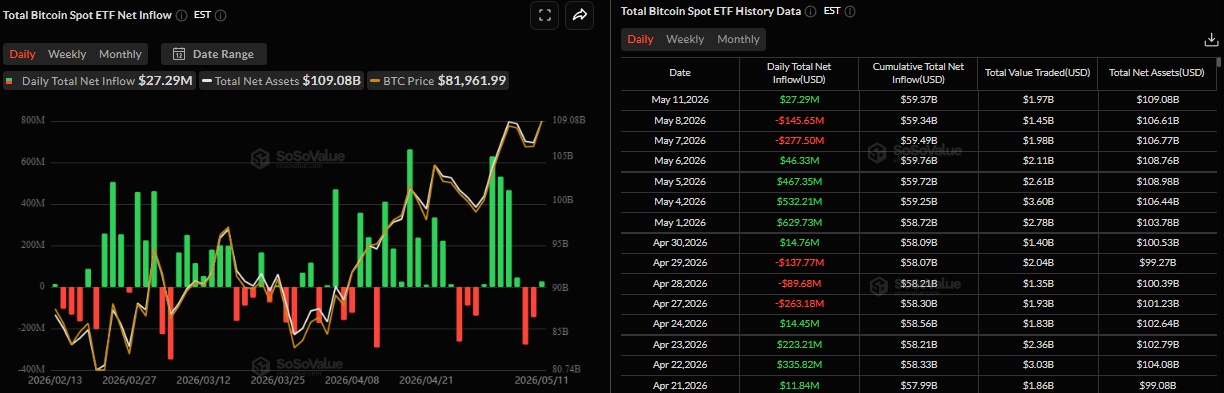
Institutional demand for Bitcoin started the week on a positive note. SoSoValue data showed that spot BTC ETFs recorded inflows of $27.25 million on Monday, breaking a two-day streak of outflows from the previous week. However, these inflows were mild, highlighting a cautious stance among investors. Moreover, if this positive flow continues and intensifies this week, the BTC price could rally further.
On the corporate side, Michael Saylor announced on Monday that his firm, Strategy, added another 535 BTC to its treasury reserve, bringing the total holding to 818,869 BTC. The company has been consistently adding BTC over the past few months, with an average purchase price of $75,540, which is above the current trading level.
Bitcoin Price Forecast: BTC faces resistance around the 200-day EMA
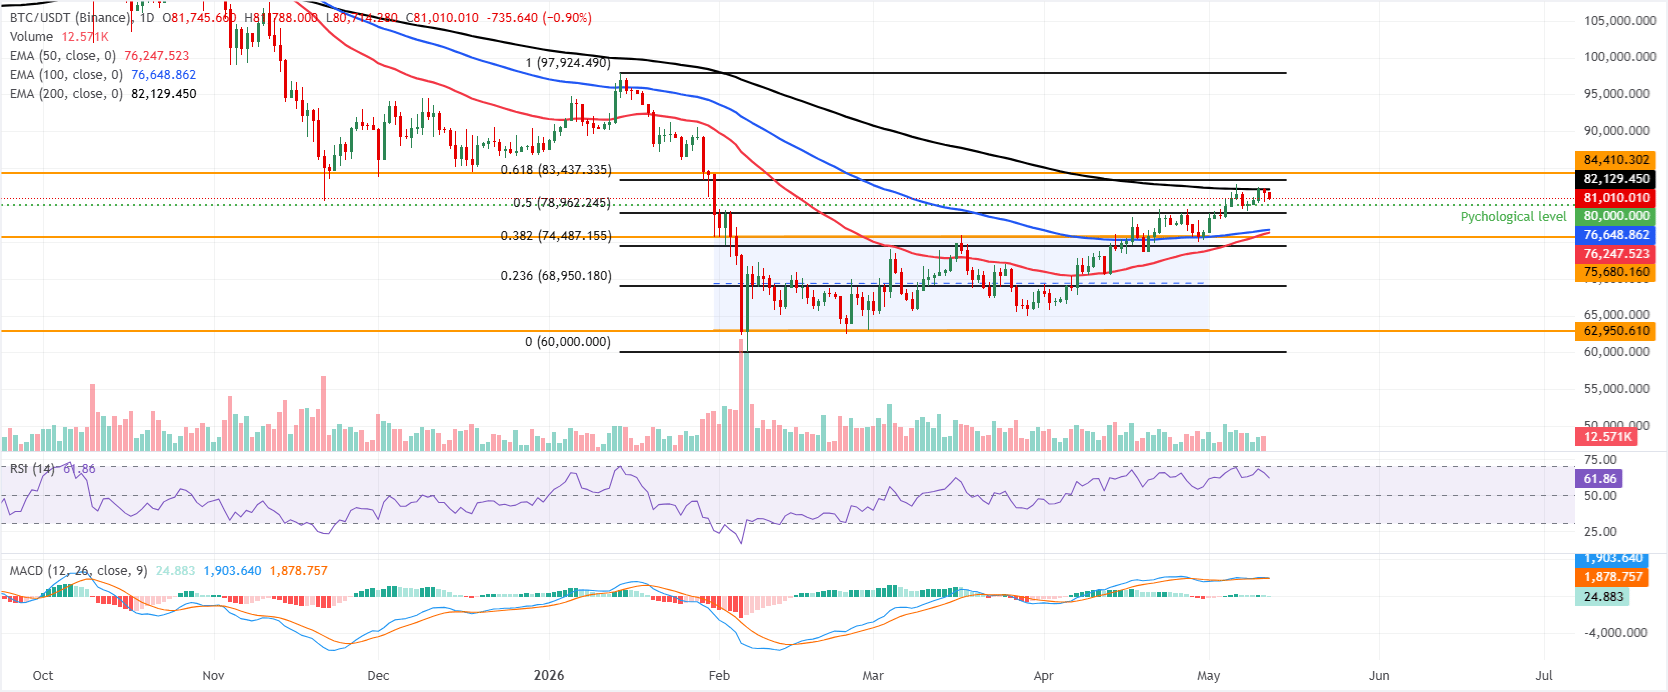
Bitcoin is trading at $81,000 on Tuesday, maintaining a constructive bullish bias as it holds above the 50-day and 100-day Exponential Moving Averages (EMAs), clustered just below 76,700 and well above the upper boundary of the previously broken parallel channel.
The Crypto King is also trading above the 50% Fibonacci retracement at $78,962 (drawn from January high to February low) and the psychological support around $80,000, suggesting dips remain supported, while the 200-day EMA near $82,130 forms the next topside cap.
The Relative Strength Index (RSI) on the daily chart is around 61, and the Moving Average Convergence Divergence (MACD) is mildly positive, both hinting that upside momentum persists, albeit without strong overbought conditions.
On the topside, immediate resistance emerges at the 200-day EMA around $82,130, followed by the 61.8% Fibonacci retracement at roughly $83,437 and the horizontal barrier near $84,410, which together define a dense supply zone that bulls would need to clear to extend the uptrend.
On the downside, initial support is seen at the psychological $80,000 level, ahead of the 50% retracement at $78,962, with the 100-day and 50-day EMAs near $76,647 and $76,248, the channel top around $75,680, reinforcing a broader demand band. A break below that cluster could expose the 38.2%Fibonacci retracement at $74,487 and deeper channel and horizontal supports toward $69,000–$63,000.
(The technical analysis of this story was written with the help of an AI tool.)
Bitcoin, altcoins, stablecoins FAQs
Bitcoin is the largest cryptocurrency by market capitalization, a virtual currency designed to serve as money. This form of payment cannot be controlled by any one person, group, or entity, which eliminates the need for third-party participation during financial transactions.
Altcoins are any cryptocurrency apart from Bitcoin, but some also regard Ethereum as a non-altcoin because it is from these two cryptocurrencies that forking happens. If this is true, then Litecoin is the first altcoin, forked from the Bitcoin protocol and, therefore, an “improved” version of it.
Stablecoins are cryptocurrencies designed to have a stable price, with their value backed by a reserve of the asset it represents. To achieve this, the value of any one stablecoin is pegged to a commodity or financial instrument, such as the US Dollar (USD), with its supply regulated by an algorithm or demand. The main goal of stablecoins is to provide an on/off-ramp for investors willing to trade and invest in cryptocurrencies. Stablecoins also allow investors to store value since cryptocurrencies, in general, are subject to volatility.
Bitcoin dominance is the ratio of Bitcoin's market capitalization to the total market capitalization of all cryptocurrencies combined. It provides a clear picture of Bitcoin’s interest among investors. A high BTC dominance typically happens before and during a bull run, in which investors resort to investing in relatively stable and high market capitalization cryptocurrency like Bitcoin. A drop in BTC dominance usually means that investors are moving their capital and/or profits to altcoins in a quest for higher returns, which usually triggers an explosion of altcoin rallies.

يعتمد أكثر من مليون مستخدم على FXStreet للحصول على بيانات سوقية لحظية، وأدوات رسوم بيانية، ورؤى خبراء، وأخبار الفوركس. يساعد تقويمهم الاقتصادي الشامل والندوات التعليمية عبر الويب المتداولين على البقاء على اطلاع واتخاذ قرارات محسوبة. لدى FXStreet فريق يضم حوالي 60 محترفًا موزعين بين مقر برشلونة ومناطق عالمية مختلفة.
اقرأ المزيد


