
Bitcoin Weekly Forecast: BTC nears key support as war concerns grow, quantum fears linger
بواسطة Manish Chhetri
تم التحديث: 3 Apr 2026


المقالات الشائعة

Bitcoin (BTC) is trading at $67,000, approaching its key support level at the time of writing on Friday, after nearly erasing its earlier weekly recovery.
- Bitcoin price nears key support on Friday after nearly erasing its earlier weekly recovery.
- US-listed spot ETFs remain largely muted so far this week amid growing uncertainty over the war.
- A report explains that quantum computing is a long-term structural issue, not an immediate market risk.
Bitcoin (BTC) is trading at $67,000, approaching its key support level at the time of writing on Friday, after nearly erasing its earlier weekly recovery. Growing uncertainty over the US-Iran war and de-escalation plans keep the institutional demand and border risk sentiment muted so far this week. Meanwhile, renewed concerns about quantum computing, highlighted by a recent Google Quantum AI report, have added to market noise, and a weakening technical structure for the Crypto King suggests a deeper correction ahead.
US-Iran war dampens risk appetite
Bitcoin started the week on a positive note and recovered slightly in the first half, reaching a high of $69,310 on Wednesday. This price recovery came in as the US President Donald Trump said on Tuesday that he was willing to end the war with Iran, despite the Strait of Hormuz remaining closed and that Washington didn't intend to extend the military mission beyond his four- to six-week timeline.
Unlike previous easing situations, Iran also responded positively this time, with Iran’s President Masoud Pezeshkian telling European Union (EU) Council President António Costa on Tuesday that his country was ready to end the war with the US. Still, the country needed certain guarantees, especially no repetition of aggression, the Iranian state news agency reported.
These boosted the investors’ confidence and risk appetite, with US Equities and risk-sensitive assets, such as Bitcoin, extending their recovery.
However, the market sentiment turned sour later on Wednesday while addressing the nation, President Trump threatened that the ongoing war would continue until late April, stating that “We are going to hit them extremely hard over the next two to three weeks,” threatened to strike Iranian power plants, and said Iran would be sent back to the “stone age” if no deal is reached.
In addition, Trump also pointed to the destruction of a bridge in Tehran, signaling further escalation while urging Iran to reach a deal before it is too late.
In response, Iran’s Foreign Minister Abbas Araghchi said recent US strikes on civilian infrastructure would not force a retreat, describing them instead as evidence of an opponent in disarray and moral decline.
These developments in the latter half of the week dampened risk appetite and tempered hopes for de-escalation in Iran, bolstering the US Dollar (USD) and Oil prices, while eroding the recovery seen on BTC earlier this week. As of writing, BTC is trading at around $67,000 on Friday.
Institutional investors remain muted
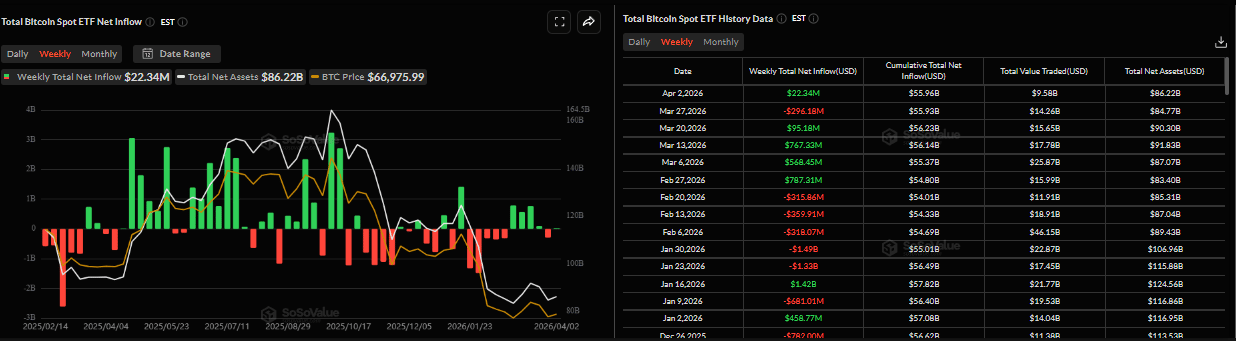
Institutional demand for Bitcoin shows mixed sentiment with a slight bullish bias so far this week. SoSoValue data show that Bitcoin spot Exchange Traded Funds (ETFs) have seen alternating inflows and outflows this week, with 3 inflows and 1 outflow through Thursday, bringing the net total to $22.34 million. This highlights indecisiveness among institutional investors, who are unwilling to increase exposure to BTC amid prevailing market uncertainty.
Google AI quantum warning to crypto and Bitcoin
Google Quantum AI released a white paper this week, warning the cryptocurrency industry about threats that could crack encrypted wallets in less than 10 minutes under advanced quantum scenarios. This research has reignited concerns around quantum computing and cryptographic security, particularly Elliptic Curve Cryptography (ECC) used in Bitcoin and Ethereum.
A QCP Capital report on Wednesday highlighted that Quantum computing poses a long-term, system-wide risk to cryptography. Still, current technology is far from breaking ECC, making it unlikely to have a near-term impact on the crypto market.
The report explained that Google’s paper suggests that fewer quantum resources may be needed than previously thought, estimating ~1,200 to 1,450 logical qubits to break ECDLP-256. This would translate to roughly 500,000 to 1.2 million physical qubits, depending on assumptions.
“To date, the world’s most advanced quantum systems operate at a fraction of that scale, leaving us orders of magnitude, roughly 1,000x, below the threshold required for a practical attack,” reported QCP Capital’s analyst.
The analyst continued, “Because this risk is already recognized, both crypto and traditional finance are actively investing in post-quantum security and upgrade pathways. Protocol communities are exploring mitigation strategies, while global standards continue to evolve.”
“Our view is clear. Quantum computing is a long-term issue the industry should monitor and prepare for, not a near-term reason to reassess digital assets. The current headlines are running ahead of reality,” the report concluded.
Bitcoin’s on-chain perspective shows falling demand
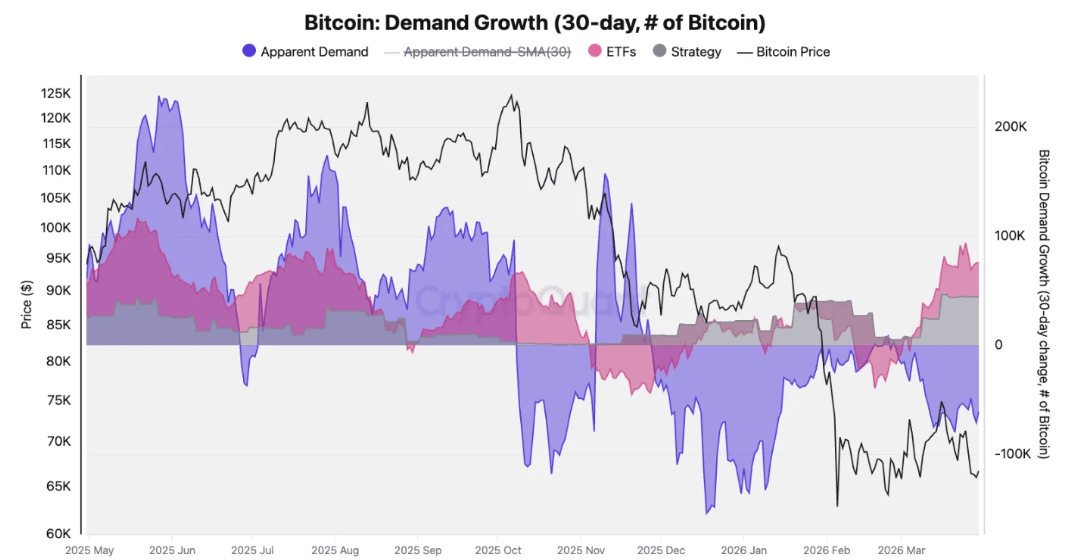
CryptoQuant’s weekly report highlighted that overall Bitcoin spot demand remains in contraction.
The chart below shows that the 30-day apparent demand growth stands at approximately -63,000 BTC (purple) as of late March, reflecting persistent selling pressure from the broader market. While the ETF 30-day purchases (pink) have risen sharply in March, reaching approximately 50,000 BTC, the highest since October 2025, Strategy’s 30-day accumulation has also remained high, with $44,000 BTC (gray).
Despite this institutional acceleration, total apparent demand continues to contract, indicating that selling from retail and other market participants is more than offsetting incremental institutional buying. The sustained demand contraction, now persisting since late November, confirms that the broader market remains in distribution.
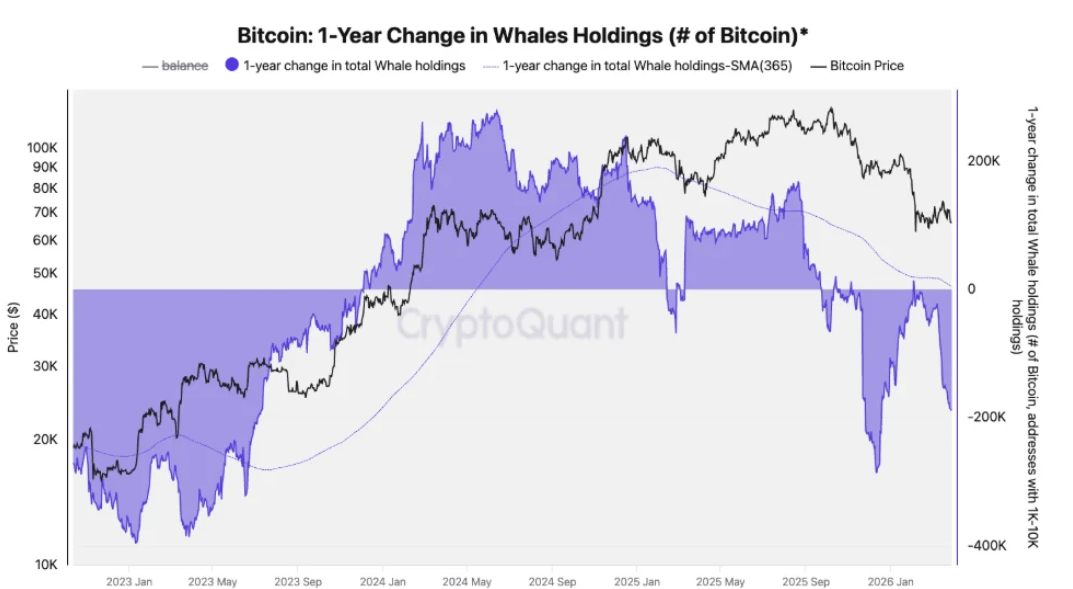
In addition, large investors holding (1,000-10,000 BTC) have turned net distributors, with the 1-year change in whale holdings reaching -188,000 BTC.
“The 365-day SMA remains in a declining trend, confirming that this distribution is structural rather than temporary. Historically, sustained negative whale accumulation has coincided with periods of prolonged price weakness, and the current reading suggests selling remains a significant structural headwind,” reports CryptoQuant analyst.
What’s there for BTC in April?
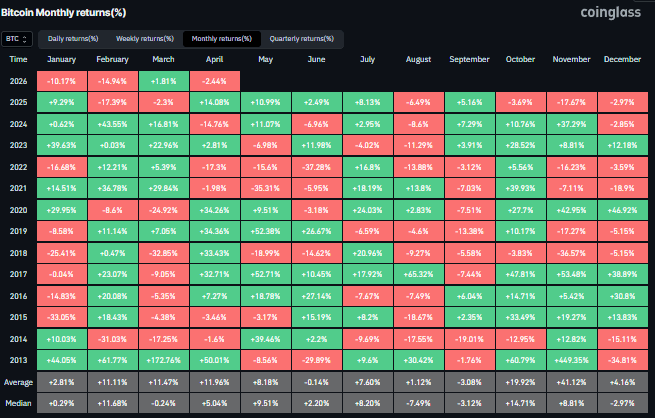
Bitcoin price closed March with a slight positive return of 1.81%, breaking its two consecutive monthly declines at the start of the year and its fifth consecutive month of correction since October 2025.
However, monthly trends suggest some signs of optimism. Historically, Bitcoin has delivered positive returns in April, averaging gains of 11.96%. This recovery thesis would play in if institutional inflows resume, regulatory developments (such as the Clarity Act) turn supportive for the broader crypto market, and the war in the Middle East comes to an end, which could restore investor confidence and risk appetite.
Will BTC drop to $60,000?
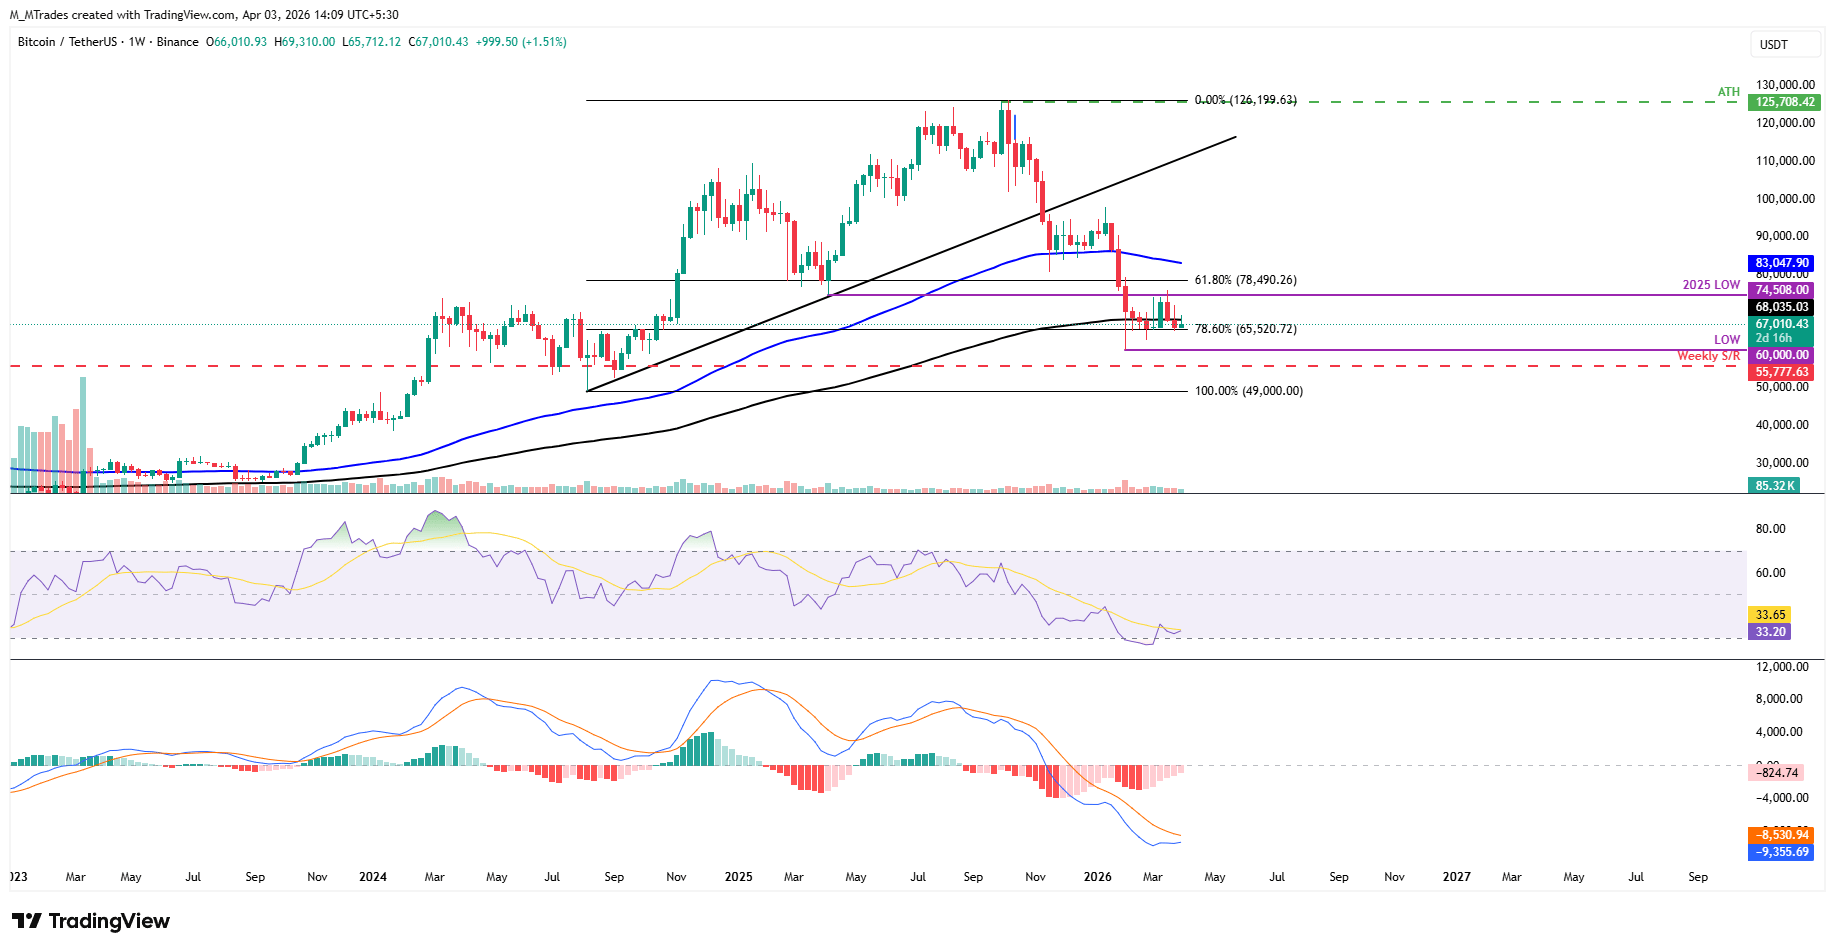
As seen on the weekly chart below, the largest cryptocurrency by market capitalization faced rejection around the 2025 yearly low of $74,508 in mid-March. It declined slightly, closing below the 200-week Exponential Moving Average (EMA) at $68,031. As of this week, BTC has been rejected by the 200-week EMA and trades at $67,000 on Friday.
If Bitcoin corrects, closing below the 78.60% Fibonacci retracement level at $65,520 (drawn from the August 2024 low of $49,000 to the October 2025 all-time high of $126,199) on a weekly basis, it could extend the correction toward the key psychological level at $60,000.
The Relative Strength Index (RSI) reads 33 on the weekly chart, below the neutral level of 50 and near oversold territory, indicating persistent but not yet exhausted bearish momentum. The Moving Average Convergence Divergence (MACD) indicator on the same chart also showed a bearish crossover in mid-August, which remains intact, supporting the negative outlook. Still, contracting red histogram bars, as the MACD line approaches its signal line, suggest easing bearish pressure.
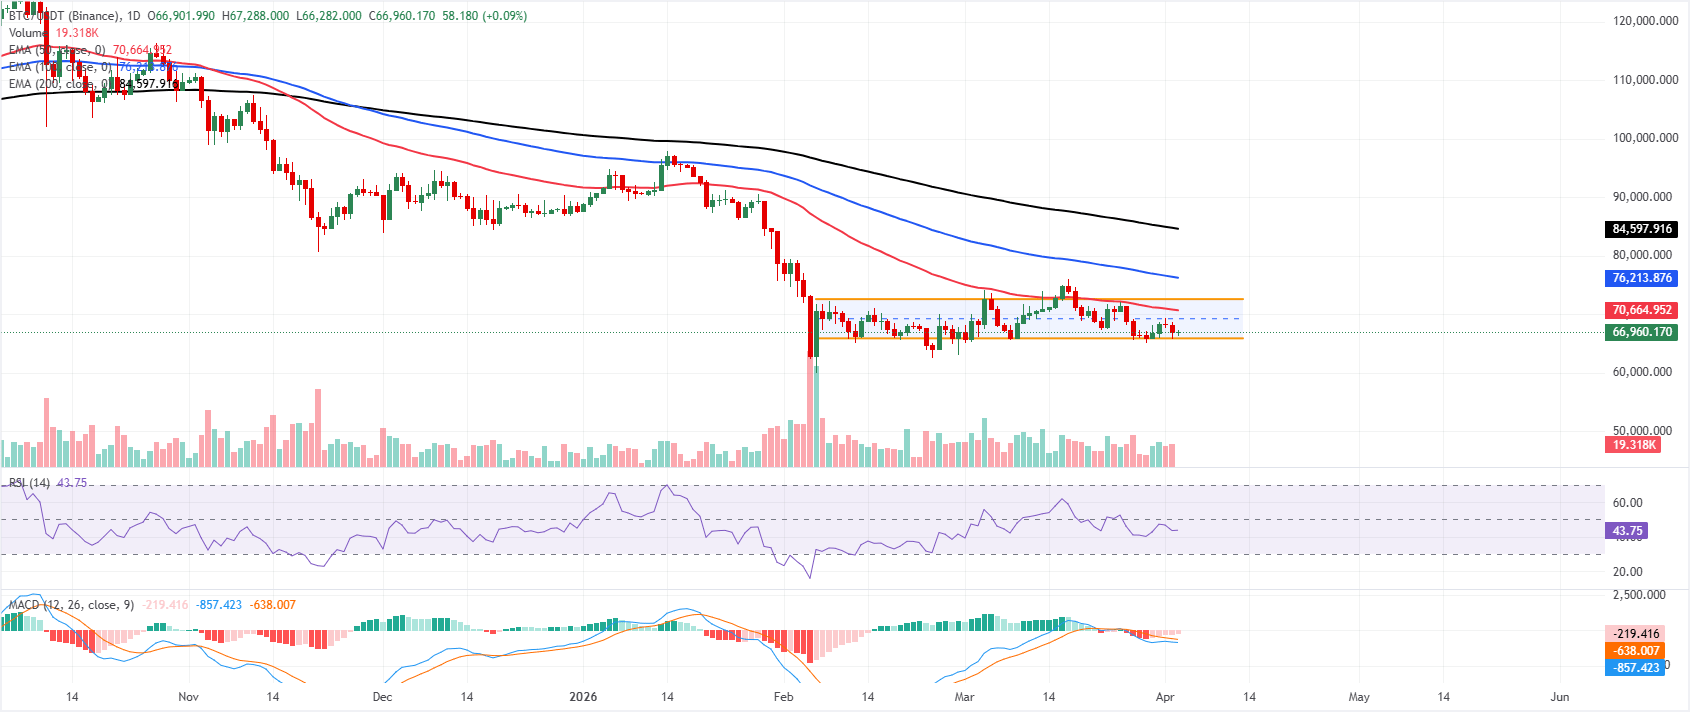
On the daily chart, near-term bias is mildly bearish as price holds within a parallel channel and gravitates toward its lower boundary near $65,900, indicating sellers retain control of the recent sequence of lower highs. In addition, BTC trades below the clustered 50-day, 100-day, and 200-day EMAs, reinforcing a downside-skewed backdrop despite the recent bounce attempts.
The RSI on the daily chart at 43 stays below the 50 midline, signaling persistent, though not extreme, bearish momentum, while the MACD line runs under its signal line, suggesting downside pressure remains in play.
Immediate support is near the channel floor at $65,900, with a breakdown exposing the key psychological level at $60,000.
On the upside, initial resistance emerges near the channel midpoint, around $69,200, just ahead of the channel top at $72,600. A daily close above $72,600 would signal a bullish break from the sideways structure and open the door toward the 100-day EMA near $76,200, while sustained trade below $65,900 would extend the current corrective leg within the broader cycle.
(The technical analysis of this story was written with the help of an AI tool.)
Cryptocurrency prices FAQs
Token launches influence demand and adoption among market participants. Listings on crypto exchanges deepen the liquidity for an asset and add new participants to an asset’s network. This is typically bullish for a digital asset.
A hack is an event in which an attacker captures a large volume of the asset from a DeFi bridge or hot wallet of an exchange or any other crypto platform via exploits, bugs or other methods. The exploiter then transfers these tokens out of the exchange platforms to ultimately sell or swap the assets for other cryptocurrencies or stablecoins. Such events often involve an en masse panic triggering a sell-off in the affected assets.
Macroeconomic events like the US Federal Reserve’s decision on interest rates influence crypto assets mainly through the direct impact they have on the US Dollar. An increase in interest rate typically negatively influences Bitcoin and altcoin prices, and vice versa. If the US Dollar index declines, risk assets and associated leverage for trading gets cheaper, in turn driving crypto prices higher.
Halvings are typically considered bullish events as they slash the block reward in half for miners, constricting the supply of the asset. At consistent demand if the supply reduces, the asset’s price climbs.

يعتمد أكثر من مليون مستخدم على FXStreet للحصول على بيانات سوقية لحظية، وأدوات رسوم بيانية، ورؤى خبراء، وأخبار الفوركس. يساعد تقويمهم الاقتصادي الشامل والندوات التعليمية عبر الويب المتداولين على البقاء على اطلاع واتخاذ قرارات محسوبة. لدى FXStreet فريق يضم حوالي 60 محترفًا موزعين بين مقر برشلونة ومناطق عالمية مختلفة.
اقرأ المزيد


