
Bittensor Price Forecast: TAO extends gains as AI crypto sector recovers
بواسطة John Isige
تم التحديث: 12 Mar 2026


المقالات الشائعة

Bittensor (TAO) is trading above $210 at the time of writing on Thursday, reflecting the steadiness of the broader cryptocurrency market amid the United States (US)-Iran war.
- Bittensor gains momentum above $210, with the 50-day EMA providing immediate support.
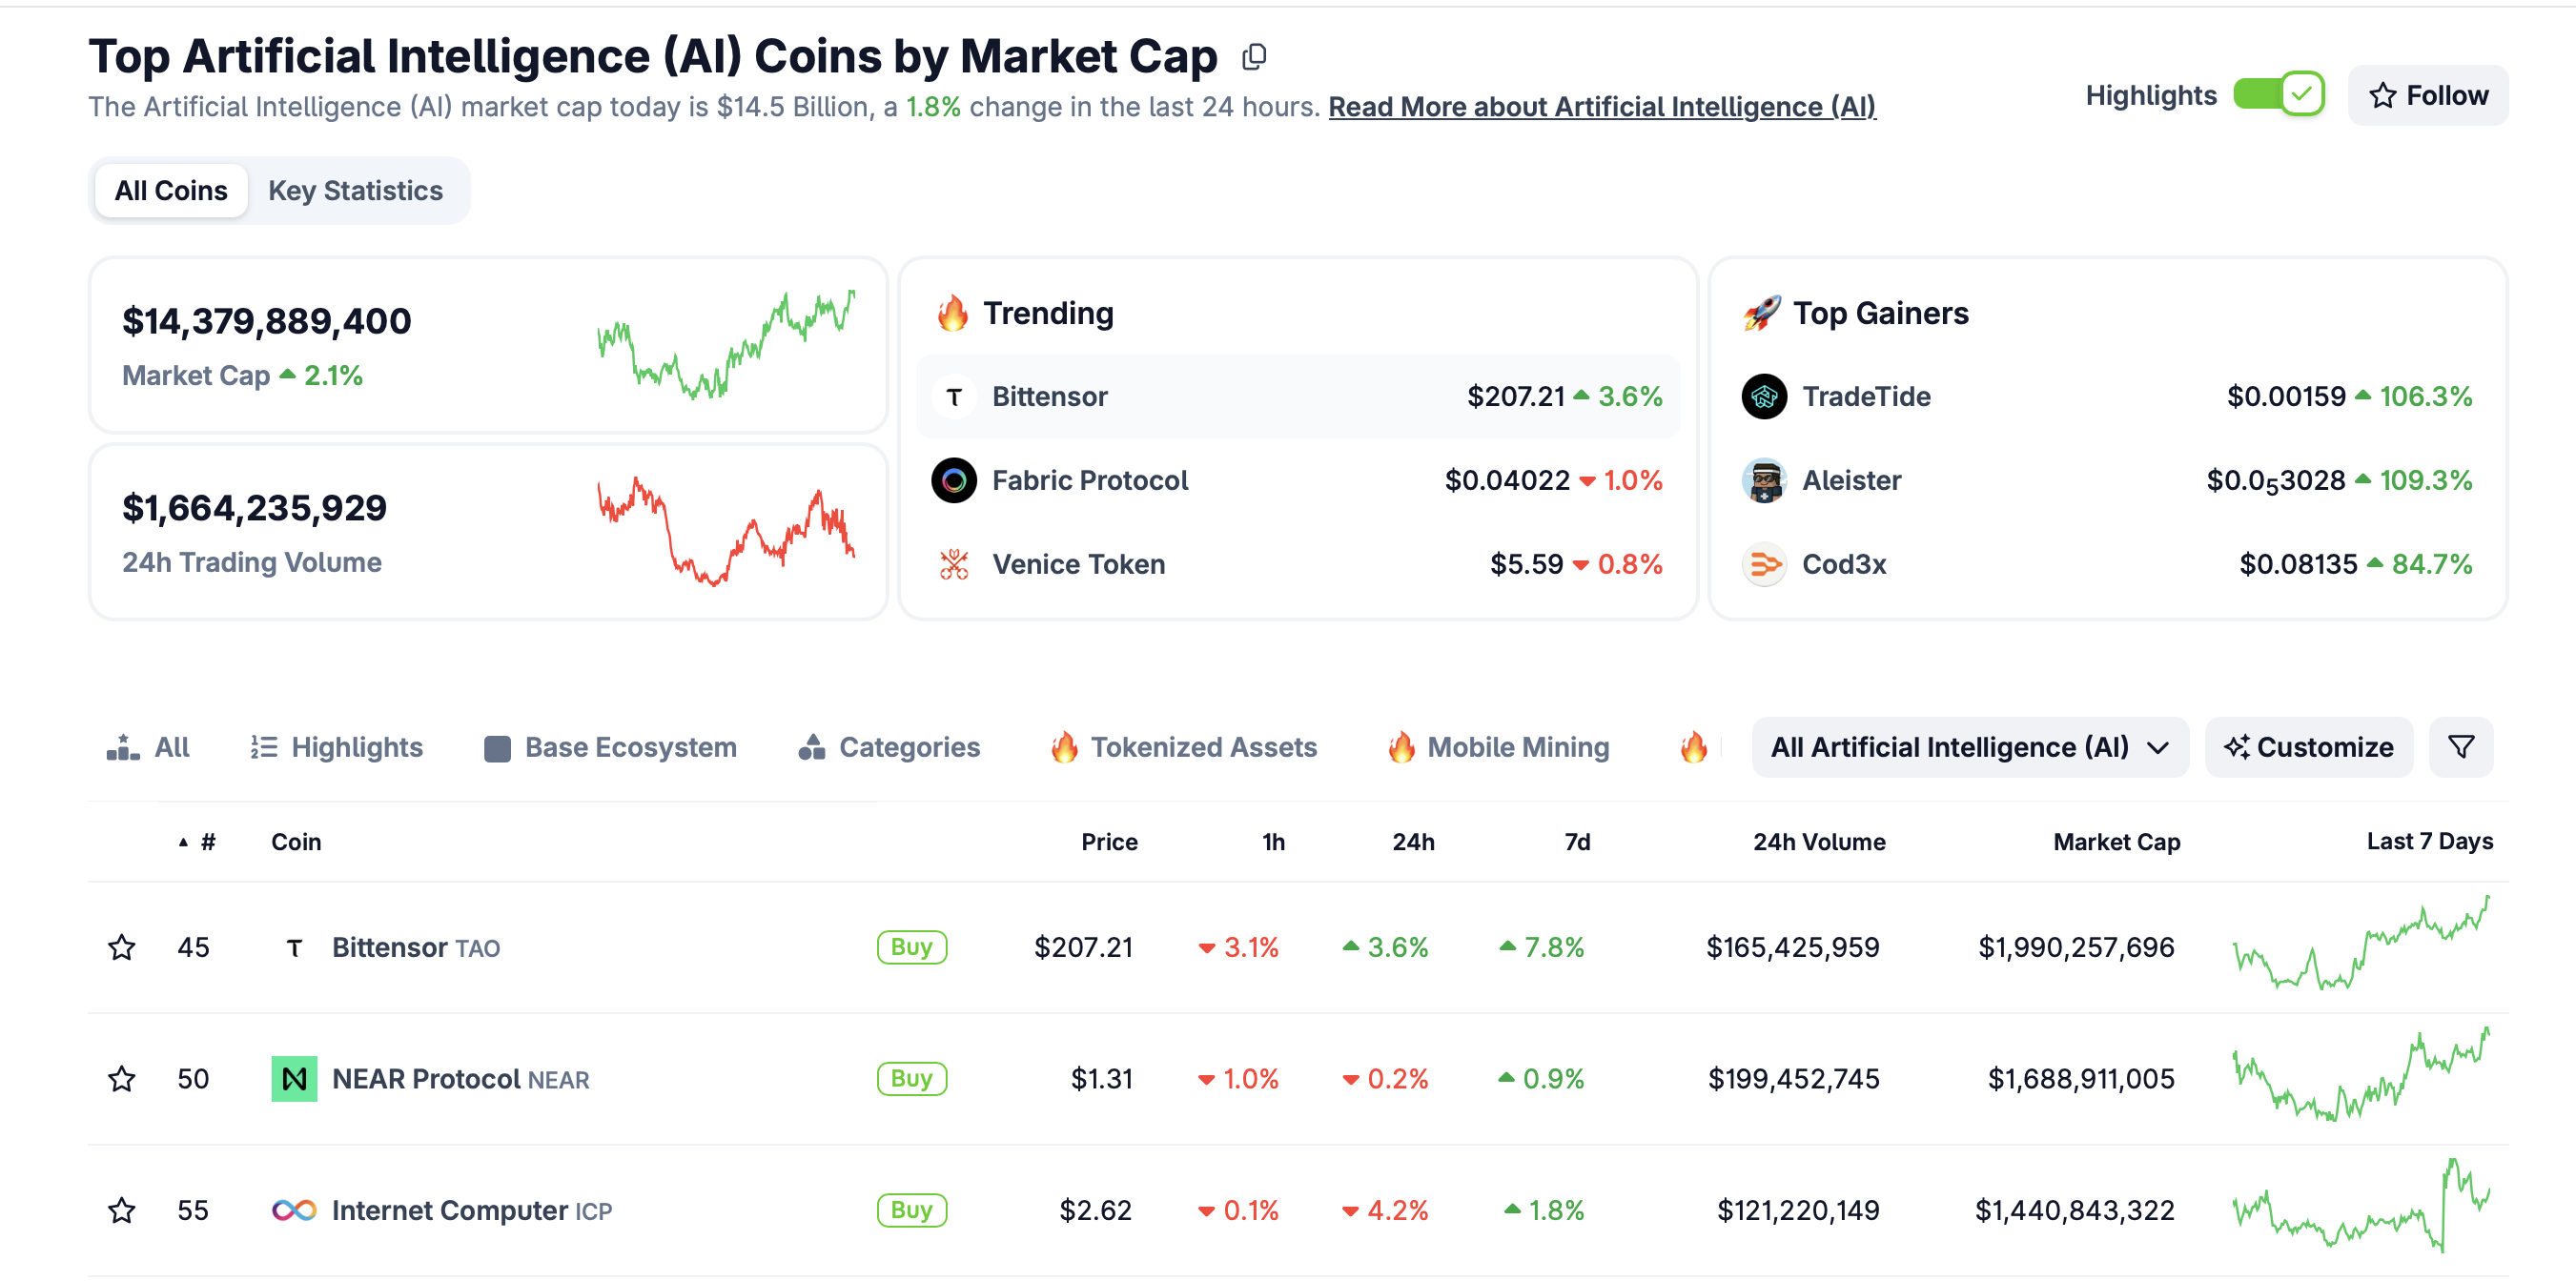
- The AI crypto segment’s market capitalization holds above $14 billion, signaling steady investor interest.
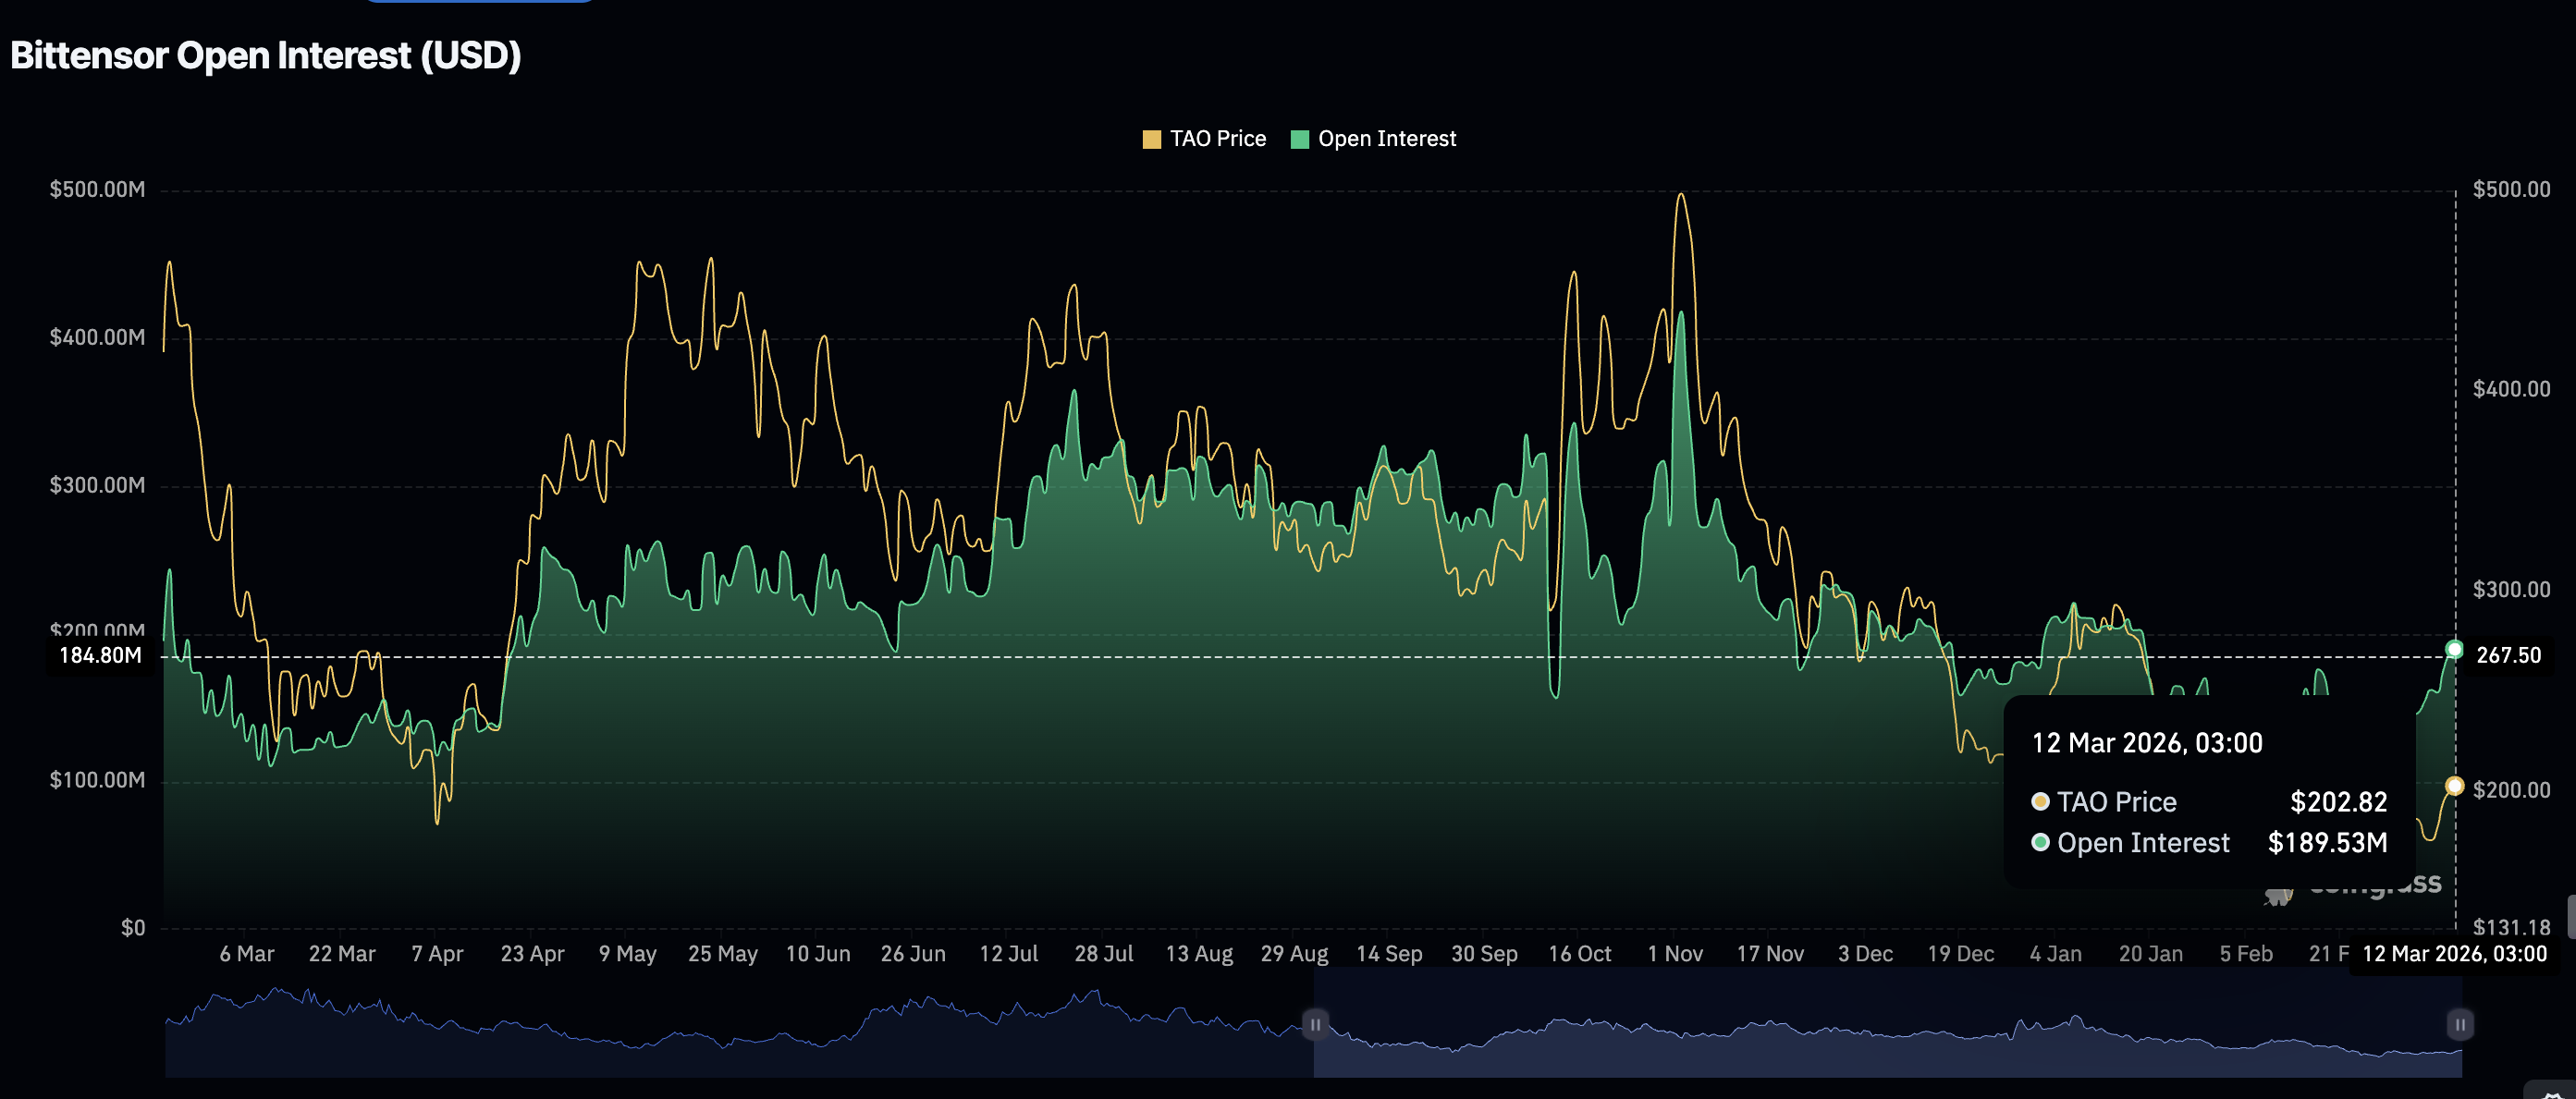
- Retail demand returns, with futures Open Interest rising to $190 million on Thursday.
Bittensor (TAO) is trading above $210 at the time of writing on Thursday, reflecting the steadiness of the broader cryptocurrency market amid the United States (US)-Iran war.
The majority of tokens in the Artificial Intelligence (AI) crypto segment are also holding steady, while some, such as UnifAI Network (UAI) and Templar (SN3), have recorded double-digit gains over the past 24 hours.
The total sector’s market capitalisation has increased slightly to $14.4 billion in the same period, with the largest token, TAO, accounting for nearly $2 billion.
Retail demand returns as Bittensor gains momentum
Retail interest in Bittensor has steadied this week, with futures Open Interest (OI) expanding to $190 billion on Thursday, from $186 million the previous day. Looking back, the OI averaged $160 million on Monday, underscoring the importance of retail demand in sustaining momentum.
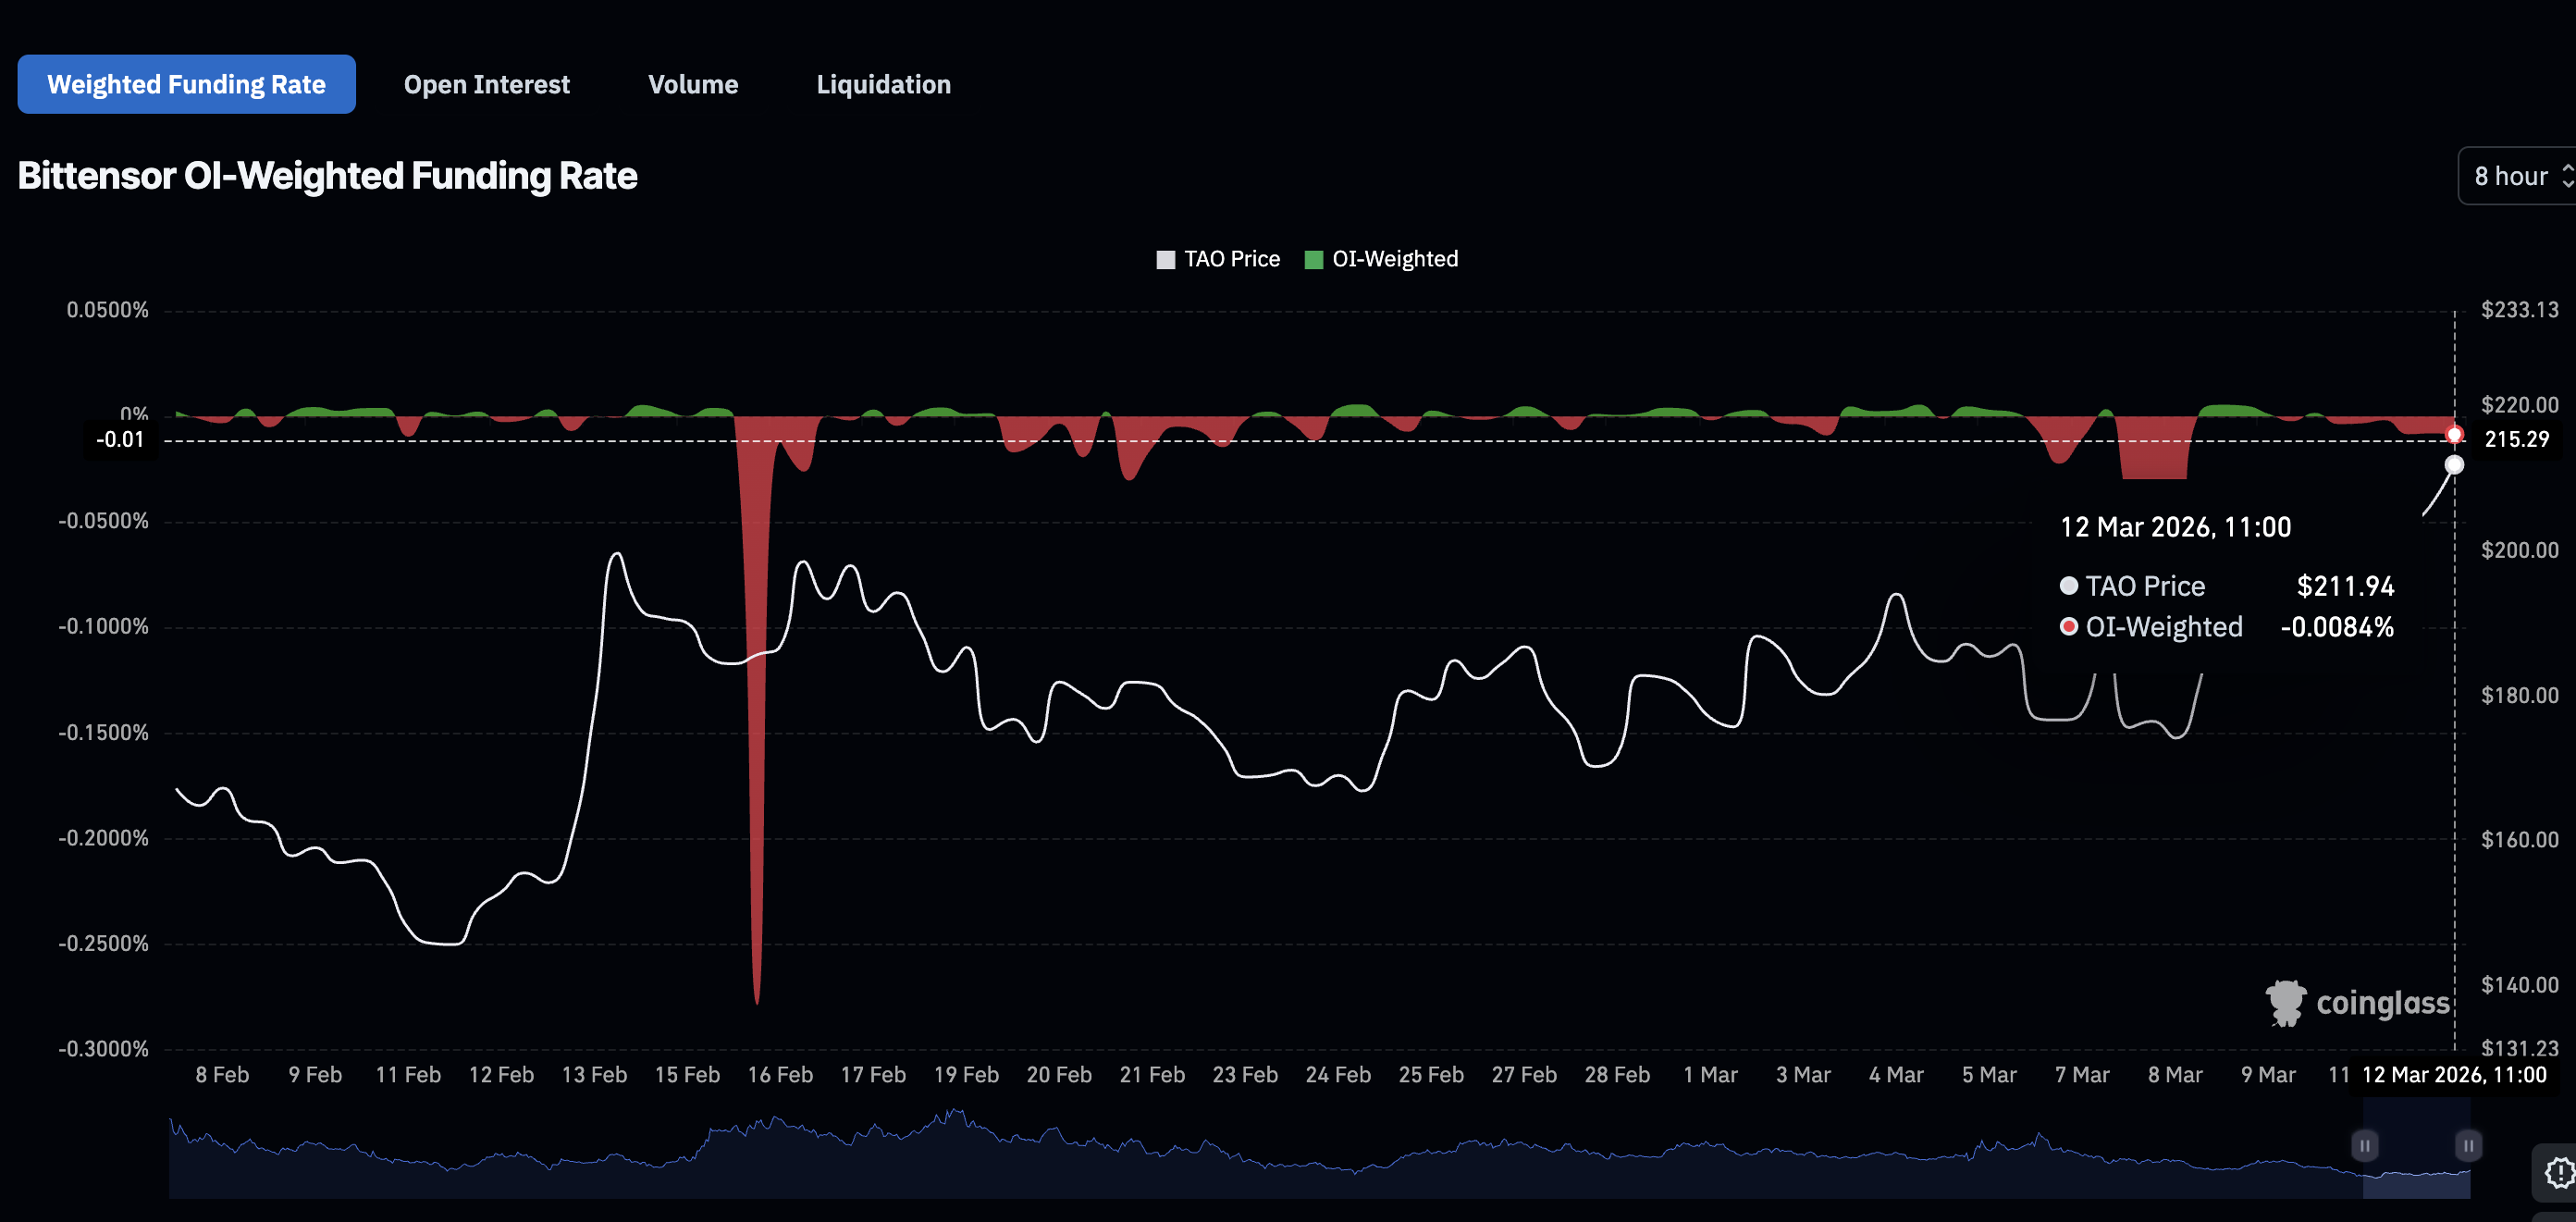
Despite the price surging from the weekly open of $181, traders are increasingly piling into short positions, as reflected by the OI-Weighted Funding Rate, which averages -0.0084%. CoinGlass data shows that this metric has remained negative since Tuesday. Sustaining the uptrend could be an uphill battle if sentiment continues to lag price increases.
Technical outlook: Bittensor tests breakout strength
Bittensor is trading at $212 amid a steady bullish shift, as the price extends from recent lows and advances above key levels, including the long-running descending resistance trendline.
Daily closes remain above the 50-day Exponential Moving Average (EMA), which currently holds at $198, reinforcing the bullish grip. The Moving Average Convergence Divergence (MACD) indicator is trending higher above the zero line, with widening green histogram bars on the daily chart, suggesting stronger upside momentum.
At the same time, the Relative Strength Index (RSI) at 64 on the same chart stays below overbought territory but holds firmly above the 50 line, reinforcing building bullish pressure rather than exhaustion.
-1773332655230-1773332655234.png)
Immediate support is seen at $203, where the latest minor consolidation floor formed ahead of the current push higher, followed by $194 and then $187 if a deeper pullback unfolds. A break below the $187 area would expose the $177 demand zone, which aligns wth the prior reaction low.
On the upside, initial resistance lies at the recent high near $215, with a sustained break opening the path toward the 100-day EMA at $226. Above this hurdle, the next resistance aligns with the 200-day EMA at $268.
Open Interest, funding rate FAQs
Higher Open Interest is associated with higher liquidity and new capital inflow to the market. This is considered the equivalent of increase in efficiency and the ongoing trend continues. When Open Interest decreases, it is considered a sign of liquidation in the market, investors are leaving and the overall demand for an asset is on a decline, fueling a bearish sentiment among investors.
Funding fees bridge the difference between spot prices and prices of futures contracts of an asset by increasing liquidation risks faced by traders. A consistently high and positive funding rate implies there is a bullish sentiment among market participants and there is an expectation of a price hike. A consistently negative funding rate for an asset implies a bearish sentiment, indicating that traders expect the cryptocurrency’s price to fall and a bearish trend reversal is likely to occur.
(The technical analysis of this story was written with the help of an AI tool.)

يعتمد أكثر من مليون مستخدم على FXStreet للحصول على بيانات سوقية لحظية، وأدوات رسوم بيانية، ورؤى خبراء، وأخبار الفوركس. يساعد تقويمهم الاقتصادي الشامل والندوات التعليمية عبر الويب المتداولين على البقاء على اطلاع واتخاذ قرارات محسوبة. لدى FXStreet فريق يضم حوالي 60 محترفًا موزعين بين مقر برشلونة ومناطق عالمية مختلفة.
اقرأ المزيد


