
BNB Price Forecast: Death Cross pattern and market panic weigh on outlook
بواسطة Vishal Dixit
تاريخ النشر: 2 Feb 2026 | تاريخ التعديل: 2 Feb 2026


المقالات الشائعة

BNB (formerly Binance Coin) remains under extreme selling pressure, falling below $750 on Monday as the broader cryptocurrency market continues to suffer, with Bitcoin (BTC) below $75,000.
- BNB slips below $750 on Monday, extending the 18% loss over the last two weeks.
- A market-wide panic turns BNB traders risk-averse, boosting bearish positional buildup.
- The technical outlook identifies a Fibonacci retracement near $735 as the critical support level to prevent a drop below $700.
BNB (formerly Binance Coin) remains under extreme selling pressure, falling below $750 on Monday as the broader cryptocurrency market continues to suffer, with Bitcoin (BTC) below $75,000. The risk-averse conditions among traders lead to massive liquidations and a bearish shift in derivatives buildup. The technical outlook for BNB highlights a Fibonacci retracement level near $735 as critical support to prevent further losses.
Fear grips the BNB derivatives market
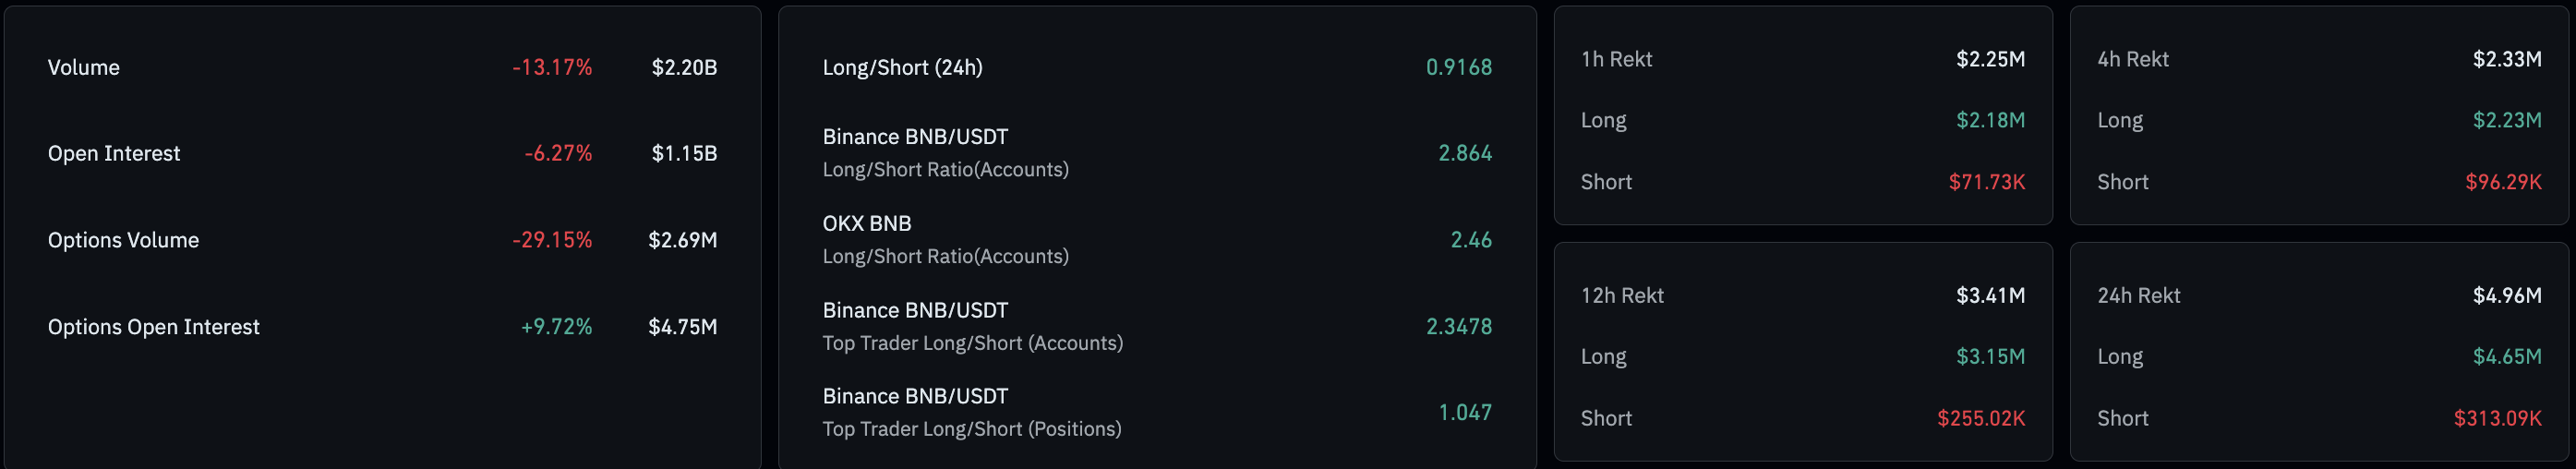
CoinGlass data show that BNB futures Open Interest (OI) declined by over 6% in the last 24 hours, reaching $1.15 billion, indicating a steady decline in the value of outstanding contracts and consistent with risk-off sentiment in the market. Additionally, long liquidations totaling $4.65 million over the last 24 hours, compared with $313,090, suggest a larger wipeout of bullish positions.
Technical outlook: Will BNB price fall to $620?
BNB is down over 1% on Monday after a four-day decline of over 16%. The exchange token is significantly below the downward-sloping 50-day Exponential Moving Average (EMA) at $881 and the 200-day EMA at $880. The moving averages risk a Death Cross pattern as the shorter EMA inches toward crossing below the longer one. Typically, a Death Cross between the 50- and 200-day serves as a strong sell signal.
The Moving Average Convergence Divergence (MACD) moves below the signal line as the histogram widens into negative territory, suggesting accelerating bearish momentum. Meanwhile, the RSI (Relative Strength Index) at 23 enters the oversold region, indicating heightened selling pressure.
The sell-off in BNB takes short-term support at the 61.8% retracement at $735, measured between the February 2025 low at $500 and the October 2025 high at $1,375. If the exchange token slips to a daily close below $735, the 78.6% Fibonacci retracement level at $620 could serve as the next support level.
On the upside, a reversal from above the 50% retracement level at $829 is necessary to overturn the short-term decline.
(The technical analysis of this story was written with the help of an AI tool.)

يعتمد أكثر من مليون مستخدم على FXStreet للحصول على بيانات سوقية لحظية، وأدوات رسوم بيانية، ورؤى خبراء، وأخبار الفوركس. يساعد تقويمهم الاقتصادي الشامل والندوات التعليمية عبر الويب المتداولين على البقاء على اطلاع واتخاذ قرارات محسوبة. لدى FXStreet فريق يضم حوالي 60 محترفًا موزعين بين مقر برشلونة ومناطق عالمية مختلفة.
اقرأ المزيد


