
BNB price Forecast: Prolonged correction signals deeper bearish momentum
بواسطة Manish Chhetri
تاريخ النشر: 11 Feb 2026 | تاريخ التعديل: 11 Feb 2026


المقالات الشائعة

BNB (BNB), formerly known as Binance Coin, is trading below $618 on Wednesday, marking the sixth consecutive day of correction since the weekend. The bearish price action is further supported by rising short bets alongside negative funding rates in the derivatives market.
- BNB price extends correction on Wednesday, posting six consecutive red candlesticks.
- Derivatives metrics back the bearish sentiment as BNB’s funding rates turn negative alongside rising short bets.
- The technical outlook suggests a deeper correction as bears remain in control of momentum.
BNB (BNB), formerly known as Binance Coin, is trading below $618 on Wednesday, marking the sixth consecutive day of correction since the weekend. The bearish price action is further supported by rising short bets alongside negative funding rates in the derivatives market. Meanwhile, technical analysis suggests a deeper correction for BNB, as bears retain momentum.
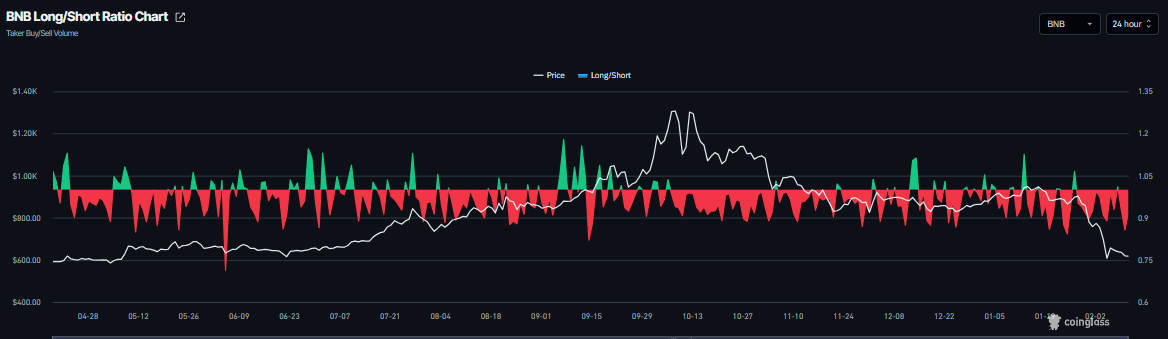
BNB’s derivatives market looks bearish
BNB’s derivatives data shows a bearish outlook. CoinGlass long-to-short ratio for BNB reads 0.91 on Wednesday. This ratio, which is below 1, indicates weakening market sentiment, as more traders are betting on BNB’s price to fall.
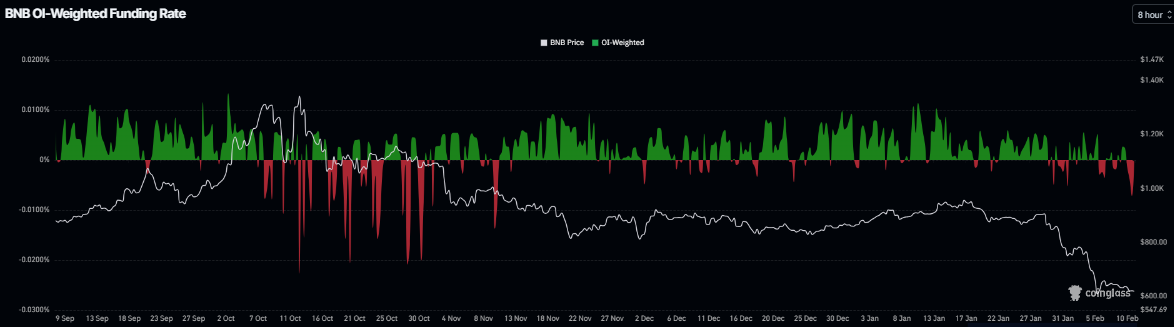
CoinGlass’s OI-Weighted Funding Rate data shows that the number of traders betting that the price of BNB will slide further is higher than those anticipating a price increase.
The metric flipped to a negative rate on Tuesday and currently stands at -0.0002% on Wednesday, indicating shorts are paying longs and suggesting bearish sentiment toward BNB.
BNB Price Forecast: BNB bears aiming for lower lows
BNB price corrected sharply last week, reaching a low of $570.06 on Friday before recovering slightly, then resumed its decline, closing the week with a 15.64% loss. BNB extends its pullback, sliding nearly 4% through Wednesday.
If BNB continues its downward trend, it could extend the decline toward Friday’s low of $570.06. A close below this level could extend losses toward the next key psychological level at $550.
The Relative Strength Index (RSI) on the daily chart reads 24, below the oversold conditions, indicating strong bearish momentum. In addition, the Moving Average Convergence Divergence (MACD) showed a bearish crossover on January 20, which remains intact, further supporting the negative outlook.
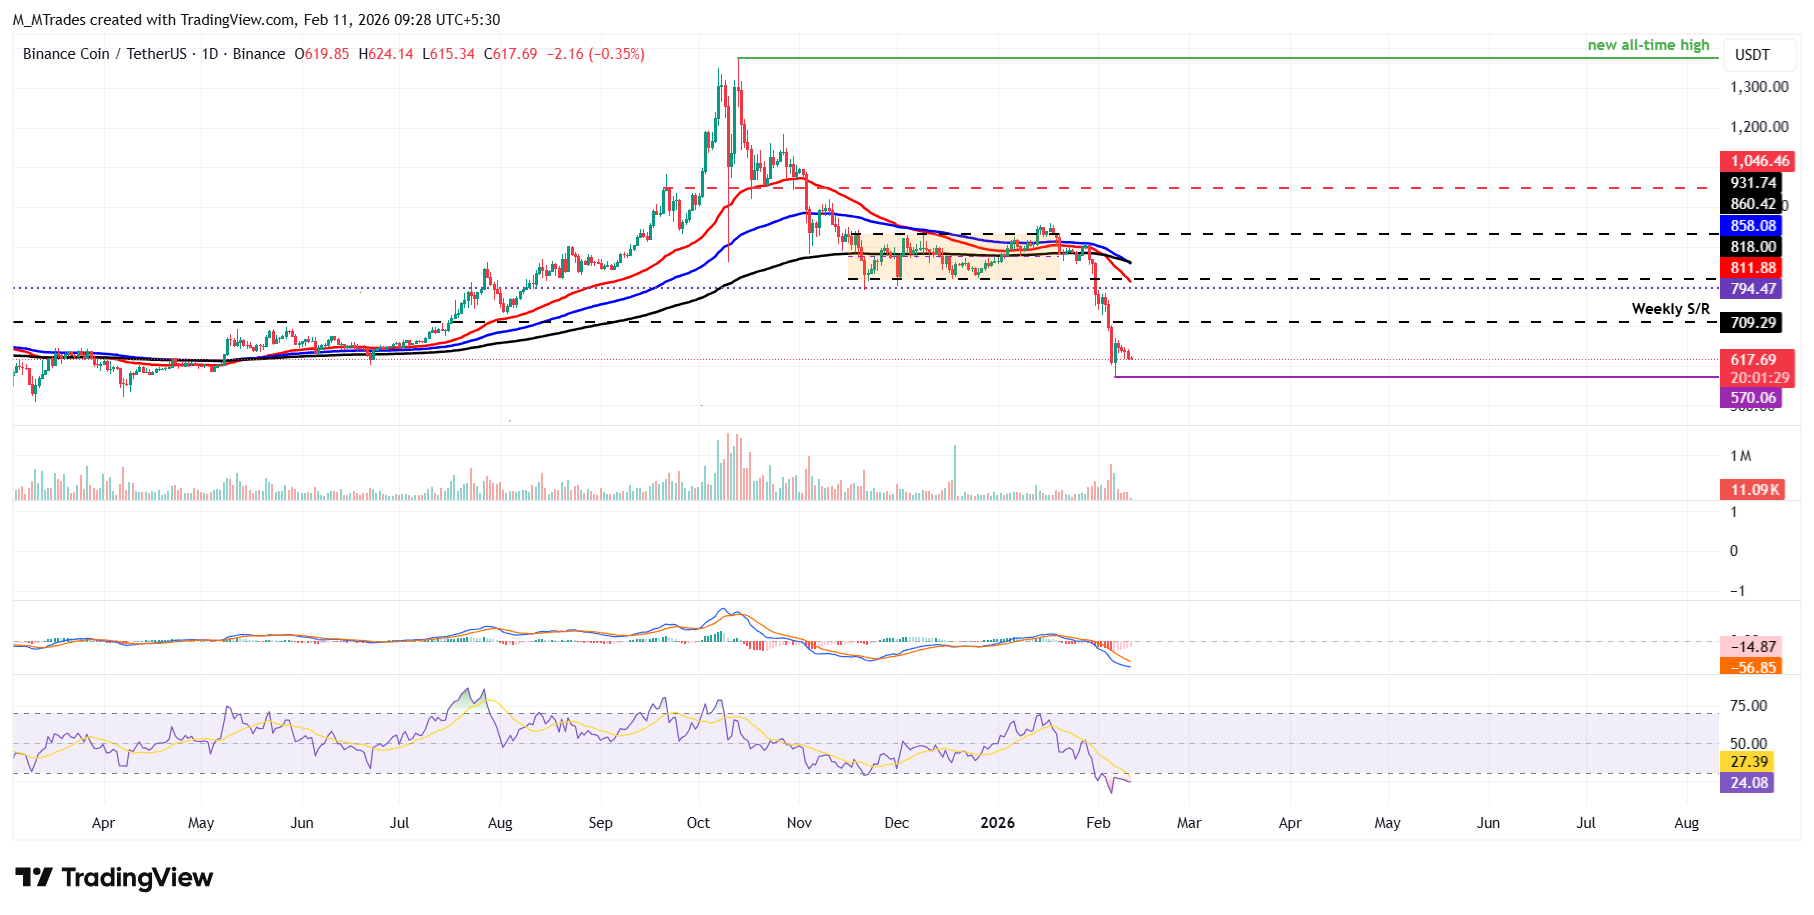
If BNB recovers, it could extend the advance toward the weekly resistance level at $709.29.

يعتمد أكثر من مليون مستخدم على FXStreet للحصول على بيانات سوقية لحظية، وأدوات رسوم بيانية، ورؤى خبراء، وأخبار الفوركس. يساعد تقويمهم الاقتصادي الشامل والندوات التعليمية عبر الويب المتداولين على البقاء على اطلاع واتخاذ قرارات محسوبة. لدى FXStreet فريق يضم حوالي 60 محترفًا موزعين بين مقر برشلونة ومناطق عالمية مختلفة.
اقرأ المزيد


