
Cardano Price Forecast: ADA downside risks intensify, opening the door to $0.27
بواسطة Manish Chhetri
تاريخ النشر: 26 Jan 2026 | تاريخ التعديل: 26 Jan 2026


المقالات الشائعة

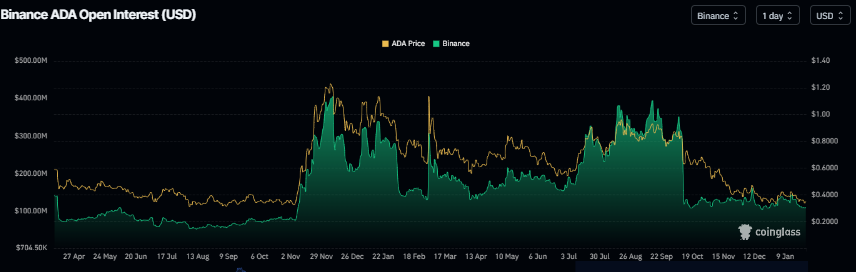
Cardano (ADA) price hovers around $0.34 at the time of writing on Monday, after three consecutive weeks of correction since early January. The falling Open Interest (OI) further supports the ongoing correction signaling waning investor participation.
- Cardano price hovers around $0.34 on Monday, following three consecutive weeks of correction since early January.
- Derivatives data backs the bearish outlook, with declining open interest signaling reduced trader participation.
- The technical outlook suggests sellers are in control of the momentum, increasing the risk of a deeper pullback toward $0.27.
Cardano (ADA) price hovers around $0.34 at the time of writing on Monday, after three consecutive weeks of correction since early January. The falling Open Interest (OI) further supports the ongoing correction signaling waning investor participation. On the technical side, bears are in control of the momentum, suggesting the potential for a deeper correction targeting the $0.27 mark.
Waning investor participation in Cardano
Cardano's futures Open Interest (OI) at Binance exchange dropped to $108.55 million on Sunday, the lowest level since December 25, according to Coinglass data. This drop in OI reflects waning investor participation and projects a bearish outlook.
Cardano Price Forecast: ADA could retest October lows
Cardano's price faced rejection from the 50-day Exponential Moving Average (EMA) at $0.39 on January 14 and declined nearly 10% over the next four days, closing below the daily support at $0.38. ADA continued its correction, falling by more than 9% last week. At the time of writing on Monday, ADA hovers around $0.34.
If ADA continues its correction, it could extend the decline toward the December 31 low of $0.32. A close below this level could extend losses toward the October 10 low of $0.27.
The Relative Strength Index (RSI) on the daily chart reads 39, below its neutral level of 50, indicating bearish momentum gaining traction. In addition, the Moving Average Convergence Divergence (MACD) showed a bearish crossover on January 18, which remains intact with rising red histogram bars below the neutral level, further supporting the negative outlook.
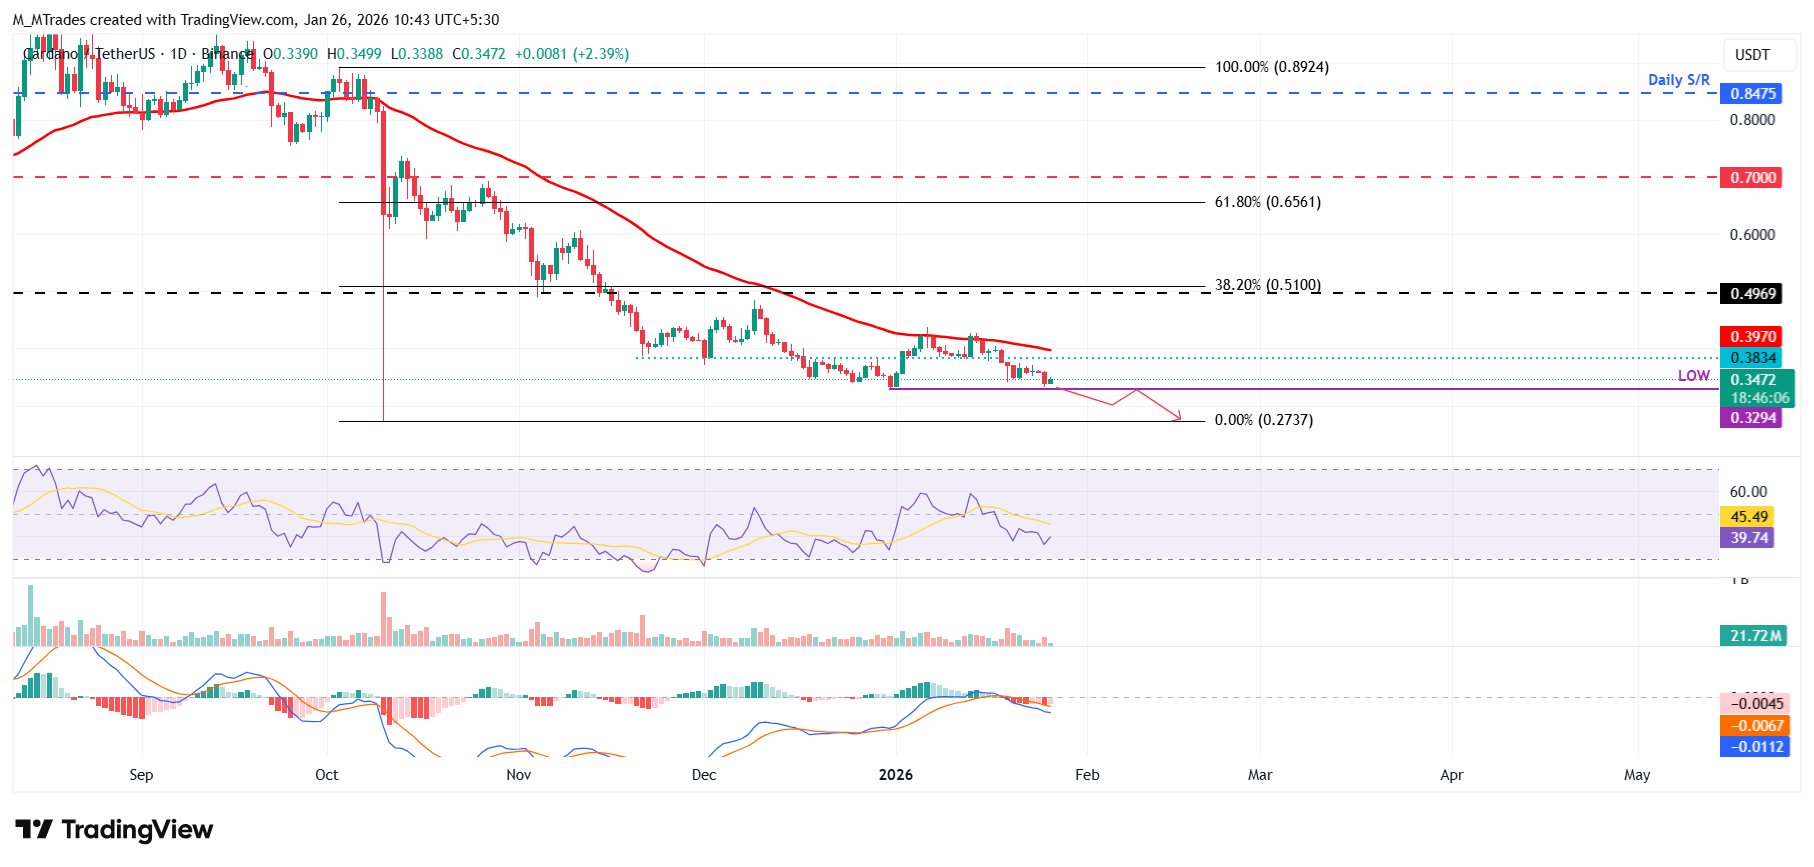
On the other hand, if ADA recovers, it could extend the recovery toward the daily support level at $0.38.

يعتمد أكثر من مليون مستخدم على FXStreet للحصول على بيانات سوقية لحظية، وأدوات رسوم بيانية، ورؤى خبراء، وأخبار الفوركس. يساعد تقويمهم الاقتصادي الشامل والندوات التعليمية عبر الويب المتداولين على البقاء على اطلاع واتخاذ قرارات محسوبة. لدى FXStreet فريق يضم حوالي 60 محترفًا موزعين بين مقر برشلونة ومناطق عالمية مختلفة.
اقرأ المزيد


