

Cardano Price Forecast: ADA extends gradual decline as breakdown risks grow
- Cardano steadies on Wednesday, maintaining a bearish near-term bias as it holds below key EMAs.
- Derivatives data backs the bearish outlook with decreasing open interest and rising short positions.
- On the technical side, momentum indicators show that bearish strength is gaining traction.
Cardano (ADA) steadies near $0.240 on Wednesday, continuing its three-consecutive weeks of losses and maintaining a bearish bias so far this week. Bearish derivatives metrics and weakening momentum hint at deeper losses for ADA.
Derivatives sentiment turns bearish

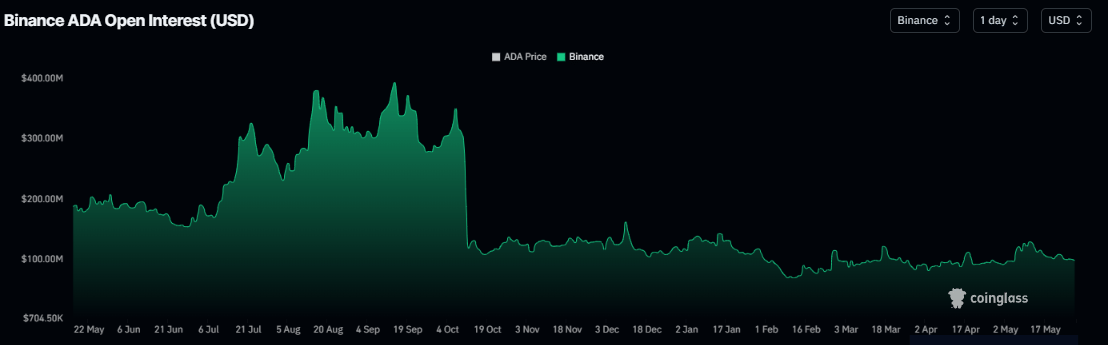
CoinGlass data shows that the futures’ Open Interest (OI) on the Binance exchange for Cardano slips to $98.01 million on Wednesday, down from the May 11 peak of $128.97 million. A declining OI indicates money flowing out of the market and a reduction in new buying interest, which could weaken momentum and increase the risk of further downside in Cardano price.
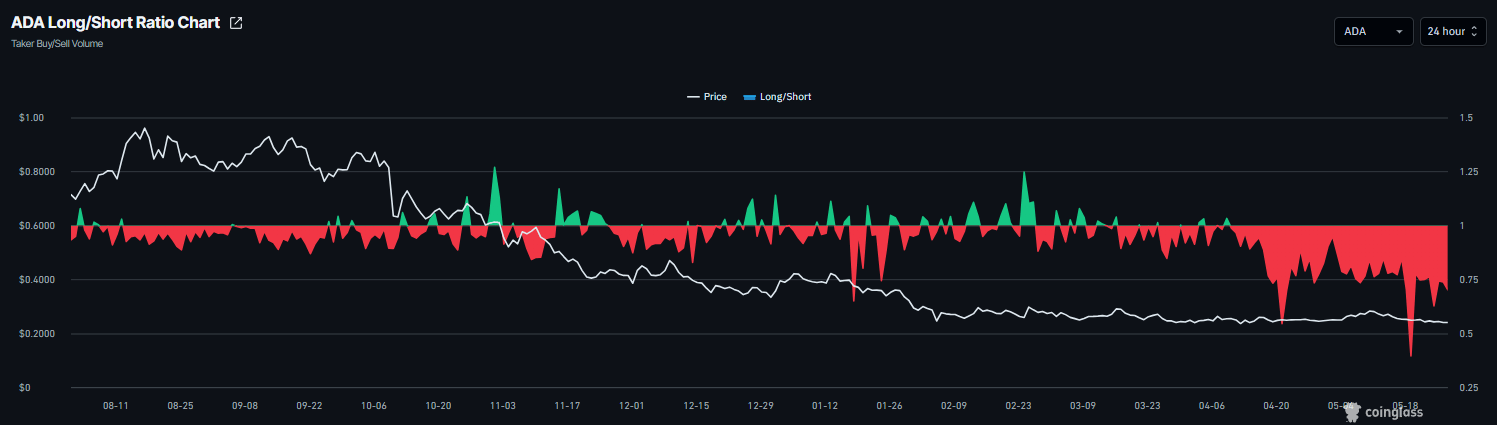
In addition, Coinglass’s long-to-short ratio for ADA reads 0.70 on Wednesday, nearing the lowest level over a month. The ratio being below one, indicates bearish sentiment, as traders are betting the asset’s price will fall.
Cardano Price Forecast: ADA on verge of a breakdown
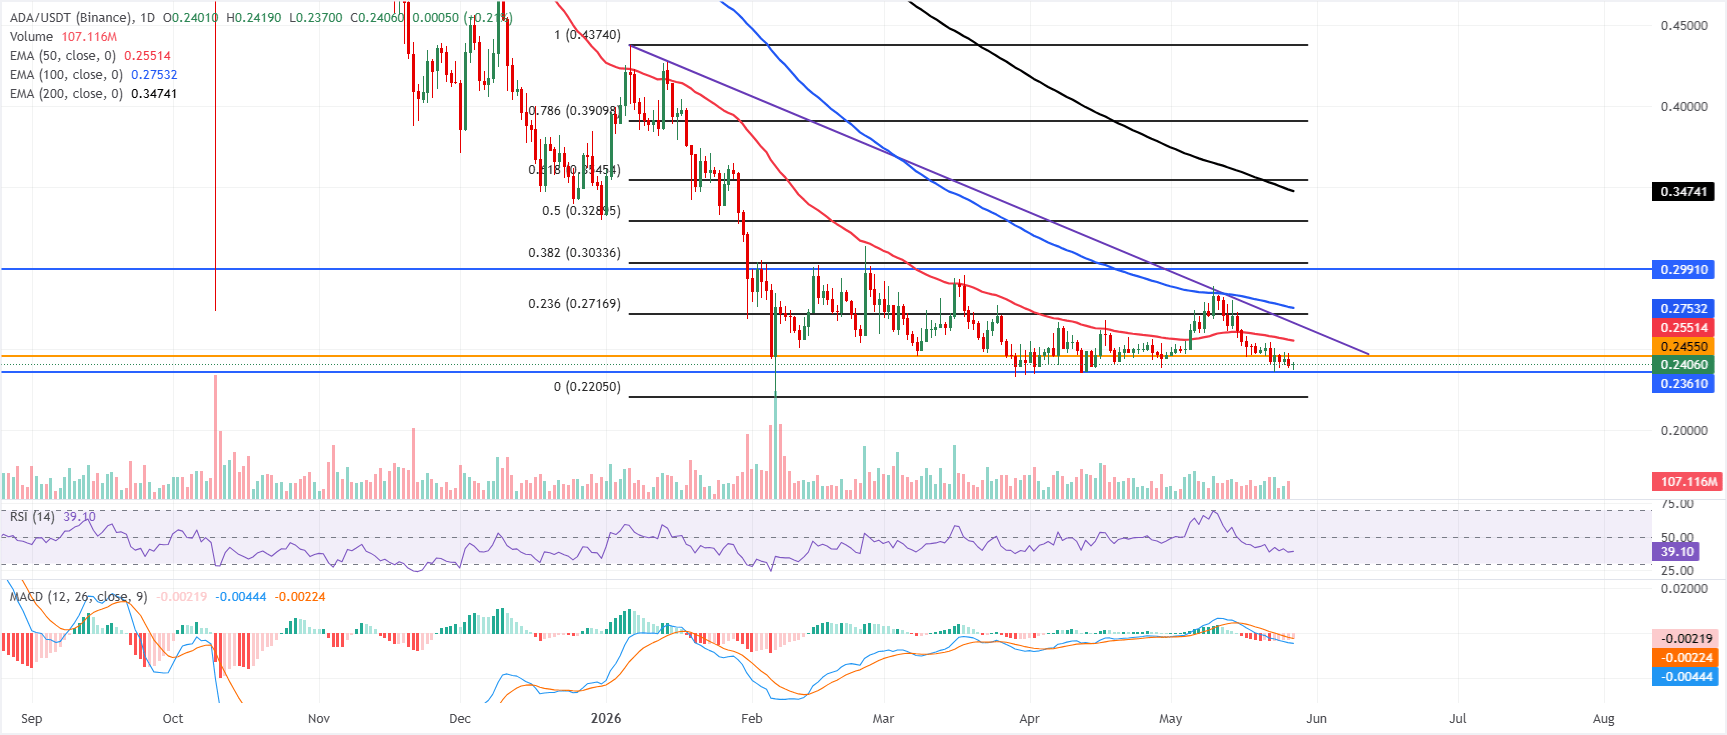
Cardano price trades at $0.240 on Wednesday, holding in a bearish configuration as it remains capped beneath the 50-day, 100-day and 200-day Exponential Moving Averages (EMAs) at $0.255, $0.275 and $0.347, respectively.
The Relative Strength Index (RSI) at 39 leans toward oversold territory. At the same time, the Moving Average Convergence Divergence (MACD) stays in negative territory, together suggesting persistent downside pressure despite a brief bounce from recent lows.
On the topside, initial resistance is aligned at the prior horizontal barrier near $0.245, followed by the 50-day EMA around $0.255 and the downtrend break level at $0.265; above that, the 23.6% Fibonacci retracement at $0.271 (drawn from January high to the February low) and the 100-day EMA at $0.275 add to a broader supply zone before stronger resistance emerges near $0.2991 and the 38.2% Fibonacci retracement at $0.303.
On the downside, immediate support lies at the horizontal floor around $0.236, and a clear break of this level would expose the pair to further weakness within the broader bearish structure.
(The technical analysis of this story was written with the help of an AI tool.)














