
Cardano Price Forecast: ADA risks mid-week gains under broader market pressure
بواسطة Vishal Dixit
تم التحديث: 9 Apr 2026


المقالات الشائعة

Cardano (ADA) is under renewed selling pressure, extending Wednesday’s 4% loss below $0.2500 at press time on Thursday. Intense long liquidations in the ADA futures over the last 24 hours suggest waning bullish interest among traders.
- Cardano extends its losses on Thursday, after a 4% drop the previous day.
- Leverage market flips bearish with liquidations exceeding $600,000 over the last 24 hours.
- The technical outlook is mildly bearish, as the midweek recovery reverses before reaching the 50-day EMA.
Cardano (ADA) is under renewed selling pressure, extending Wednesday’s 4% loss below $0.2500 at press time on Thursday. Intense long liquidations in the ADA futures over the last 24 hours suggest waning bullish interest among traders. Cardano must reclaim the 50-day Exponential Moving Average (EMA) at $0.2672 for extended recovery.
Cardano futures under pressure drive traders bearish
The broader market sentiment is mixed after the US-Iran ceasefire is at risk as Israel continues missile strikes on Lebanon. The short-term bullish interest in Cardano futures linked to the ceasefire announcement on Tuesday has waned.
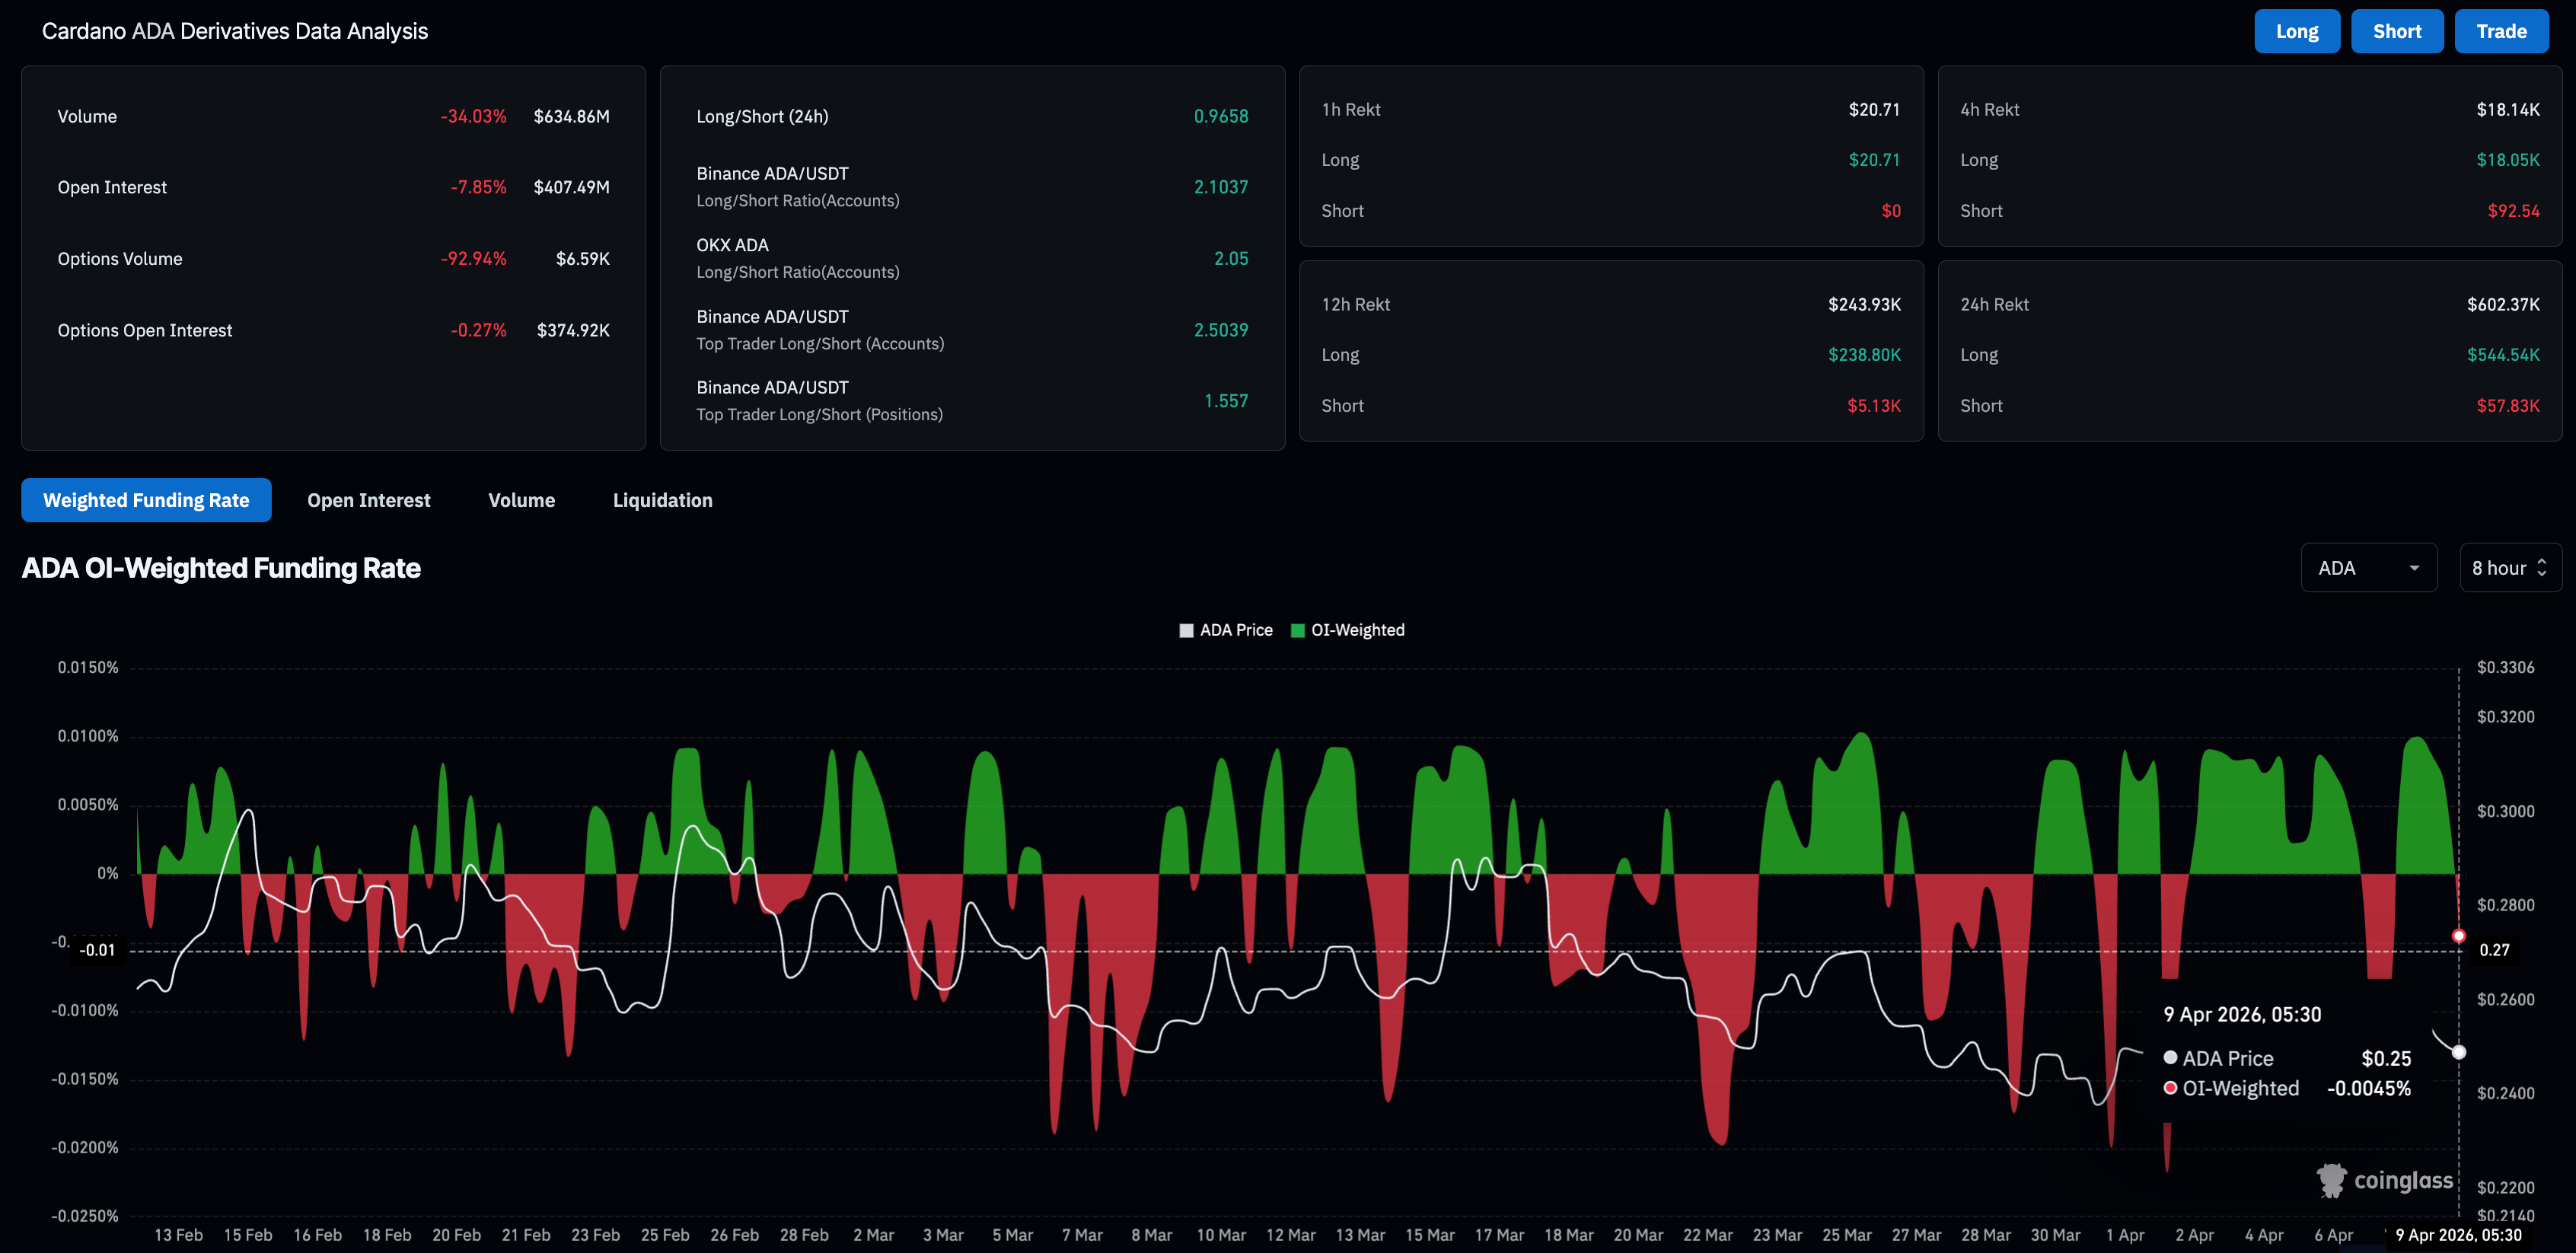
According to CoinGlass, the liquidated ADA derivatives positions over the last 24 hours totaled $602,370, including $544,540 in long liquidations, suggesting a bullish-focused wipeout. This intense liquidation resulted in a roughly 8% drop in the ADA futures Open Interest (OI) to $407.49 million in the same period.
Additionally, the OI-weighted funding rate fell to -0.0045% on Thursday, suggesting traders are leaning toward a short positional buildup.
Technical outlook: Cardano loses bullish momentum
Cardano remains under pressure as it holds well below the 50-, 100-, and 200-day Exponential Moving Averages (EMAs), with the nearest dynamic cap coming from the 50-day EMA at $0.2673.
Momentum indicators only hint at tentative stabilization rather than a clear bullish shift as long as these overhead averages remain unreclaimed. The Moving Average Convergence Divergence (MACD) shows a marginally positive reading, and the Relative Strength Index (RSI) at 46 hovers just below the neutral midline level.
Looking down, the immediate support for Cardano lies at the March 29 low at $0.2328, with the February 6 low at $0.2205 providing further support.
On the topside, initial resistance is at the 50-day EMA around $0.2673. A daily close above this barrier would ease the immediate bearish tone and open the way toward the $0.2991 resistance level, last tested on February 26, close to the 100-day EMA near $0.3107.
(The technical analysis of this story was written with the help of an AI tool.)

يعتمد أكثر من مليون مستخدم على FXStreet للحصول على بيانات سوقية لحظية، وأدوات رسوم بيانية، ورؤى خبراء، وأخبار الفوركس. يساعد تقويمهم الاقتصادي الشامل والندوات التعليمية عبر الويب المتداولين على البقاء على اطلاع واتخاذ قرارات محسوبة. لدى FXStreet فريق يضم حوالي 60 محترفًا موزعين بين مقر برشلونة ومناطق عالمية مختلفة.
اقرأ المزيد


