
Cardano Price Forecast: ADA steadies as whales accumulate and bullish sentiment grows
بواسطة Manish Chhetri
تاريخ النشر: 26 Feb 2026 | تاريخ التعديل: 26 Feb 2026


المقالات الشائعة

Cardano (ADA) price steadies at $0.29 on Thursday after surging over 14% in the previous day. Improving on-chain and derivatives data support a positive outlook as whale wallets are increasing exposure alongside positive funding rates.
- Cardano price steadies at $0.29 on Thursday after rallying over 14% in the previous day.
- On-chain data shows rising holders accumulating, while derivatives data reflects improving sentiment.
- The technical analysis suggests a cautiously bullish stance if the broken descending trendline holds as support.
Cardano (ADA) price steadies at $0.29 on Thursday after surging over 14% in the previous day. Improving on-chain and derivatives data support a positive outlook as whale wallets are increasing exposure alongside positive funding rates. On the technical side, price action has turned cautiously constructive, with the recently broken descending trendline now acting as a key support level that will determine the next directional move.
Holders’ increasing exposure to ADA boosts sentiment
Santiment’s Supply Distribution data supports a bullish outlook for Cardano, as the number of large-wallet holders (whales) is increasing.
The metric indicates that whales holding between 1 million and 10 million ADA tokens (yellow line) and those holding between 10 million and 100 million ADA tokens have accumulated a total of 260 million tokens from February 14 to Thursday. During the same period, wallets holding between 100,000 and 1 million ADA tokens (red line) have shed 20 million tokens.
This shows that the second cohort of whales could have fallen prey to the capitulation event. In contrast, the first set of wallets seized the opportunity and accumulated Cardano at a discount.
 [07-1772076534901-1772076534903.59.01, 26 Feb, 2026].png)
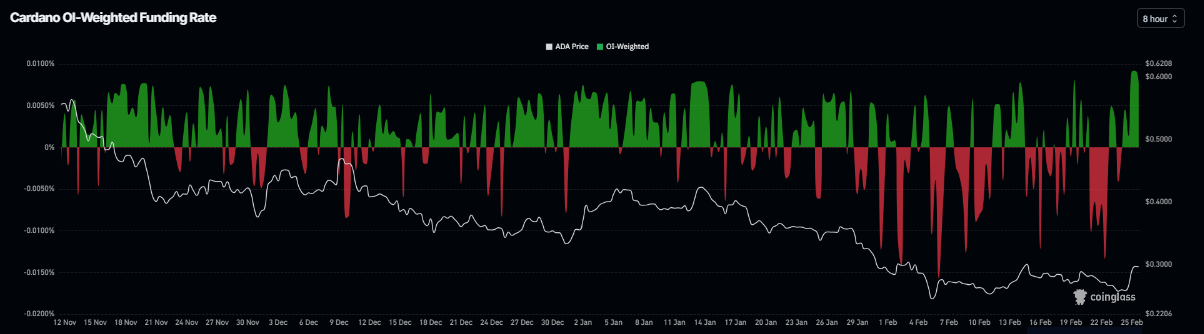
Apart from the holders accumulating, the derivative data also supports a positive bias. Cardano’s funding rates flipped positive on Tuesday and surges to 0.007% on Thursday, indicating that longs are paying shorts. Historically, as shown in the chart below, when the funding rates have flipped from negative to positive and risen, the Cardano price has rallied sharply.
Cardano Price Forecast: Price action shows a cautiously bullish stance
Cardano price is trading at $0.29 as of writing on Thursday. The near-term bias is cautiously bullish after the price broke above the long-standing descending trend-line, with the breakout occurring around $0.28 and holding so far.
ADA now trades above the former resistance-turned-support, while still capped below the 50-day Exponential Moving Average (EMA), which flattens near $0.31 and tempers upside conviction.
On the daily chart, the Relative Strength Index (RSI) at 52 stabilizes just above the midline, signaling modest bullish momentum, and the Moving Average Convergence Divergence (MACD) indicator holds in positive territory with the MACD line above the signal line, reinforcing the improving tone.
Immediate support is seen at the broken trend-line region near $0.28, ahead of stronger horizontal support at $0.24, where a break would negate the nascent bullish structure.
On the upside, initial resistance aligns with the horizontal barrier at $0.32, broadly in line with the 50-day EMA, and a daily close above this area would open the door toward the $0.35 zone.
As long as ADA holds above $0.28, dips are likely to remain contained within this developing higher-base structure.
(The technical analysis of this story was written with the help of an AI tool.)

يعتمد أكثر من مليون مستخدم على FXStreet للحصول على بيانات سوقية لحظية، وأدوات رسوم بيانية، ورؤى خبراء، وأخبار الفوركس. يساعد تقويمهم الاقتصادي الشامل والندوات التعليمية عبر الويب المتداولين على البقاء على اطلاع واتخاذ قرارات محسوبة. لدى FXStreet فريق يضم حوالي 60 محترفًا موزعين بين مقر برشلونة ومناطق عالمية مختلفة.
اقرأ المزيد


