
Cardano Price Forecast: ADA traders lose conviction as Trump’s warning on Iran’s power grid shakes risk appetite
بواسطة Manish Chhetri
تاريخ النشر: 23 Mar 2026 | تاريخ التعديل: 23 Mar 2026


المقالات الشائعة

Cardano (ADA) is nearing key support, trading at $0.25 on Monday after falling by more than 7% the previous week. Weakening derivatives data, alongside dampened risk sentiment amid escalating conflicts in the Middle East, continue to weigh on ADA, hinting at a deeper correction ahead.
- Cardano price near the key support on Monday, a close below would trigger deeper correction.
- Derivatives data shows bearish sentiment with falling open interest alongside negative funding rates.
- Escalating geopolitical tensions after Donald Trump threatened strikes on Iran’s power grid have dampened risk appetite, weighing on risky assets.
Cardano (ADA) is nearing key support, trading at $0.25 on Monday after falling by more than 7% the previous week. Weakening derivatives data, alongside dampened risk sentiment amid escalating conflicts in the Middle East, continue to weigh on ADA, hinting at a deeper correction ahead.
Escalating geopolitical tensions weigh on risk sentiment
Crypto markets begin the week on a cautious note amid escalating tensions between the US and Iran, which continue to weigh on investor sentiment.
Iran said on Sunday it would strike the energy and water systems of its Gulf neighbours in retaliation if US President Donald Trump follows through with a threat delivered a day earlier to hit Iran’s electricity grid in 48 hours, reported Reuters.
These rising war tensions have pressured risk assets, with Bitcoin closing below $67,360 on Sunday, triggering widespread liquidations across the crypto market. Cardano mirrored BTC’s move, extending losses to close near $0.25 and trading cautiously on Monday.
Cardano traders’ waning participation
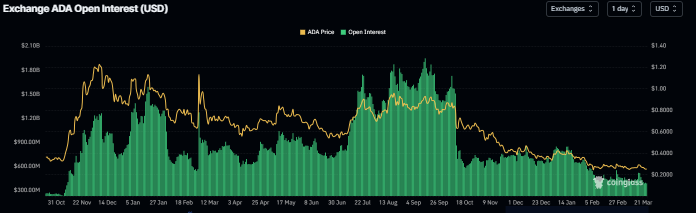
Cardano’s futures Open Interest (OI) dropped to $388.23 million on Monday and has been continuously falling since mid-March. This drop in OI reflects waning investor participation and projects a bearish outlook.
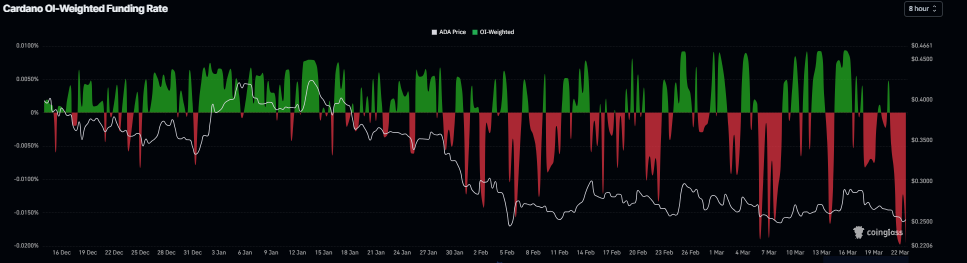
In addition, CoinGlass funding rates data also supports negative sentiment. The metric flipped to a negative rate on Saturday and has been falling sharply, to -0.019% on Monday, indicating shorts are paying longs and suggesting bearish sentiment toward ADA.
Cardano Price Forecast: ADA bears are in control of the momentum
Cardano price is trading at $0.25 as of writing on Monday. The near-term bias is mildly bearish as price holds well below the 50-day and 100-day Exponential Moving Averages (EMAs), near $0.28 and $0.33, respectively, keeping the broader downtrend in place after the recent failure to sustain above $0.29.
The Relative Strength Index (RSI) on the daily chart at 41 stays below the midline, showing persistent but not extreme selling pressure. The Moving Average Convergence Divergence (MACD) line has slipped back below the signal line just under the zero mark, and the contracting histogram suggests fading upside momentum after a brief recovery attempt.
Immediate resistance is seen at the 23.6% Fibonacci retracement at $0.27, measured from the $0.22 low to the $0.43 high, with stronger resistance at the horizontal barrier and 38.2% retracement cluster near $0.30. A daily close above $0.30 would ease the current bearish tone and open the way toward the 50% retracement at $0.32.
On the downside, initial support aligns with the horizontal level at $0.24, ahead of the major floor at $0.22, where prior lows and the Fibonacci origin converge; a break below $0.22 would signal a continuation of the broader decline.
-1774237524428-1774237524429.png)
(The technical analysis of this story was written with the help of an AI tool.)

يعتمد أكثر من مليون مستخدم على FXStreet للحصول على بيانات سوقية لحظية، وأدوات رسوم بيانية، ورؤى خبراء، وأخبار الفوركس. يساعد تقويمهم الاقتصادي الشامل والندوات التعليمية عبر الويب المتداولين على البقاء على اطلاع واتخاذ قرارات محسوبة. لدى FXStreet فريق يضم حوالي 60 محترفًا موزعين بين مقر برشلونة ومناطق عالمية مختلفة.
اقرأ المزيد


