

Cardano Price Forecast: Bullish momentum persists as traders stay cautiously optimistic
- Cardano edges lower on Monday after surging over 31% and closing above key 50-day EMA at $0.186 the previous week.
- Mixed signals in the derivatives markets, with a slight bullish tilt, suggest traders remain cautiously optimistic.
- The technical outlook continues to favor the upside, indicating bullish momentum remains intact despite the short-term pullback.
Cardano (ADA) is trading slightly lower on Monday, finding support around the key technical level at $0.186. ADA pauses its gains at the start of this week after posting a massive 31% rally in the previous week. Despite the pullback, derivatives data suggests traders remain cautiously optimistic, while momentum indicators indicate that the uptrend remains intact if ADA holds the key support zone.

Cardano traders remain cautiously optimistic
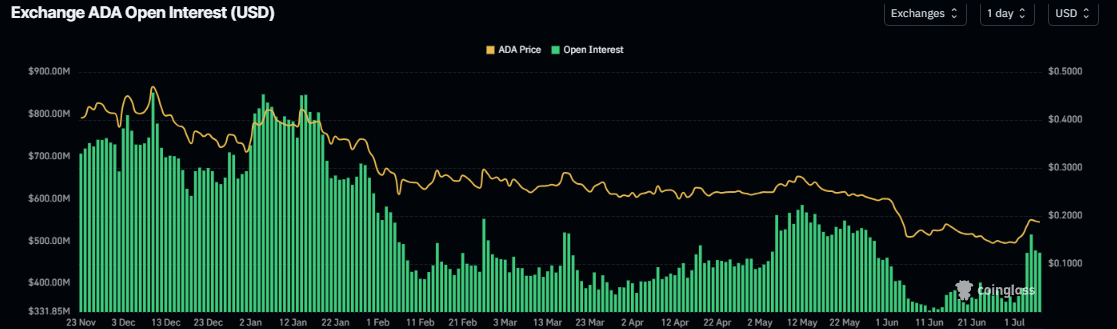
Derivatives data for Cardano shows cautious optimism among traders. ADA’s futures Open Interest (OI) surges to $515 million on Sunday, the highest level since the end of May and steadies around $472 million on Monday. This rise in OI reflects increasing investor participation and projects a bullish outlook.
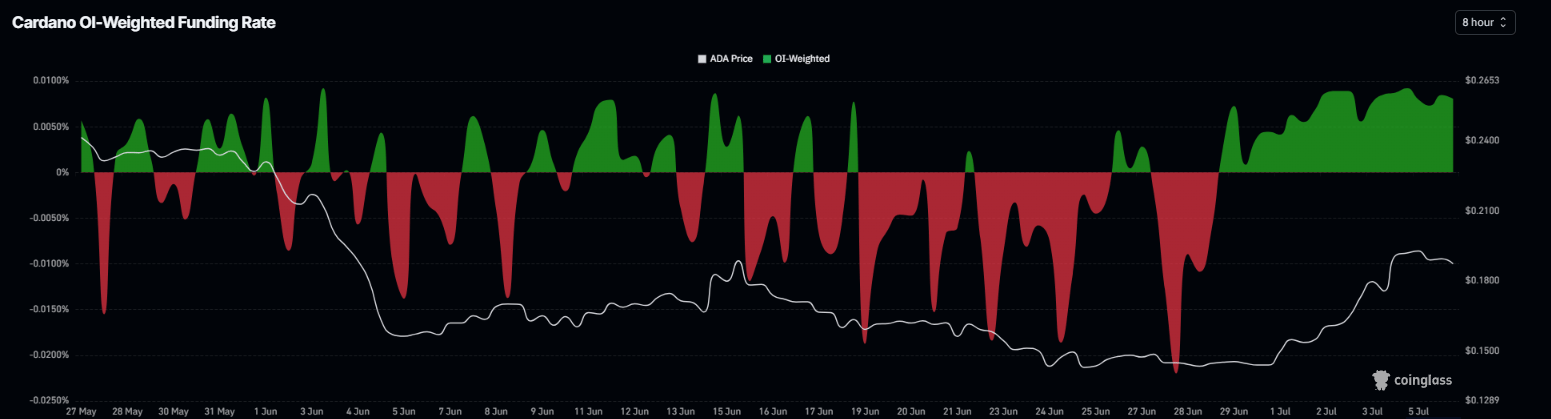
In addition, the funding rates data also shows improving sentiment. CoinGlass’ OI-Weighted Funding Rate data for ADA flipped positive last week and surged to 0.0080% on Monday. This positive rate indicates that longs are paying shorts and projects a bullish sentiment.
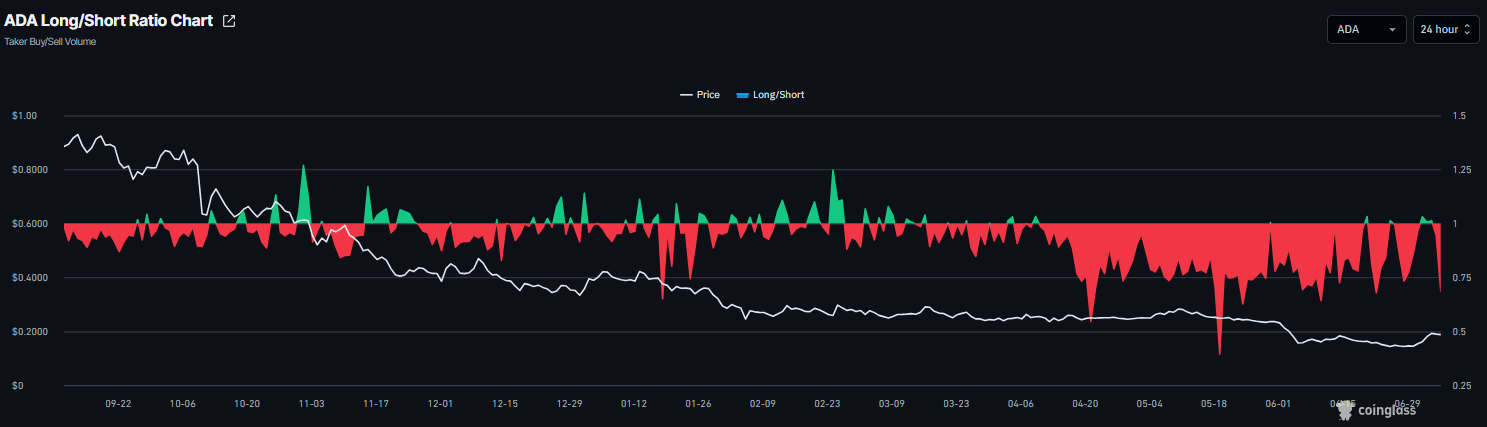
Despite rising Open Interest and positive funding rates, Cardano’s long-to-short ratio shows a bearish bias. The ratio reads 0.68 on Monday, nearing its lowest level in over a month. This ratio, being below one, reflects bearish sentiment in the market, as more traders are betting on the asset’s price to fall.
Cardano Price Forecast: Momentum indicators support further gains
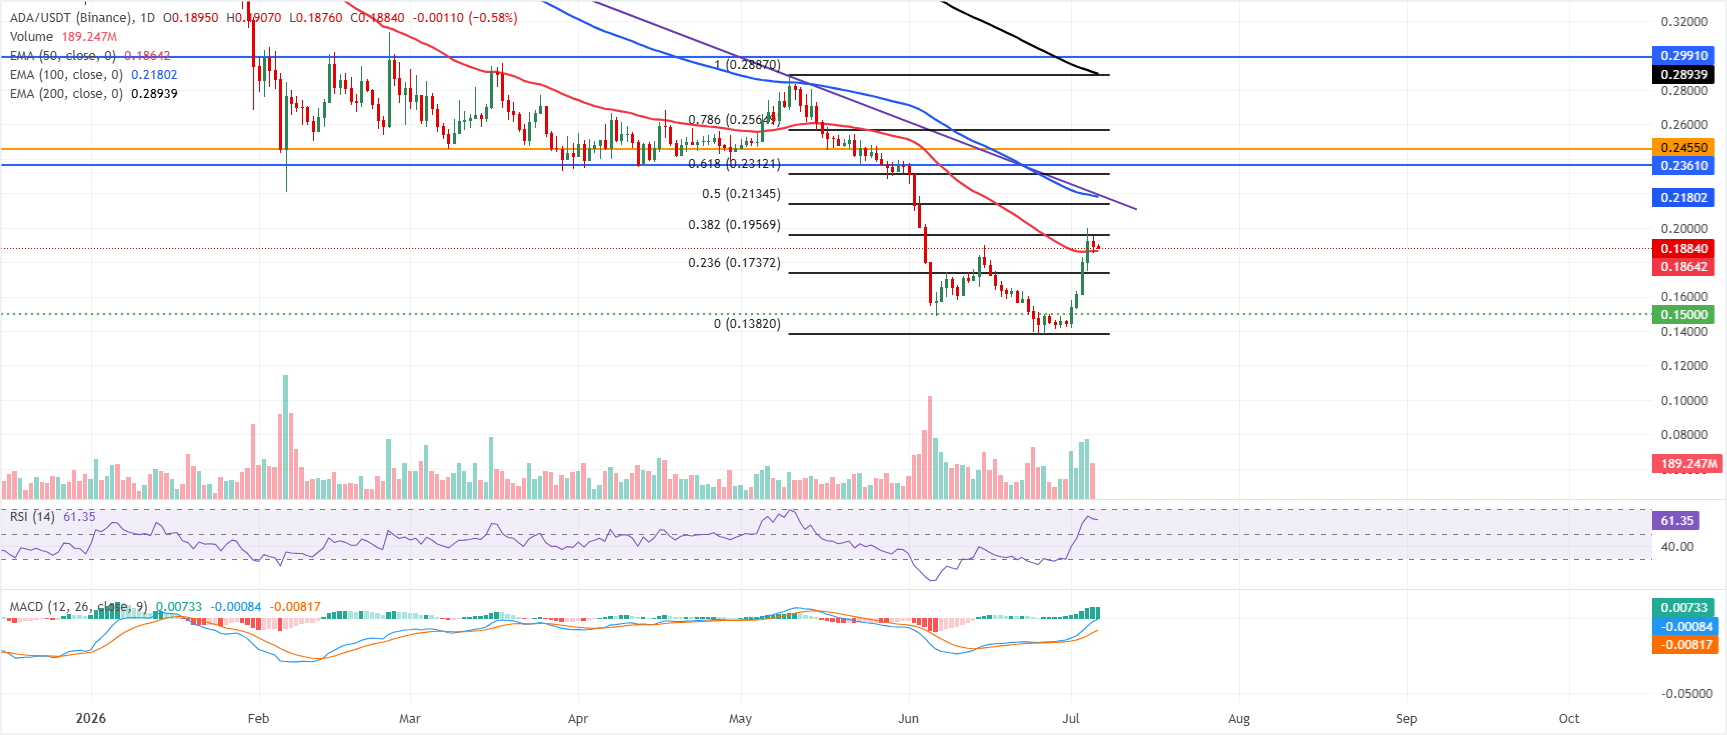
Cardano price trades at $0.188 on Monday, up over 31% in the previous week. ADA has reclaimed the 50-day Exponential Moving Average (EMA) at $0.186, but remains well below the 100-day EMA at $0.218 and the 200-day EMA at $0.289, keeping the broader bias capped despite the latest rebound.
The Relative Strength Index (RSI) hovers near 61, while the Moving Average Convergence Divergence (MACD) holds in positive territory, which together hints at improving upside momentum within a still broader bearish structure.
On the topside, initial resistance is aligned at the 38.2% Fibonacci retracement at $0.195, ahead of a more congested band formed by the 50% retracement at $0.213, the 100-day EMA at $0.218 and the descending trendline break level around $0.219. Further north, the 61.8% Fibonacci retracement at $0.231 and horizontal barriers at $0.236 and $0.245 precede stronger supply near the 78.6% Fibonacci retracement at $0.256 and the 200-day EMA at $0.289, with another resistance marker at $0.299.
On the downside, immediate support is provided by the reclaimed 50-day EMA at $0.186, followed by the 23.6% Fibonacci retracement at $0.173; a break lower would expose the horizontal floor at $0.150 and the Fibonacci anchor near $0.138.
(The technical analysis of this story was written with the help of an AI tool.)














