
Cardano struggles to extend gains as retail interest wanes despite Midnight's NIGHT token launch
بواسطة Vishal Dixit
تاريخ النشر: 22 Dec 2025 | تاريخ التعديل: 22 Dec 2025


المقالات الشائعة

Cardano (ADA) recovers over 2% at press time on Monday, struggling to extend gains within a descending wedge pattern.
- Cardano ticks higher after a bearish weekend, struggling to extend an upcycle within a descending wedge pattern.
- On-chain data shows an increase in trading volume and user activity after the Midnight side chain token launch.
- A negative funding rate and declining futures Open Interest suggest faltering retail interest.
Cardano (ADA) recovers over 2% at press time on Monday, struggling to extend gains within a descending wedge pattern. Despite the larger declining trend, Cardano’s network has seen a surge in on-chain volume over the last two weeks with the launch of its privacy-focused sidechain, Midnight network. Still, the derivatives data indicate a sell-side dominance among traders.
Bearish sentiment persists as post-Midnight launch boosts trading volume
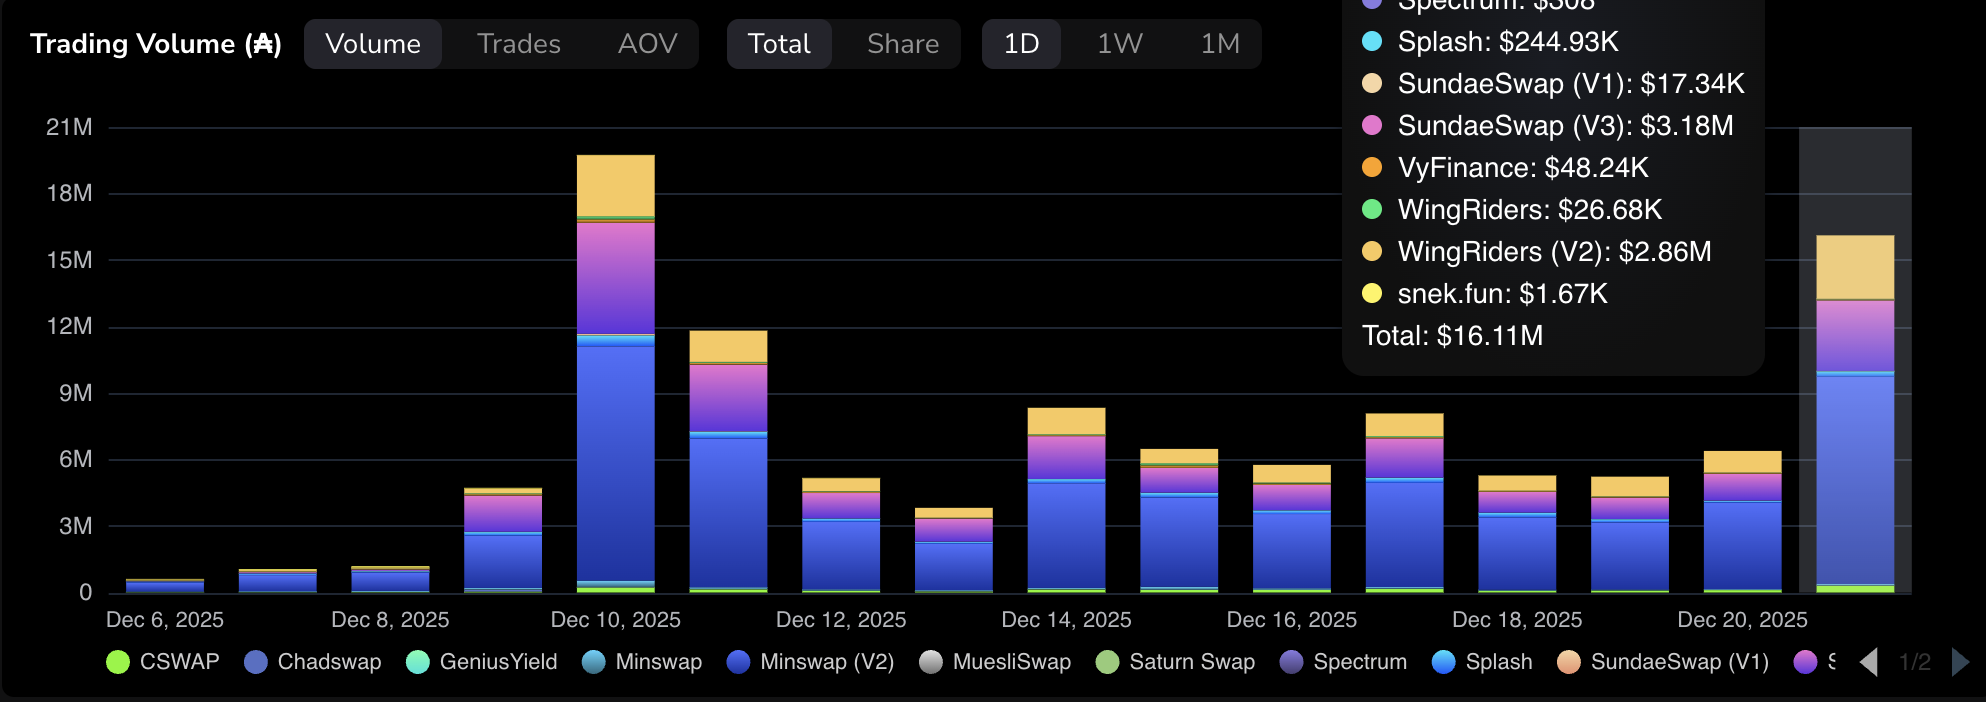
Cardano’s on-chain activity surged in December after the launch of its Midnight sidechain, peaking at $19.74 million on December 10. TapTools data shows that trading volume totaled $16.11 million on Sunday, up from $6.39 million the previous day.
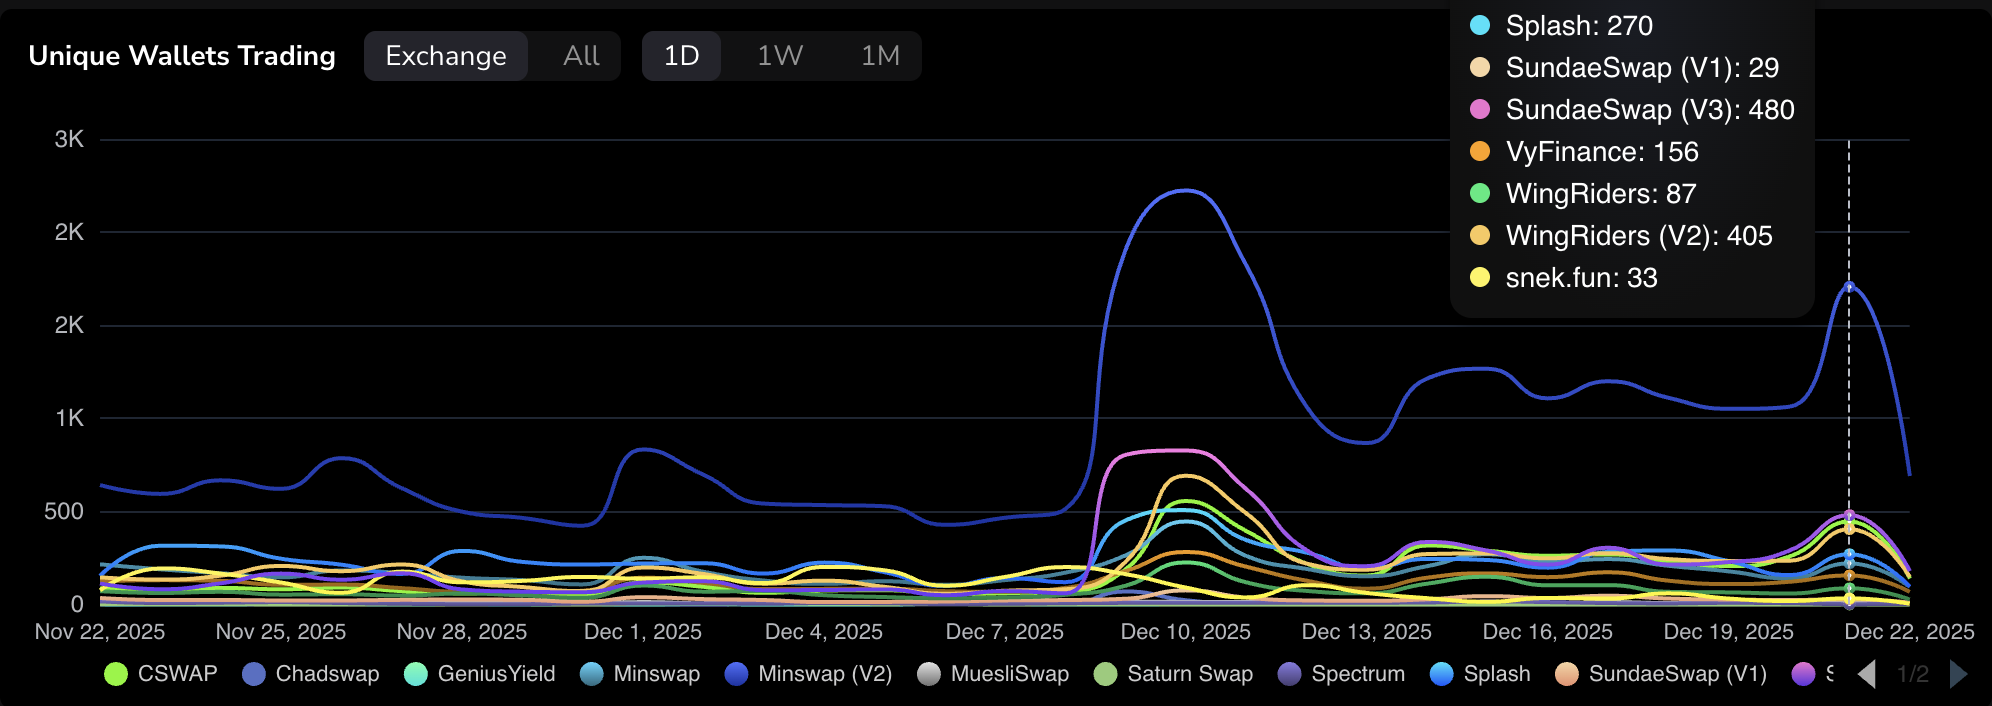
Similarly, the unique trading wallets reached a high of 3,150 in December and stood at 2,200 on Sunday.
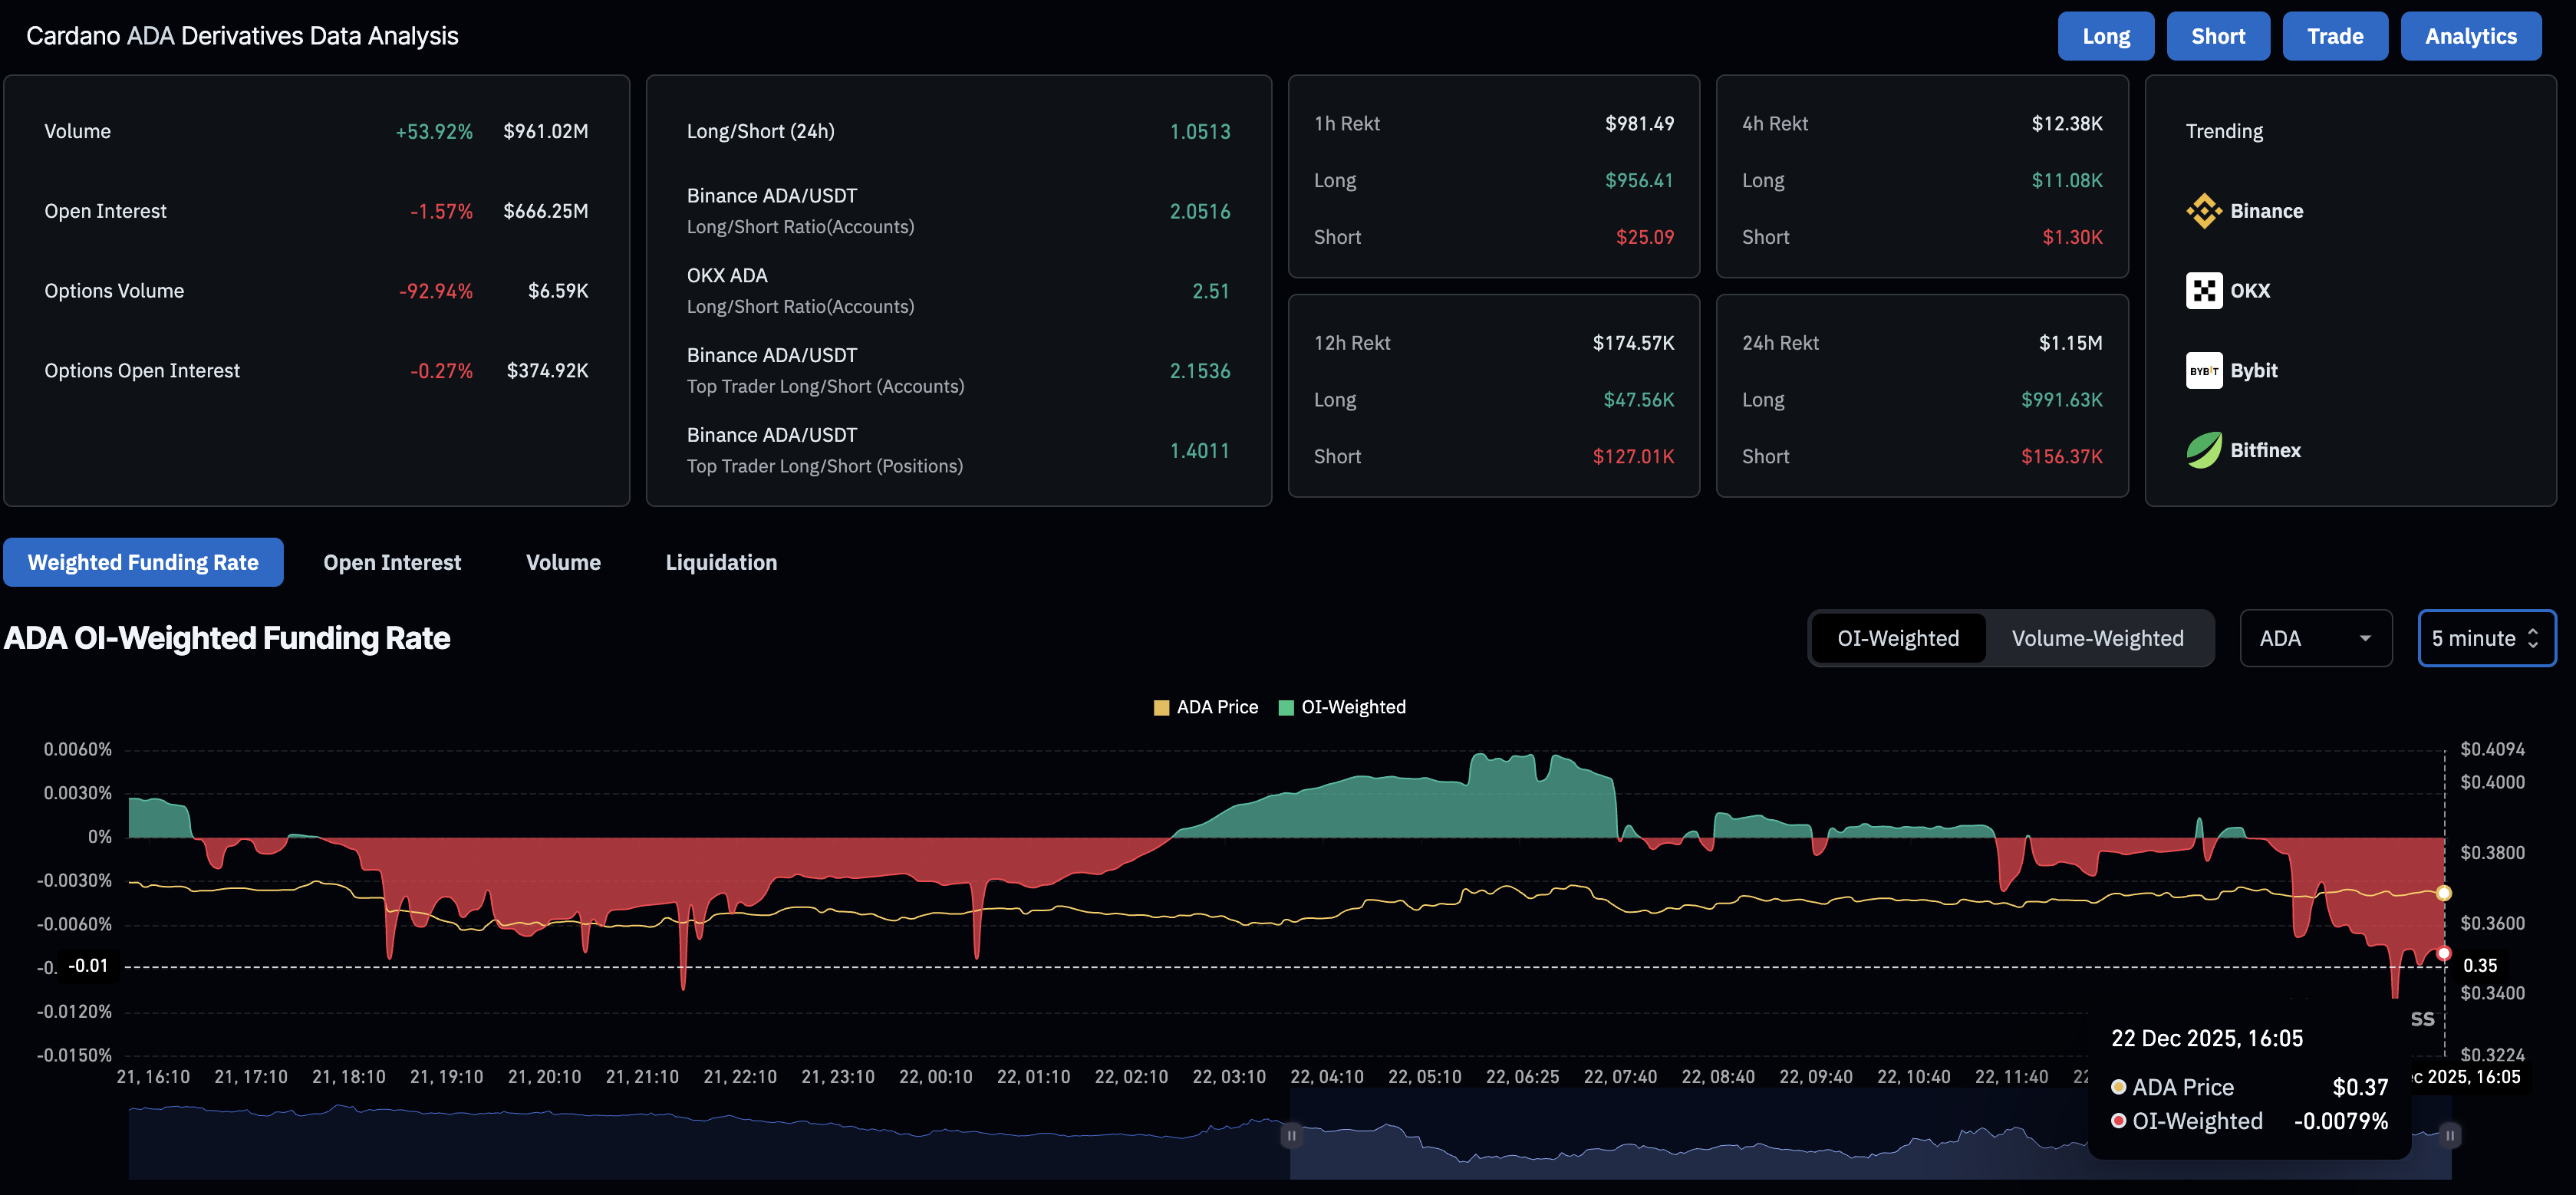
However, on the derivatives side, a risk-off sentiment among traders fuels the bearish interest. CoinGlass data shows a 1.57% decline in ADA futures Open Interest (OI) over the last 24 hours, to $666.25 million, suggesting traders are closing positions or reducing leverage.
Additionally, the OI-weighted funding rate is at -0.0079%, indicating that traders are paying a premium to hold bearish positions.
Cardano recovers in a falling wedge as selling pressure wanes
Cardano trades in a descending wedge pattern on the daily logarithmic chart formed by two converging trendlines. At the time of writing, ADA is up over 2% on Monday, recovering from two straight days of losses, and aims to extend the 7% gains from Friday.
A potential recovery in ADA could target the overhead trendline connecting the October 27 and December 9 highs, at $0.4350.
The technical indicators on the daily chart show a decline in selling pressure. The Relative Strength Index (RSI) at 38 reverses from the oversold zone, inching closer to the halfway line. Meanwhile, the Moving Average Convergence Divergence (MACD) approaches the signal line, suggesting a potential crossover that could signal a renewed bullish momentum.
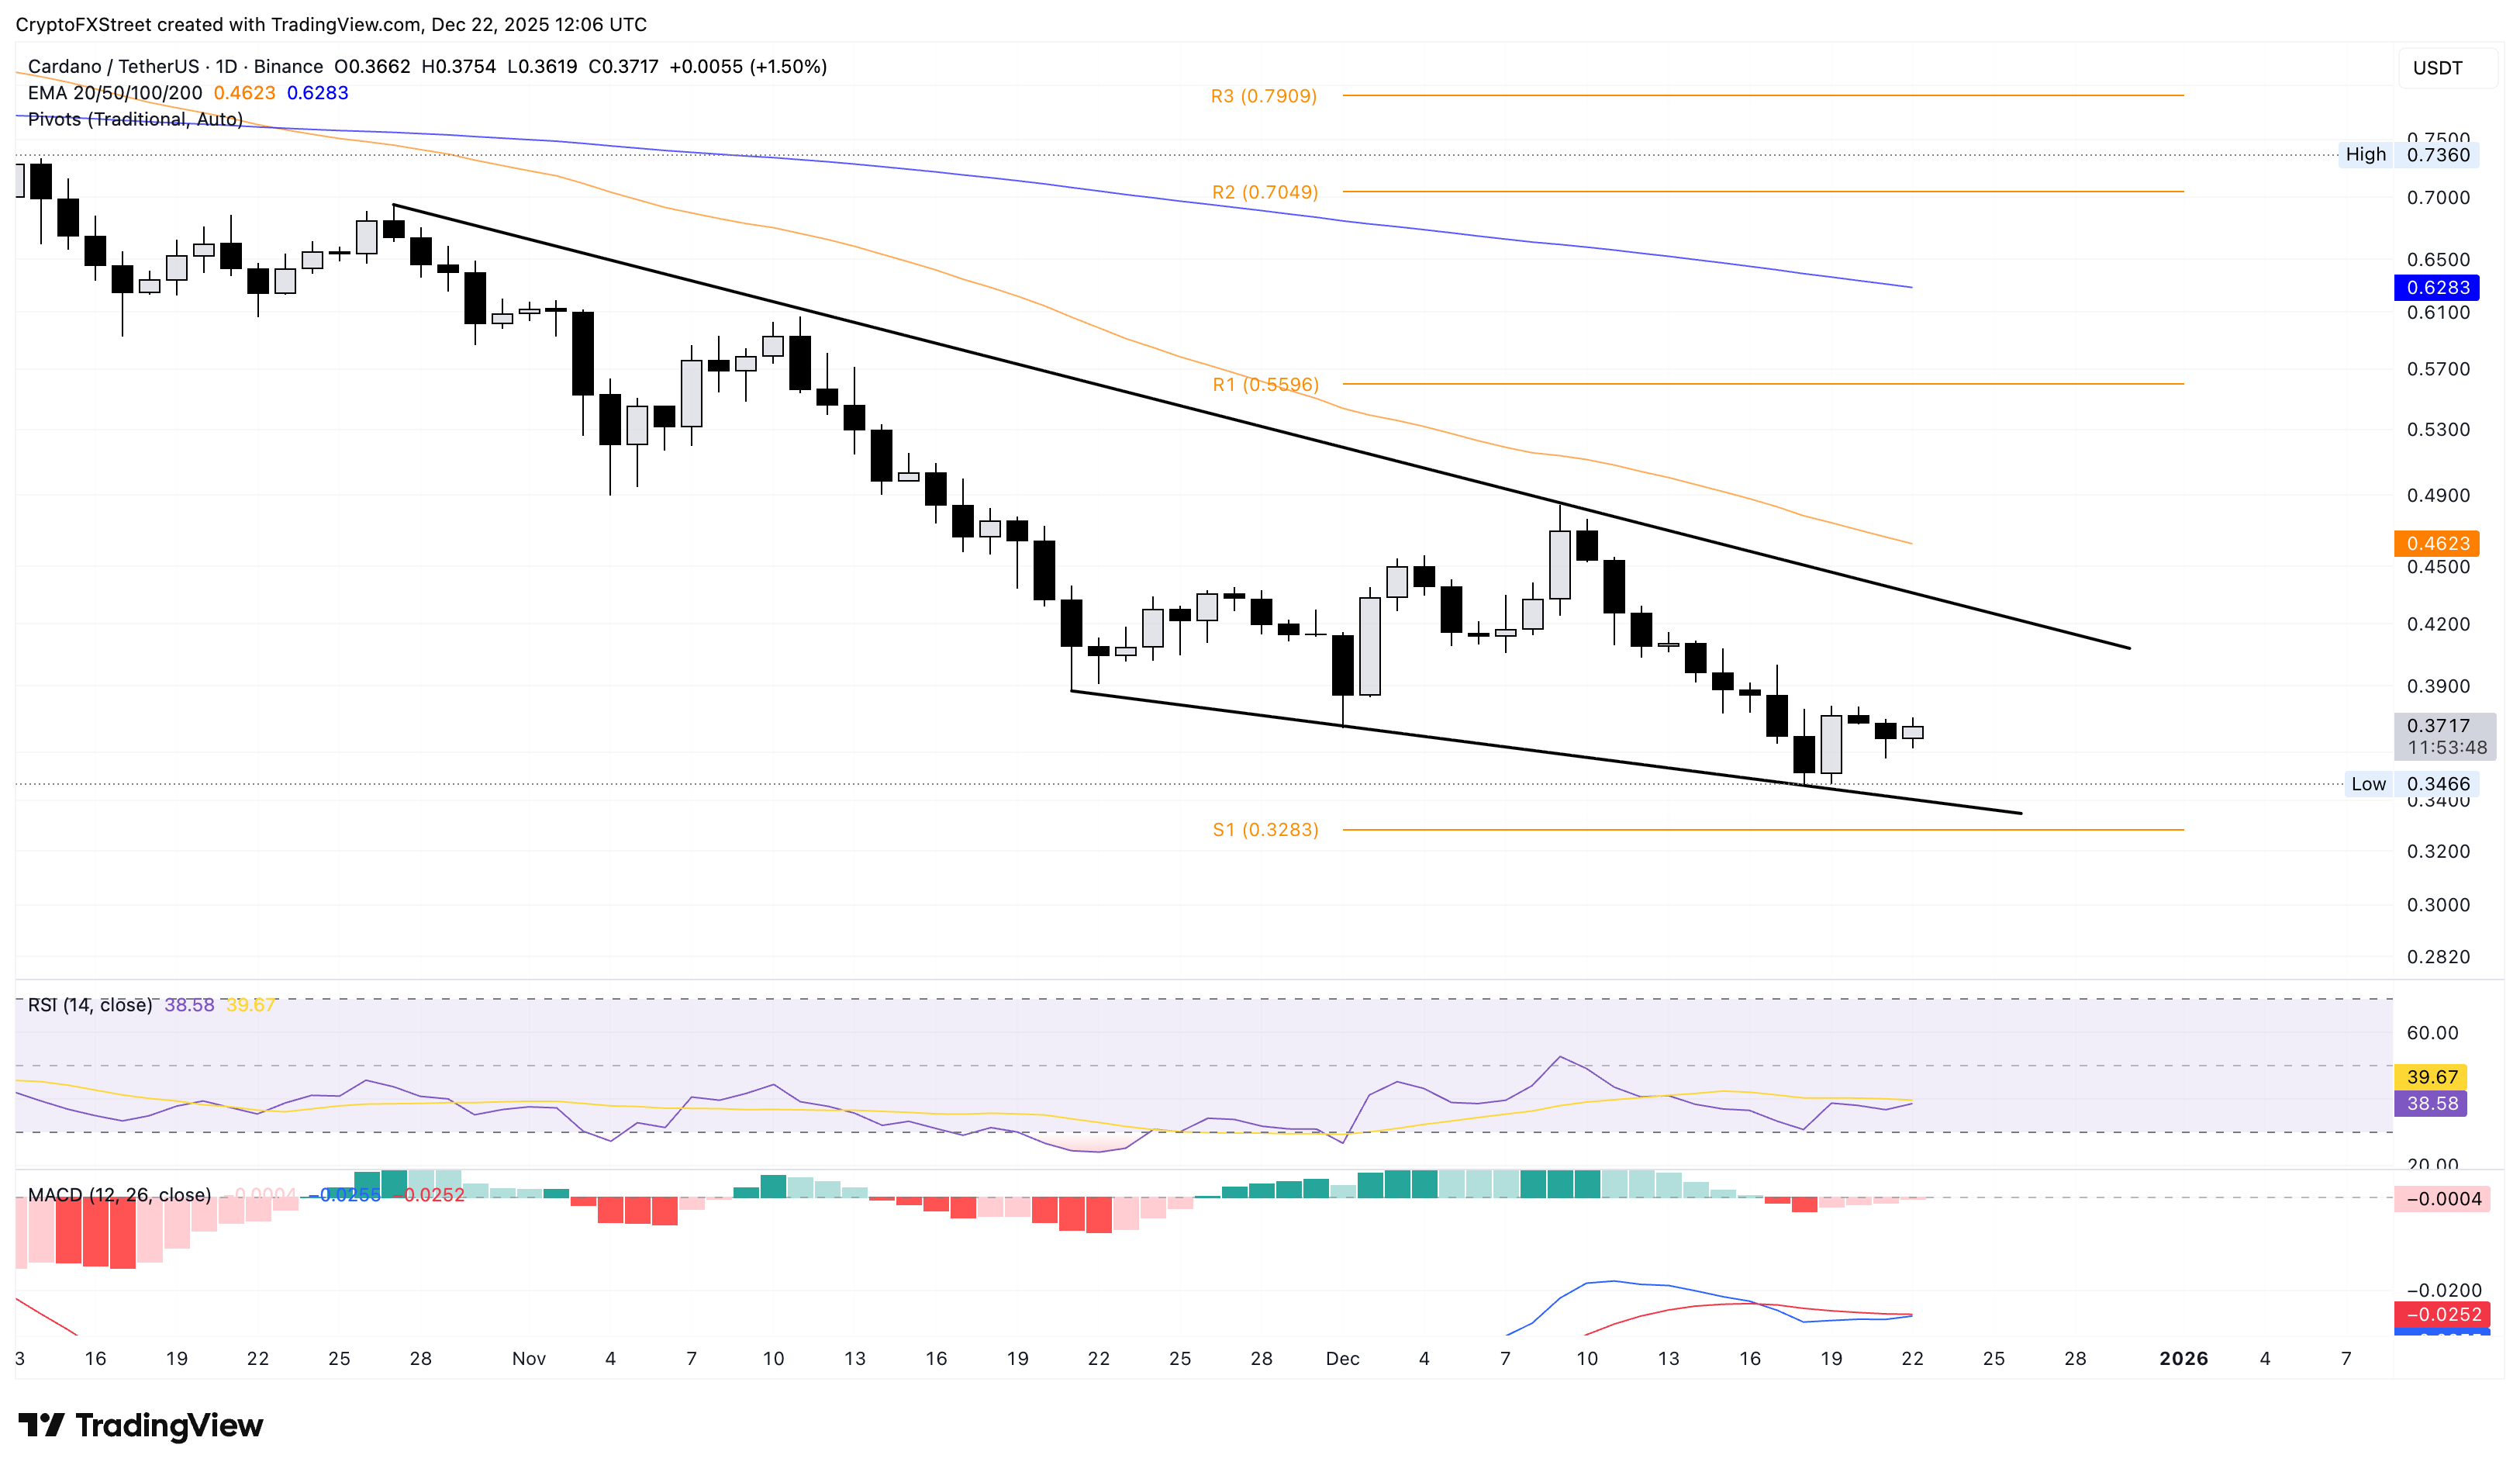
On the flip side, the lower trendline of the descending wedge pattern connecting the November 21 and December 1 lows, near $0.3415, could serve as immediate support.

يعتمد أكثر من مليون مستخدم على FXStreet للحصول على بيانات سوقية لحظية، وأدوات رسوم بيانية، ورؤى خبراء، وأخبار الفوركس. يساعد تقويمهم الاقتصادي الشامل والندوات التعليمية عبر الويب المتداولين على البقاء على اطلاع واتخاذ قرارات محسوبة. لدى FXStreet فريق يضم حوالي 60 محترفًا موزعين بين مقر برشلونة ومناطق عالمية مختلفة.
اقرأ المزيد


