
Crypto Market Overview: Bitcoin stuck near $60,000 – Zcash, Jupiter extend losses
بواسطة Vishal Dixit
تم التحديث: 29 Jun 2026


المقالات الشائعة

The broader cryptocurrency market continues to trade under pressure, with Bitcoin (BTC) struggling for direction near $60,000 on Monday. Retail sentiment in crypto leans bearish, with CoinMarketCap’s Fear and Greed Index at 15 on Monday, maintaining a sideways trend deep in the “Extreme Fear” zone.
- Bitcoin hovers below $60,000 on Monday, with buyers guarding the downside toward $53,000.
- The broader market sentiment is bearish, as Bitcoin’s stagnation weighs down on altcoins.
- Zcash and Jupiter are among the leading losers over the last 24 hours.
The broader cryptocurrency market continues to trade under pressure, with Bitcoin (BTC) struggling for direction near $60,000 on Monday. Retail sentiment in crypto leans bearish, with CoinMarketCap’s Fear and Greed Index at 15 on Monday, maintaining a sideways trend deep in the “Extreme Fear” zone.

Amid bearish market pressure, Zcash (ZEC) and Jupiter (JUP) are the leading losers over the last 24 hours.
Bitcoin’s uncertainty near $60,000 signals rebound chances
Bitcoin hovers below $60,000 at press time on Monday, maintaining a near-term mixed bias. The consolidation near the $60,000 support level reflects bullish resilience guarding the downside to the July 5, 2024, low of $53,485.
The 50- and 200-day Exponential Moving Averages (EMA) at $66,946 and $76,645, respectively, are well above the price, reinforcing a medium-term capped structure. That said, the momentum conditions remain fragile on the daily chart, with the Relative Strength Index (RSI) hovering just above the oversold threshold near 30, while the Moving Average Convergence Divergence (MACD) slips marginally below its signal line, suggesting persistent downside pressure.
On the topside, immediate resistance above the psychological $60,000 level is the $65,000 round figure, followed by the 50-day EMA at about $66,946.
Zcash hits a make-or-break level
Zcash hovers around $375 on Monday, holding steady below the 200-day EMA at $381 after two days of losses. The near-term bias remains bearish, testing the 50% retracement level at $356, measured over the upswing from $184 to $390.
The RSI at 37 shows a pullback from the midline as buying pressure wanes, while the MACD extends below the signal line in the negative territory as the downside histogram expands, hinting at dominant selling pressure.
Looking up, the 200- and 50-day EMAs at $381 and $455 emerge as key upside barriers, followed by the 78.6% Fibonacci retracement level at $520.
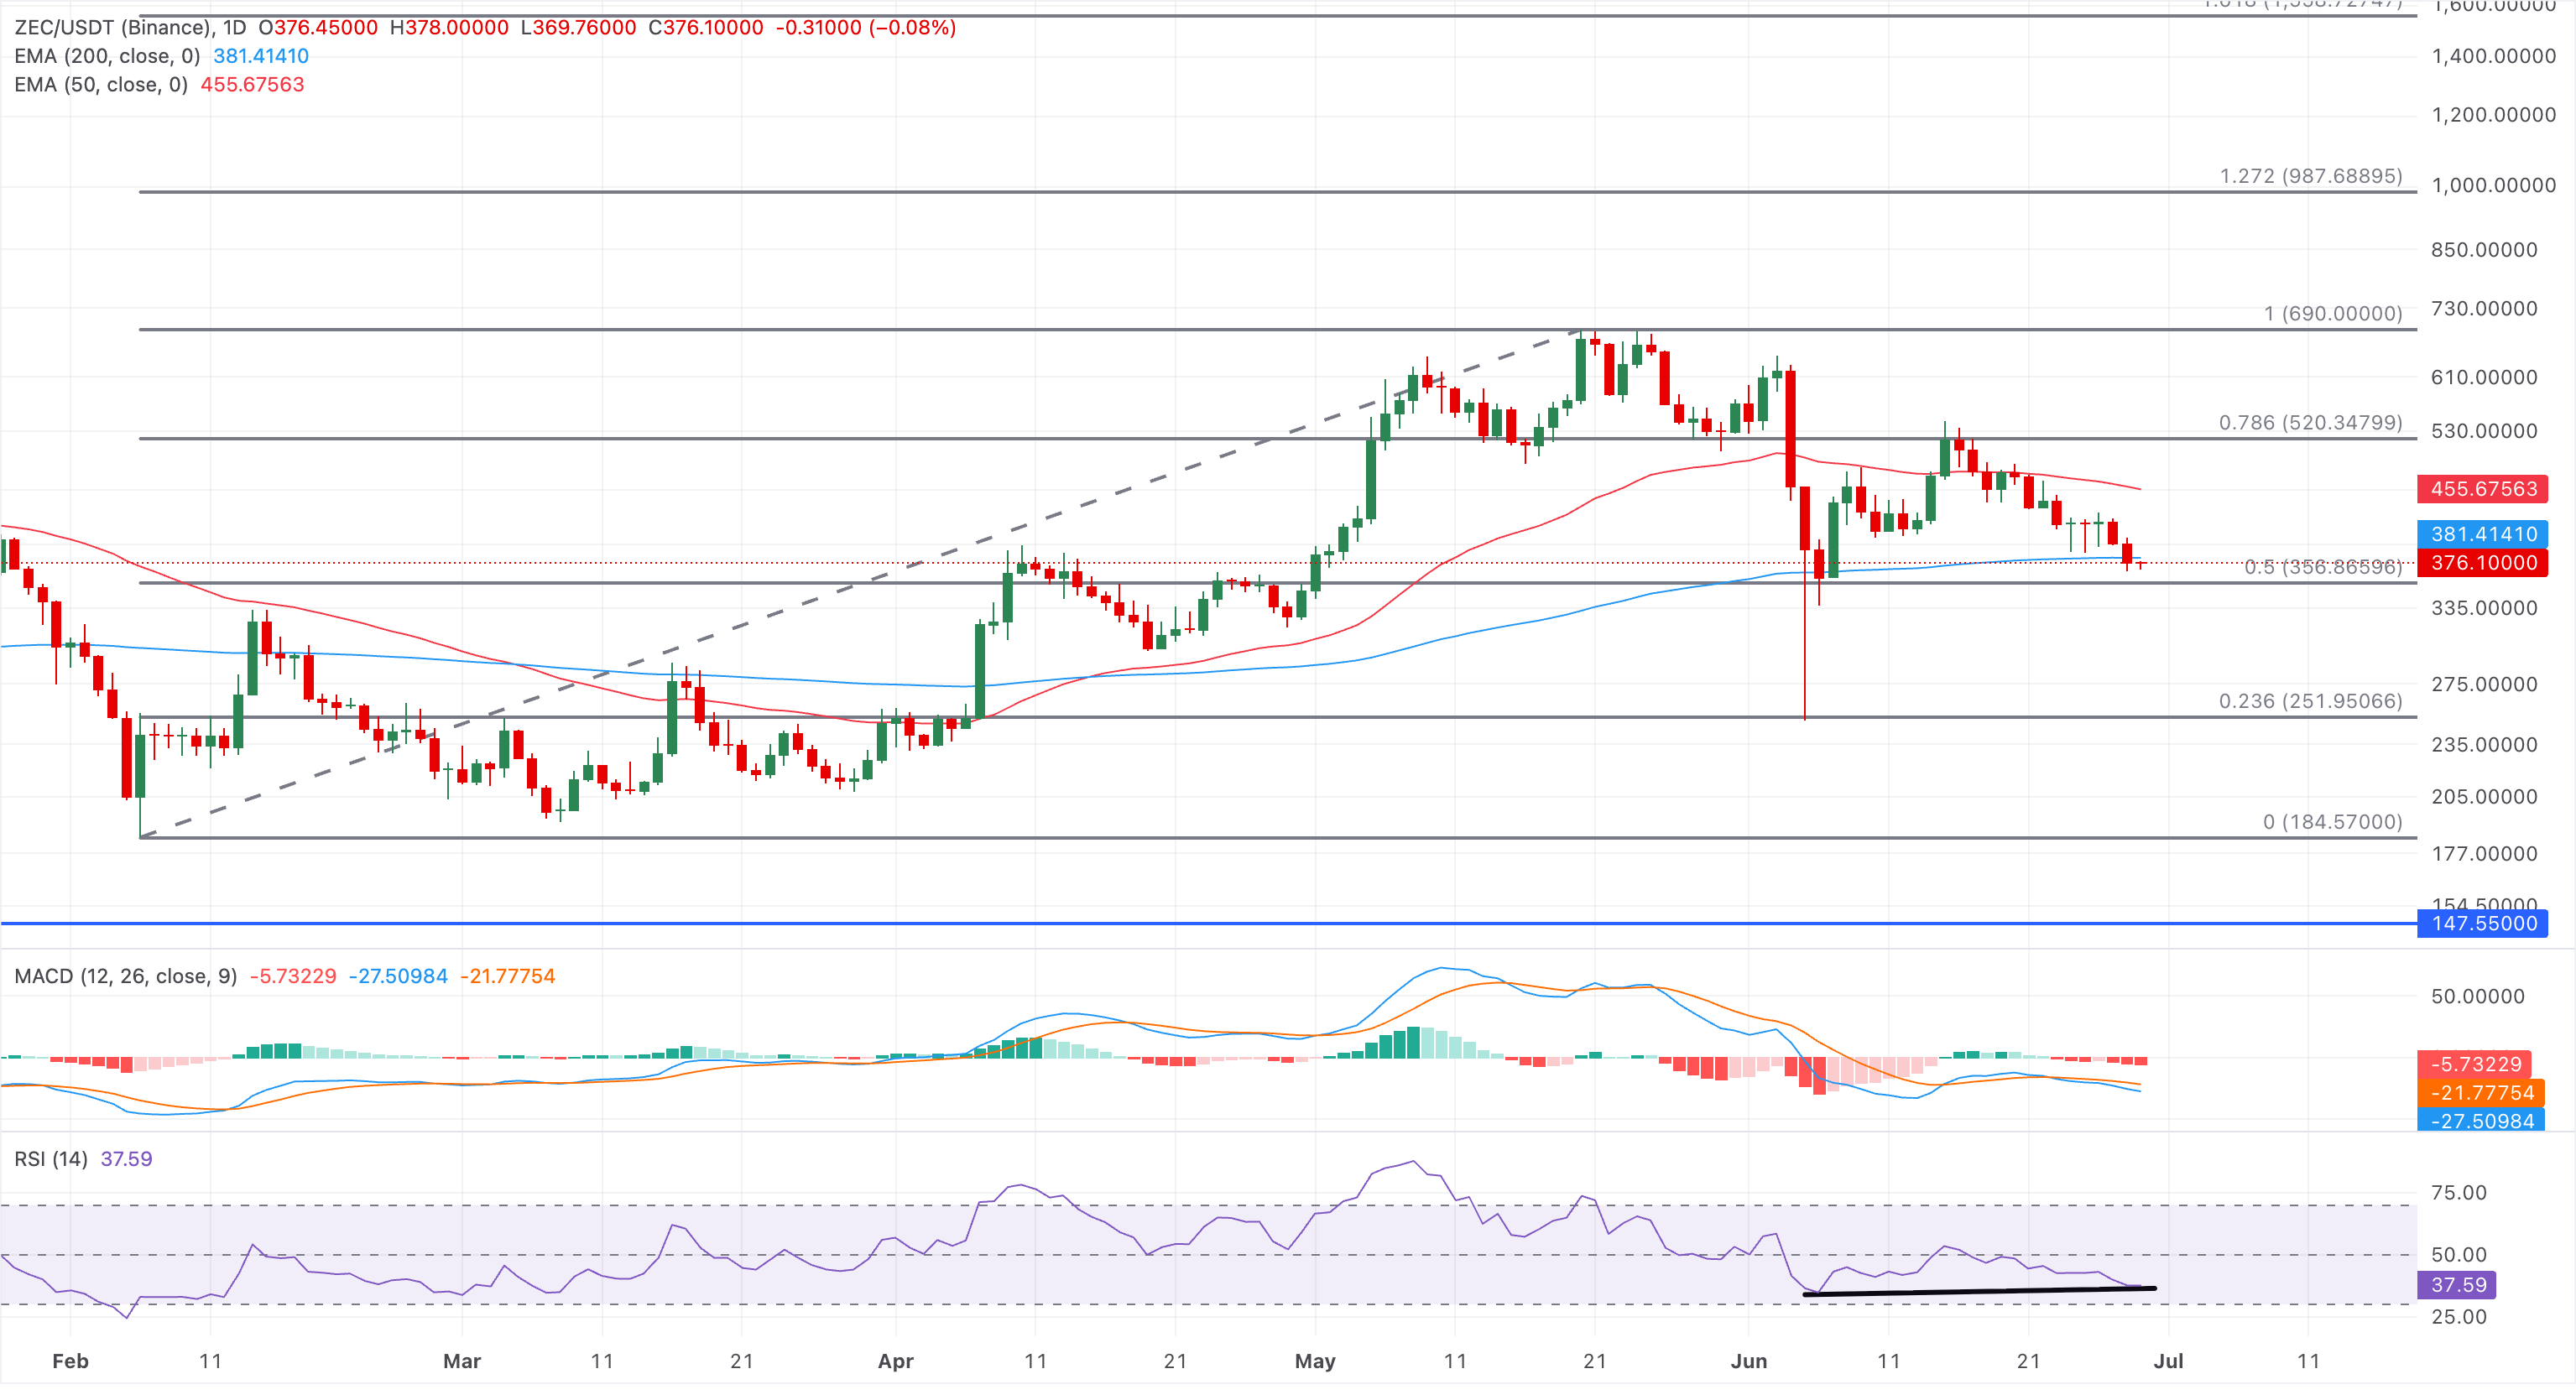
On the downside, support emerges at the 50% retracement at $356, followed by the 23.6% retracement around $251, ahead of the broader cycle floor near 184.57, where buyers would be expected to more firmly challenge the prevailing bearish structure if reached.
Jupiter capped by key resistance risks fresh lows
Jupiter trades close to the $0.2000 psychological mark on Monday, after two consecutive days of losses. The two-day decline reflects a bearish turnaround from an overhead resistance trendline near $0.2350, which capped Jupiter's fourth recovery attempt since October 2025.
A decisive close above this trendline could start a recovery run toward the November 27 high at $0.2662, followed by the October 11 low at $0.3255.
The MACD and signal line risk a bearish crossover, while the RSI at 54 flips downside from the overbought boundary, suggesting a decline in bullish momentum.
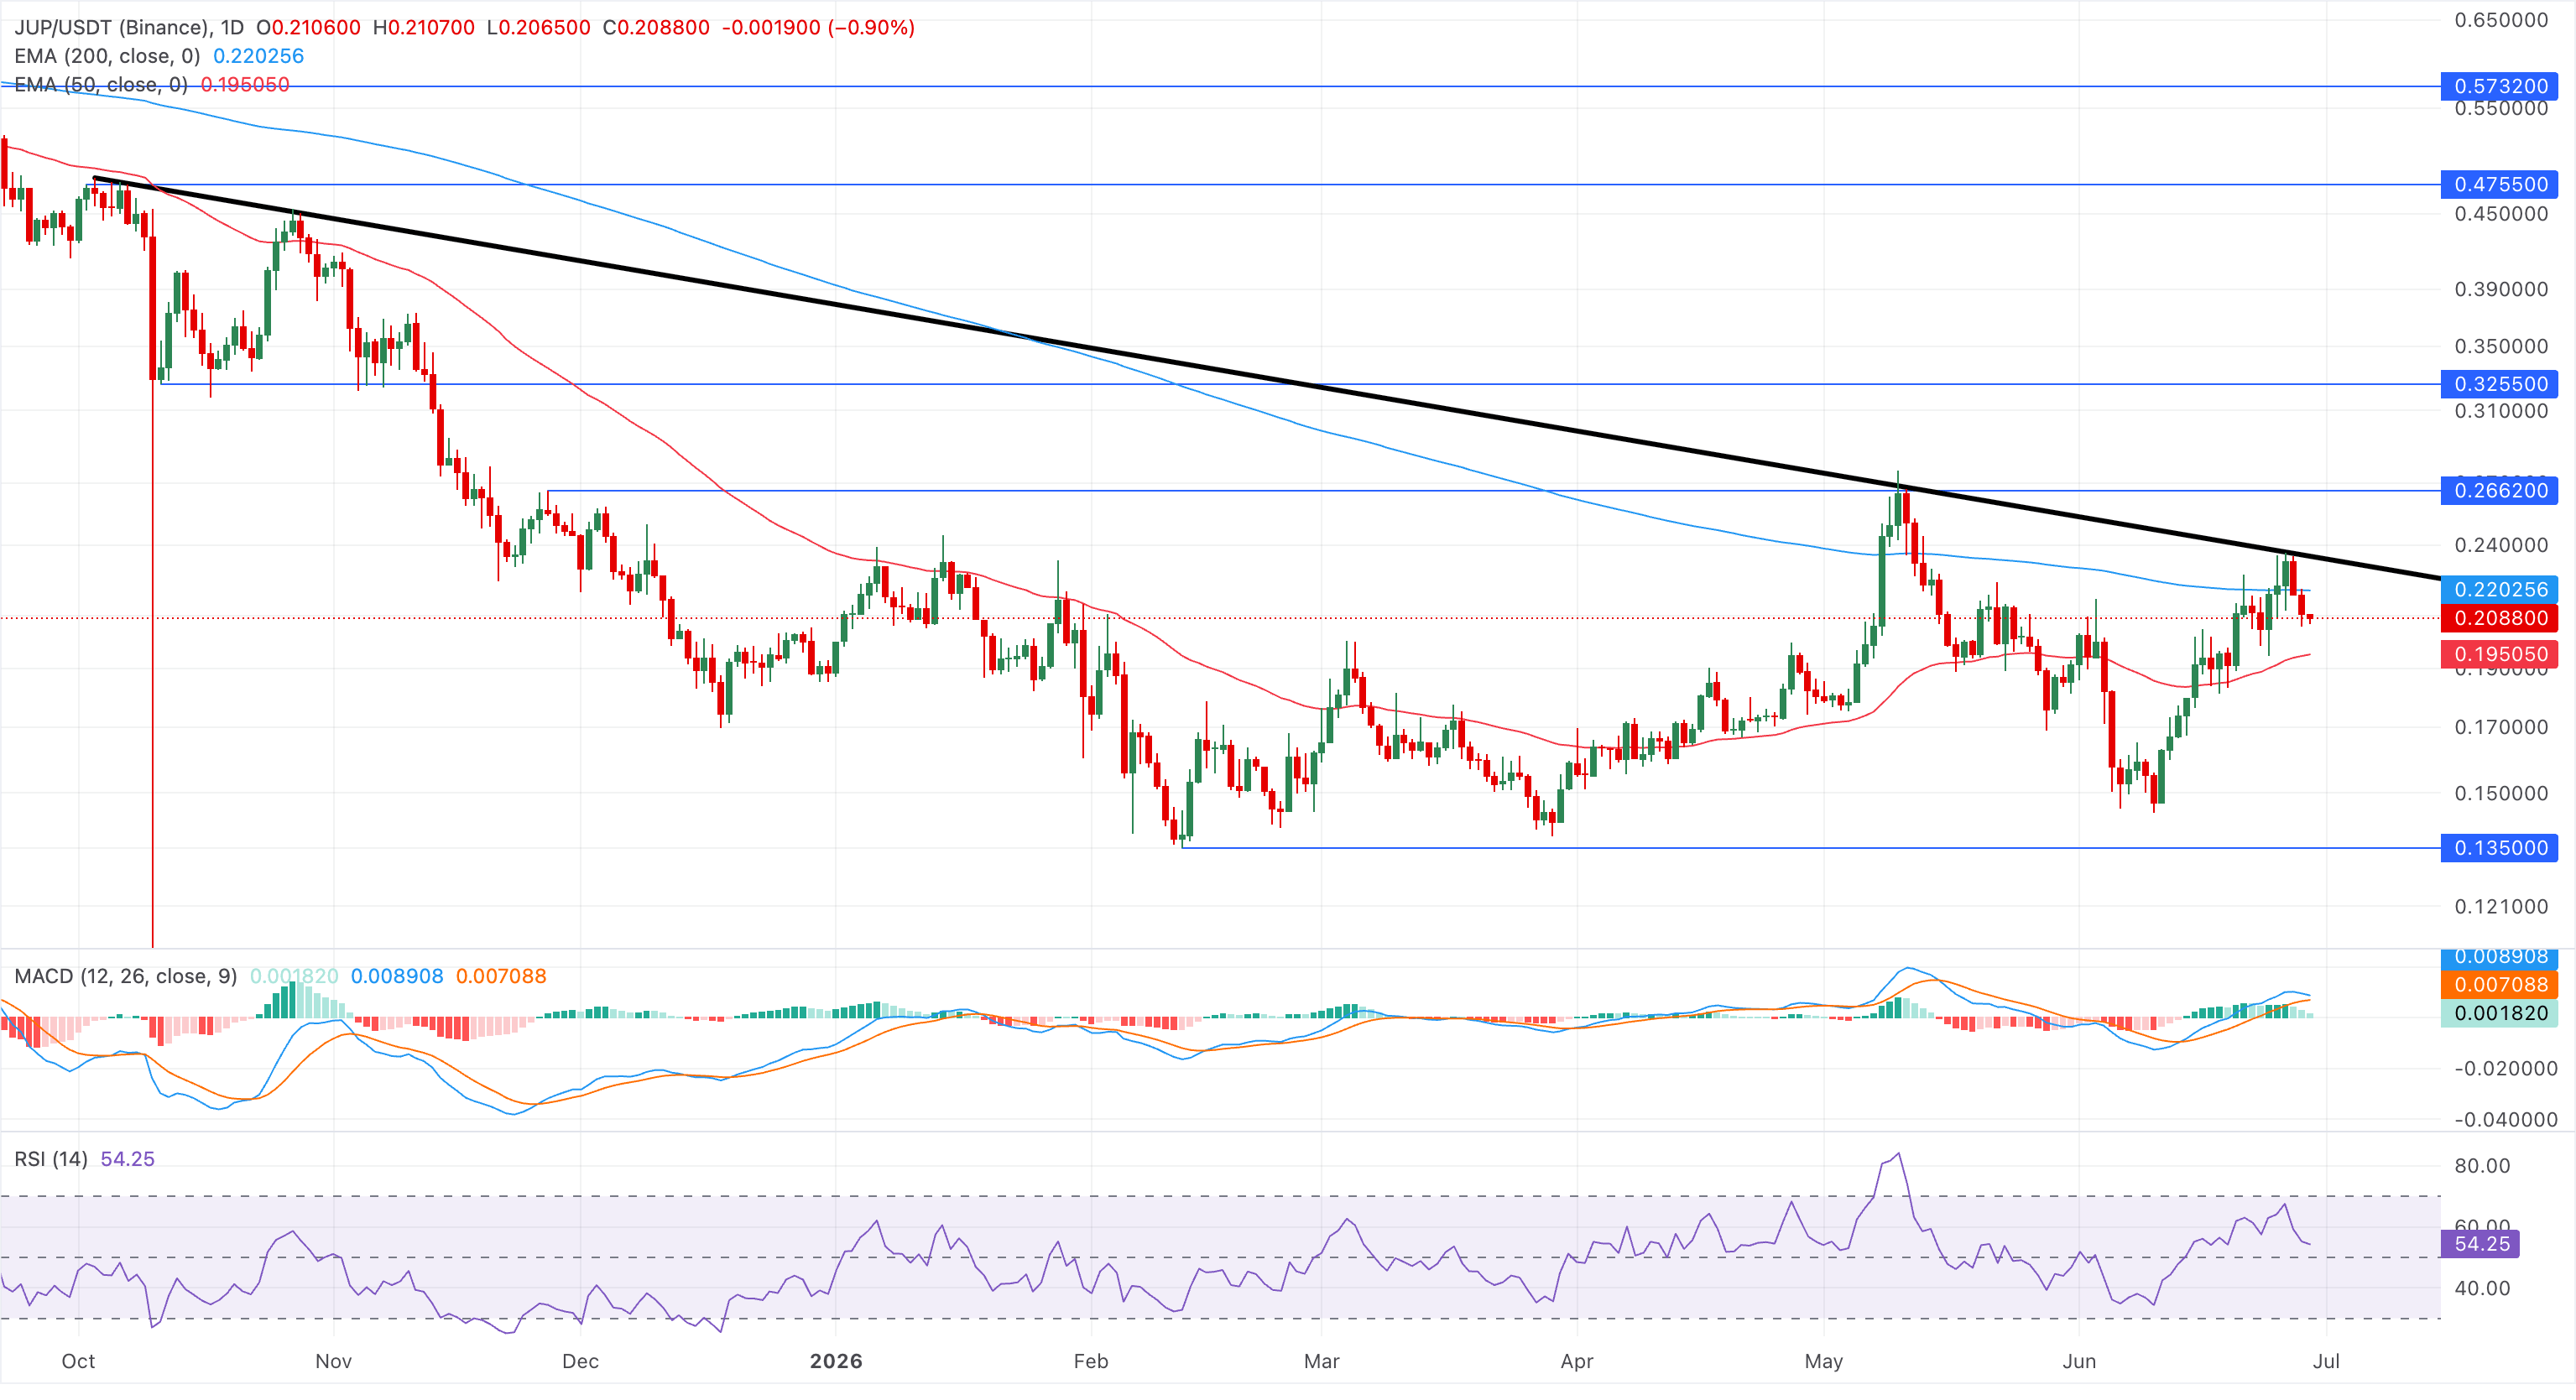
On the downside, initial support is seen at the 50-day EMA at $0.1950, and a daily close back below this level would weaken the current bullish tone and expose the pair to a deeper corrective phase.
(The technical analysis of this story was written with the help of an AI tool.)

يعتمد أكثر من مليون مستخدم على FXStreet للحصول على بيانات سوقية لحظية، وأدوات رسوم بيانية، ورؤى خبراء، وأخبار الفوركس. يساعد تقويمهم الاقتصادي الشامل والندوات التعليمية عبر الويب المتداولين على البقاء على اطلاع واتخاذ قرارات محسوبة. لدى FXStreet فريق يضم حوالي 60 محترفًا موزعين بين مقر برشلونة ومناطق عالمية مختلفة.
اقرأ المزيد


