
Crypto Overview: Bitcoin above $81,000 holds market sentiment steady – DeFi tokens rally
بواسطة Vishal Dixit
تم التحديث: 11 May 2026


المقالات الشائعة

Bitcoin (BTC) trades above $81,000 at press time on Monday amid US President Donald Trump’s rejection of the new Iran peace proposal. The broader crypto market sentiment remains neutral, while 24-hour liquidation data suggests a mild bullish bias.
- Bitcoin holds steady above $81,000 on Monday, struggling to surpass its 200-day EMA.
- Cryptocurrency market sentiment remains neutral amid the US rejection of the new Iran peace deal.
- DeFi tokens, including Sui and Uniswap, have emerged as top performers over the last 24 hours.
Bitcoin (BTC) trades above $81,000 at press time on Monday amid US President Donald Trump’s rejection of the new Iran peace proposal. The broader crypto market sentiment remains neutral, while 24-hour liquidation data suggests a mild bullish bias. Decentralized Finance (DeFi) tokens, including Sui (SUI) and Uniswap (UNI) are leading gains over the last 24 hours.
Market mood holds steady as US-Iran peace talks hit a new wall
Donald Trump has rejected Iran’s latest peace proposal to bring an end to the war in the Middle East, as Bloomberg reported on Sunday. The fragile ceasefire is dwindling, as Trump said the offer was “TOTALLY UNACCEPTABLE.”
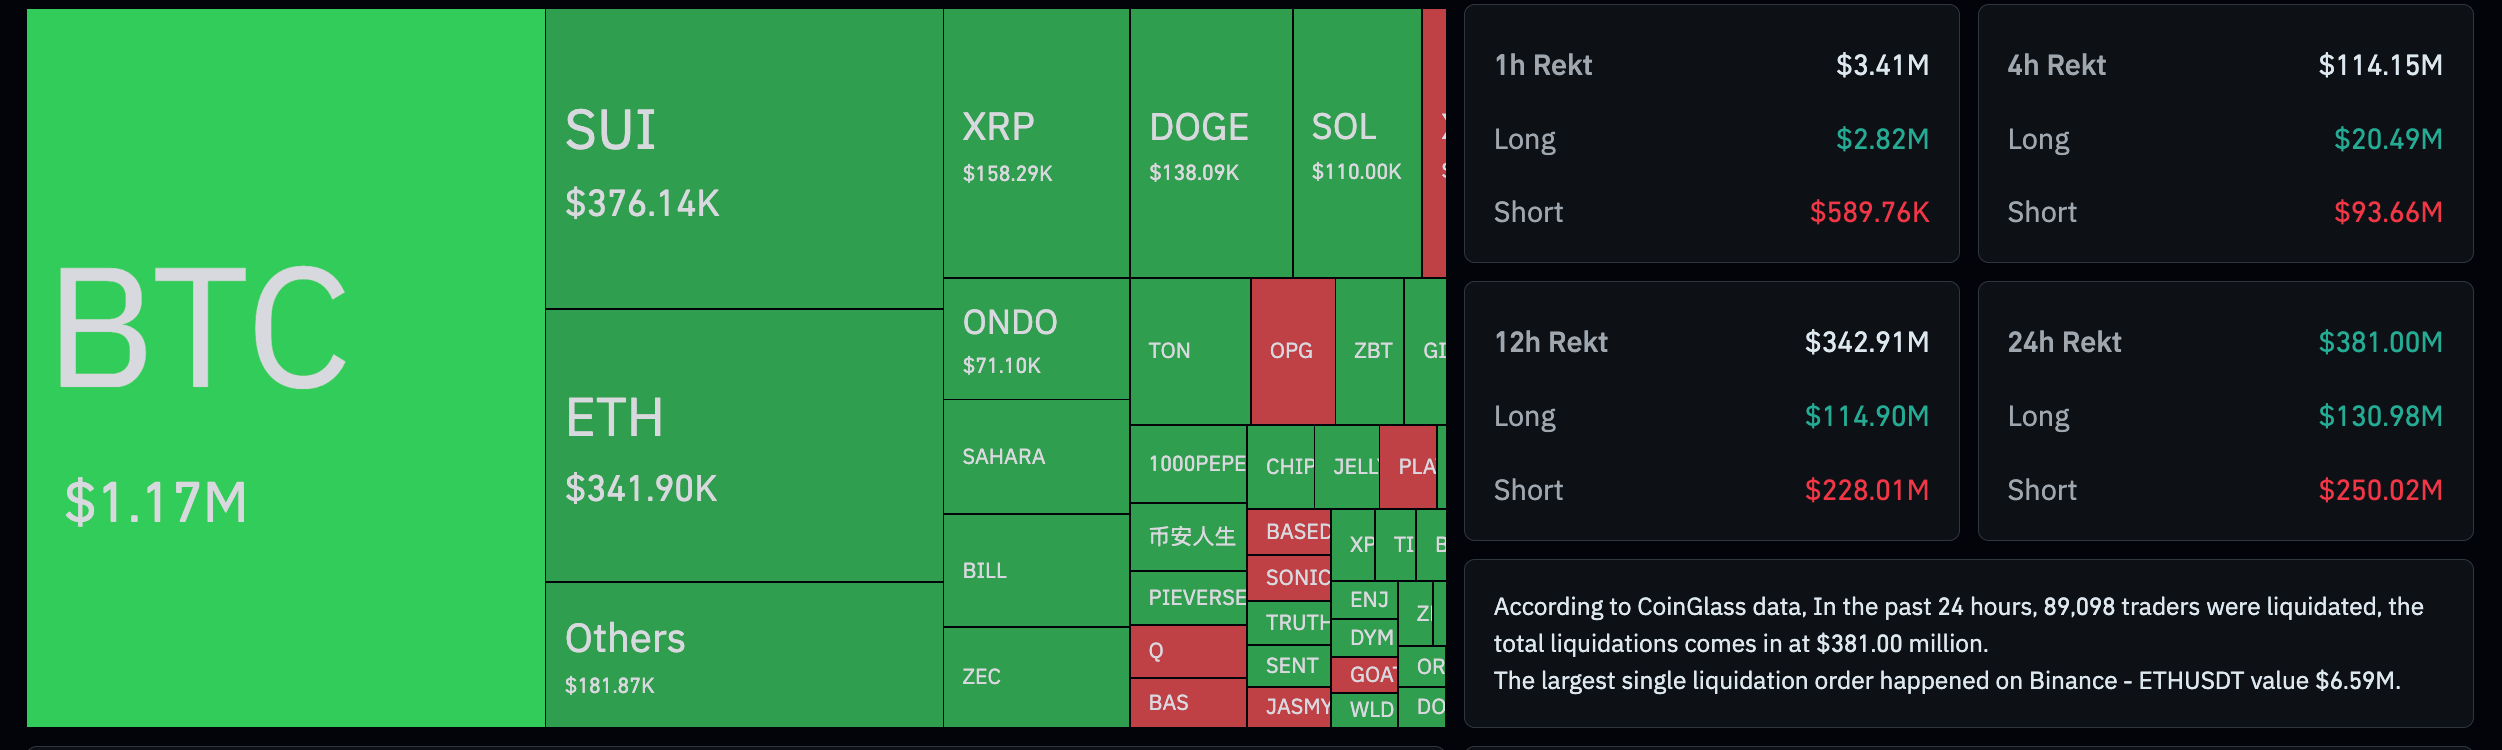
Derivatives data shows liquidations worth $386 million over the last 24 hours, led by $250 million of short liquidations, reflecting a mild bullish bias in the leverage market.
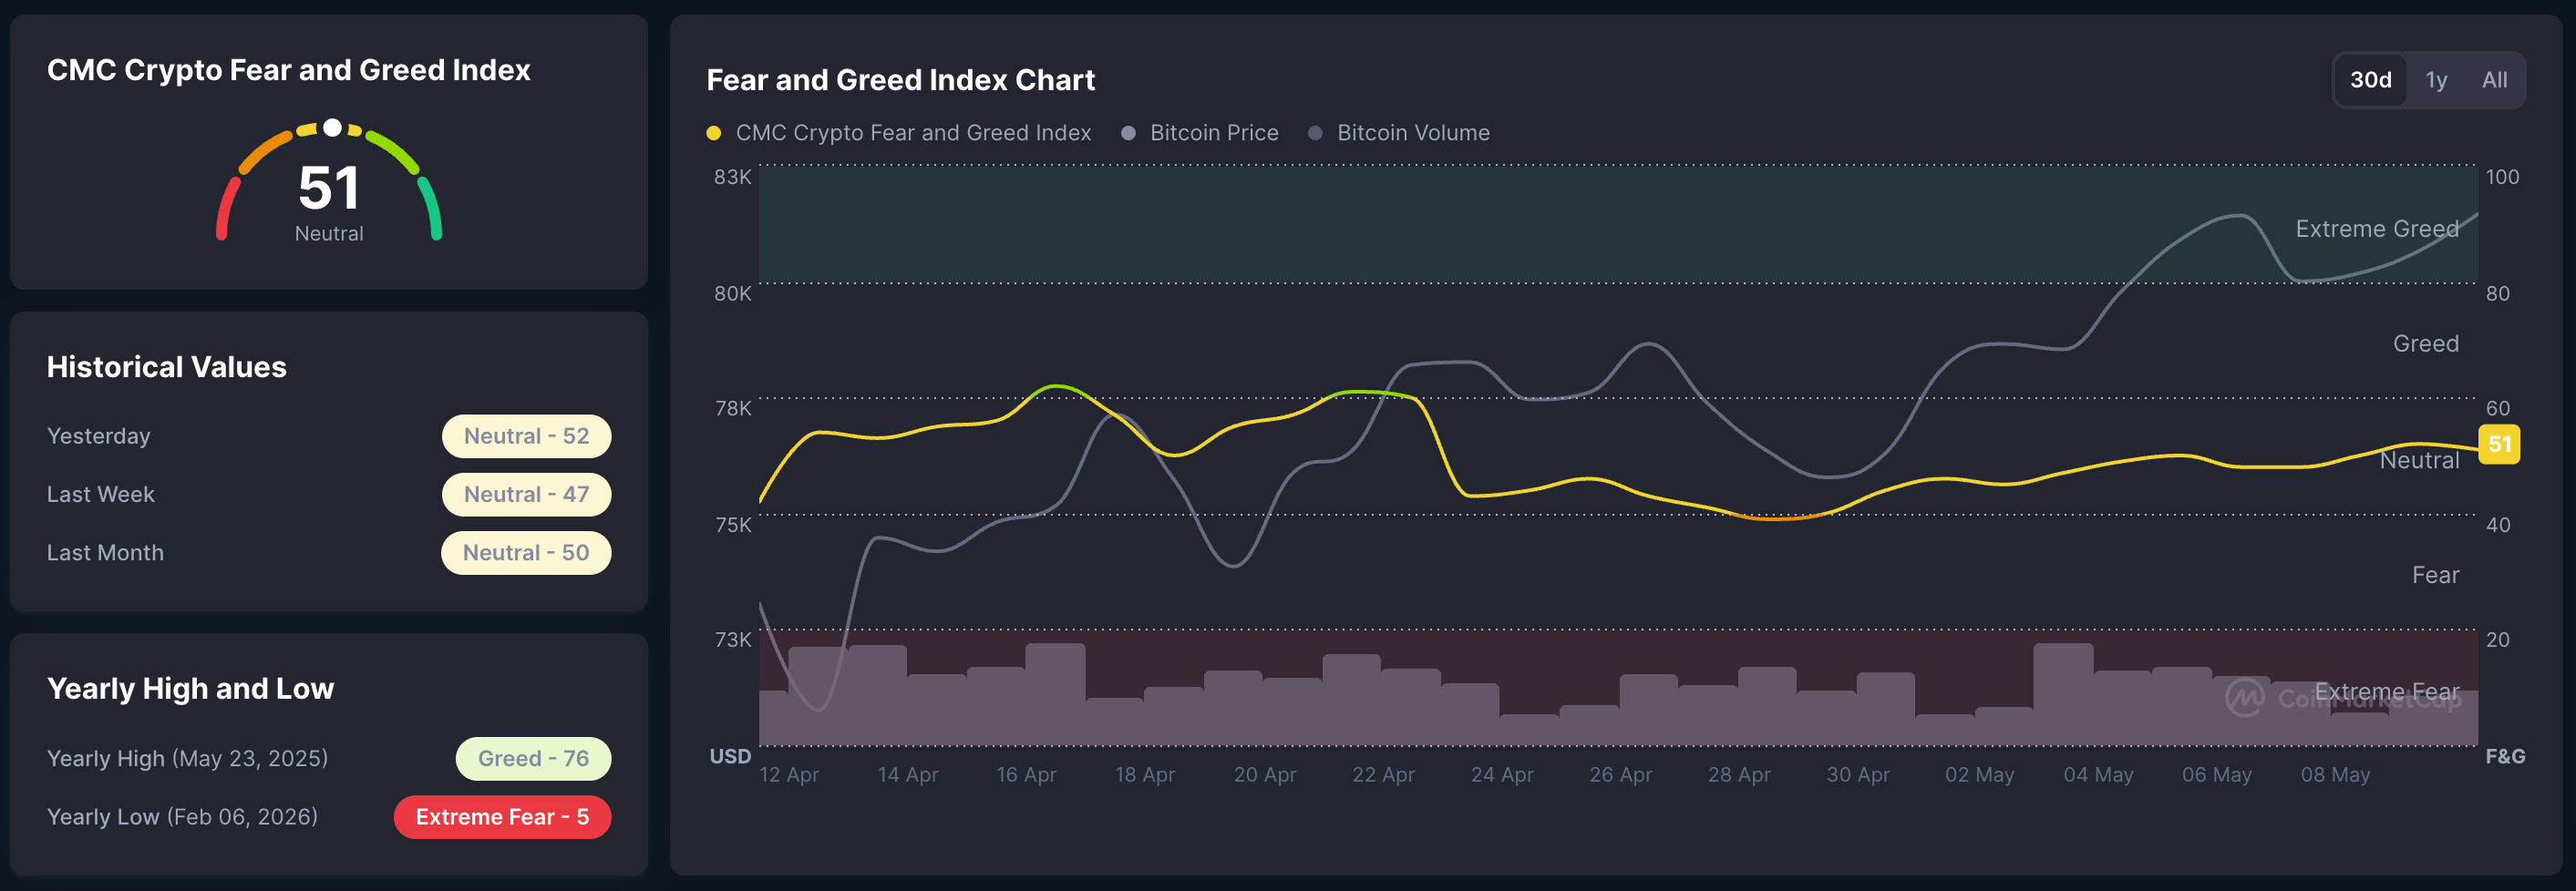
Amid relatively low liquidations, the Crypto Fear and Greed Index by CoinMarketCap stands at 51 on Monday and remains in the neutral region, reflecting a largely indecisive mood that could shift to either side.
Bitcoin recovery struggles near the 200-day EMA
Bitcoin trades at $81,262 at press time on Monday, maintaining a mild near-term bearish bias as the 200-day Exponential Moving Average (EMA) caps short-term recovery near $81,900. Still, the price holds well above the 50-day and 100-day EMAs, which are rising, suggesting a potential bullish crossover.
The rising uptrend support line from the $60,000 area continues to underpin the structure. The Relative Strength Index (RSI) at 63 on the daily chart indicates that bullish momentum persists, but the Moving Average Convergence Divergence (MACD) risks crossing below its signal line, suggesting an increase in selling pressure.
Looking up, immediate resistance is defined by the 200-day EMA at about $81,900. A decisive daily close above this barrier would open the door to further gains toward the $90,000 round figure.
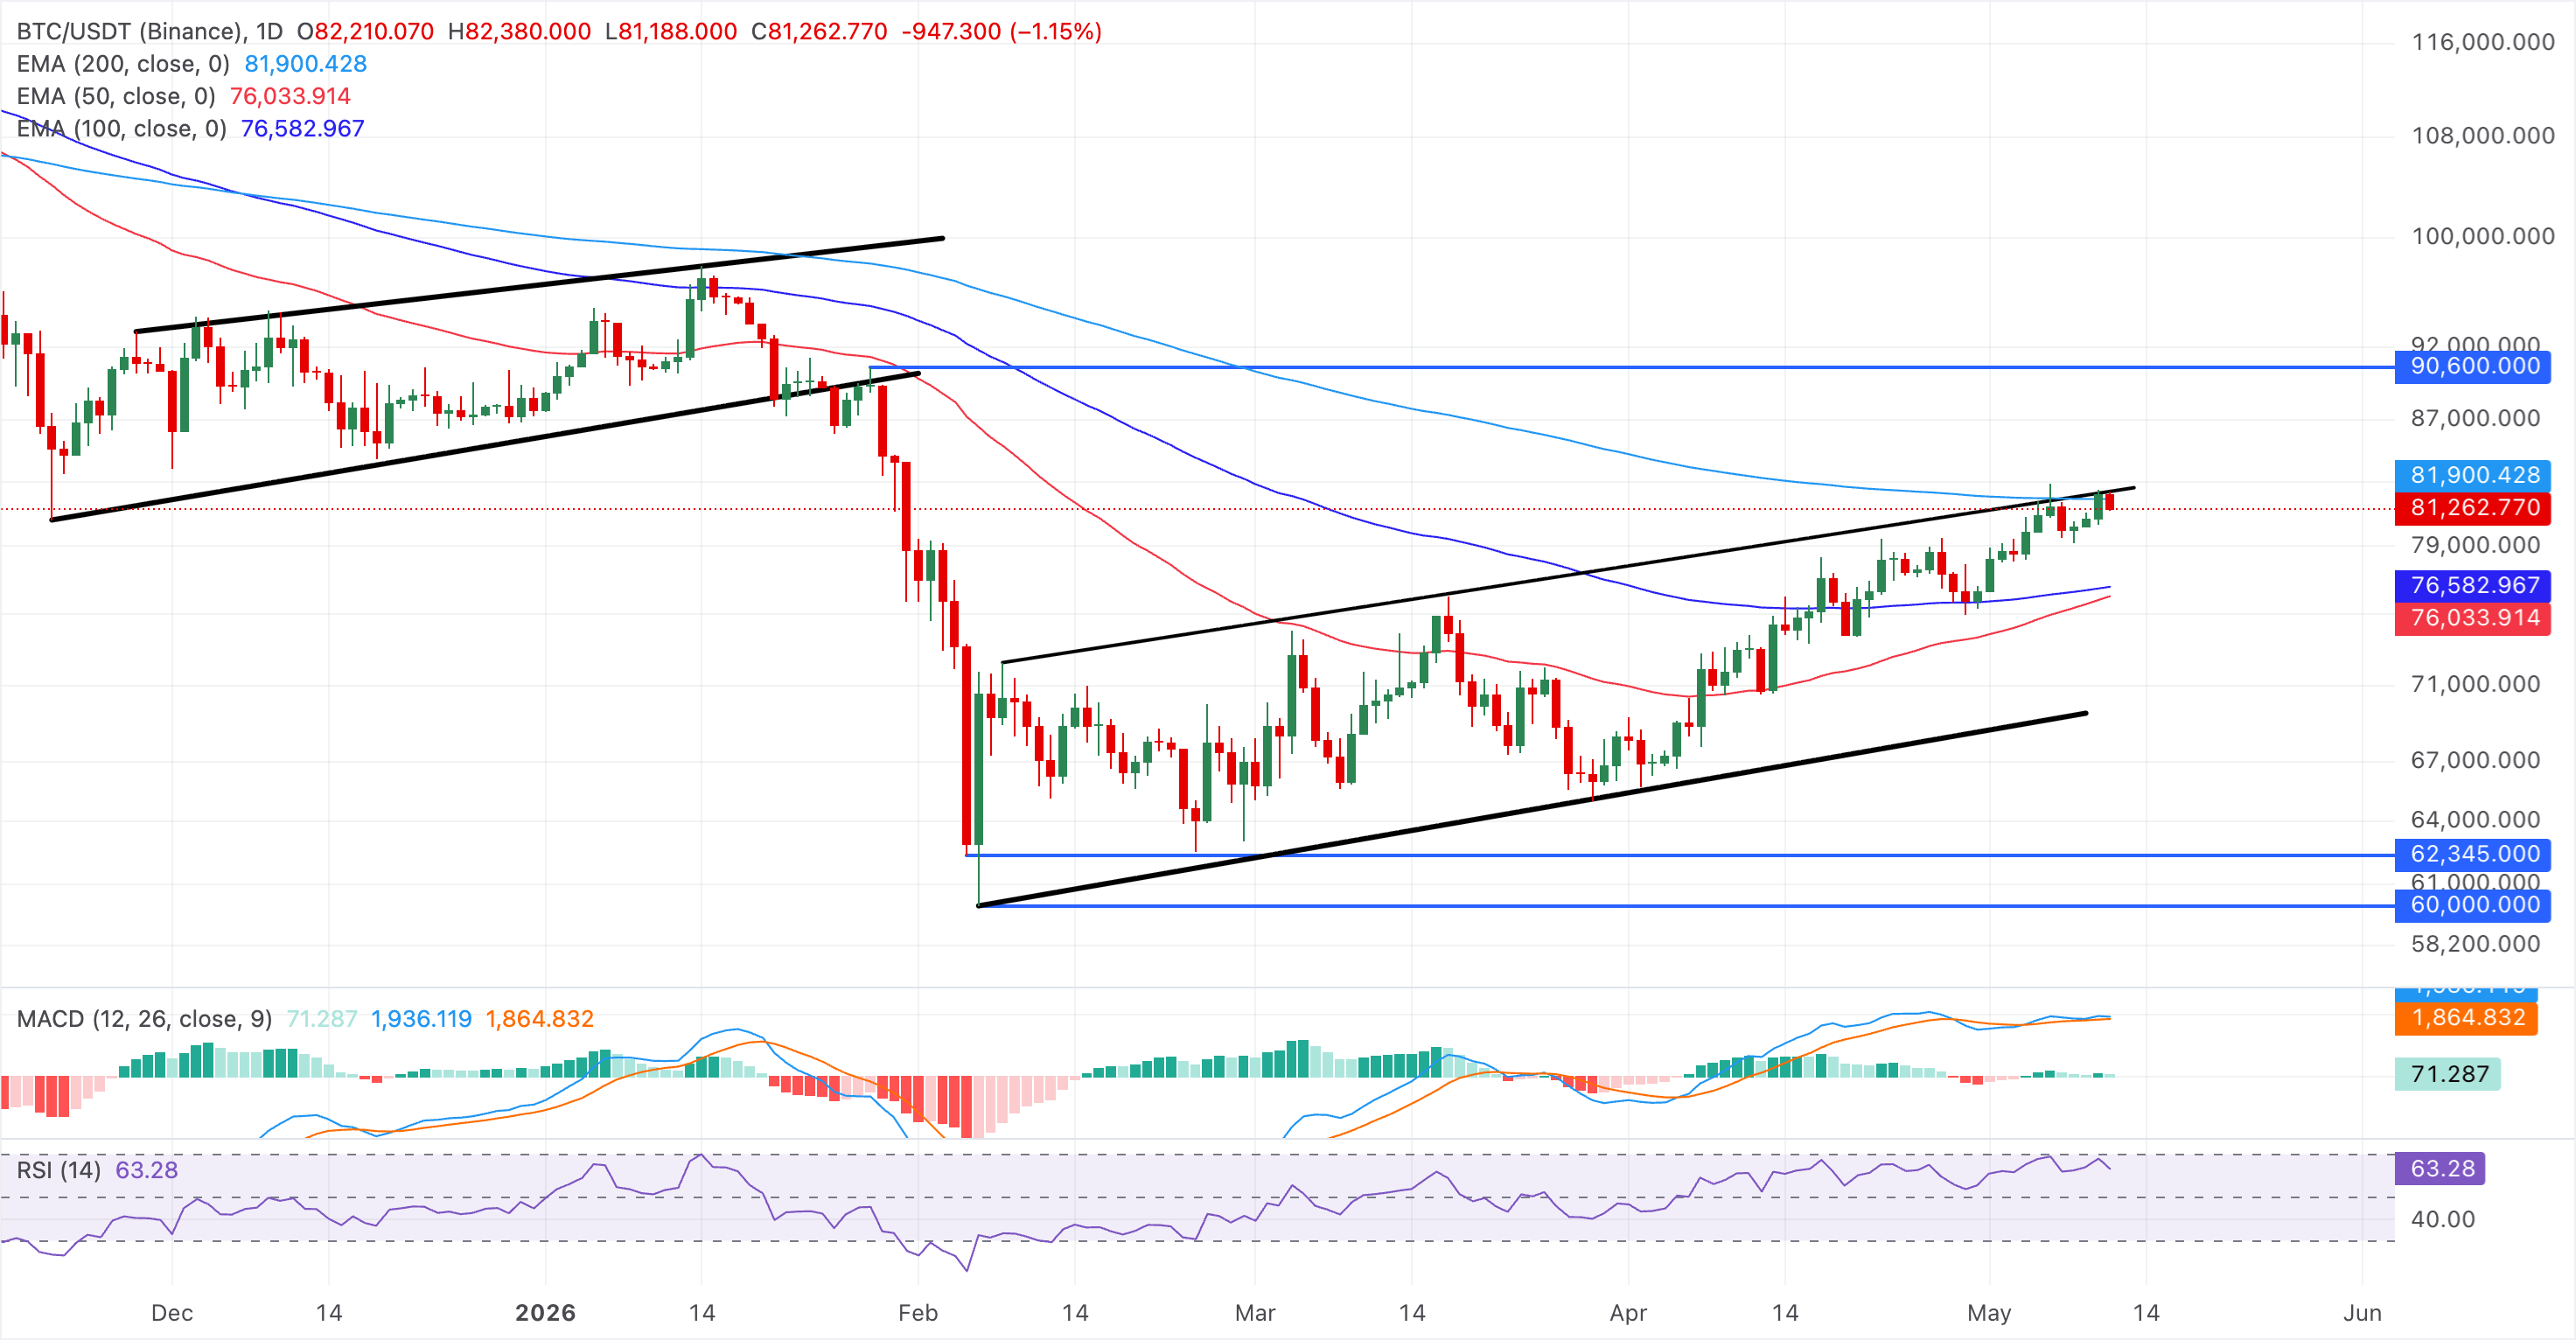
On the downside, initial demand is expected to emerge on dips toward the clustered 100-day and 50-day EMAs, now acting as layered support around $76,600 and $76,000, respectively, with the rising trend-line support near $69,700 reinforcing the broader bullish structure on deeper pullbacks.
Top Crypto Gainers: Will Sui and Uniswap extend gains?
Sui holds steady around $1.3241 at the time of writing on Monday after a 24% jump the previous day. Sui is holding a clear bullish near-term bias as price remains above both the 50-day and 100-day EMAs at $0.9874 and $1.0790, respectively, and comfortably above the former downtrend break near $1.1459.
The RSI at 83 signals overbought conditions, while the MACD histogram bars expand above the zero line, which suggests strong but potentially stretched upside momentum.
On the topside, the primary obstacle is the 200-day EMA at $1.4420, which acts as the next significant resistance and could cap gains if buyers lose momentum.
Looking down, initial support is seen at the prior trend-line break region around $1.1459, ahead of the 100-day EMA at $1.0790, with the 50-day EMA at $0.9874 reinforcing a deeper demand zone should a corrective pullback unfold from overbought territory.
Uniswap hovers slightly below $4.00 at press time on Monday, keeping a constructive near-term bias as price holds above the 50-day and 100-day EMAs at $3.46 and $3.79, respectively. This positioning suggests dip-buying interest persists despite the broader downtrend defined by the 200-day EMA, while the RSI at 76 hovers deep in overbought territory, hinting that upside momentum is strong but increasingly stretched.
Initial resistance is located at the 200-day EMA near $4.54. A sustained break above this moving average would open the way to the 50% retracement at roughly $5.41, measured from the downswing from $10.30 to $2.84.
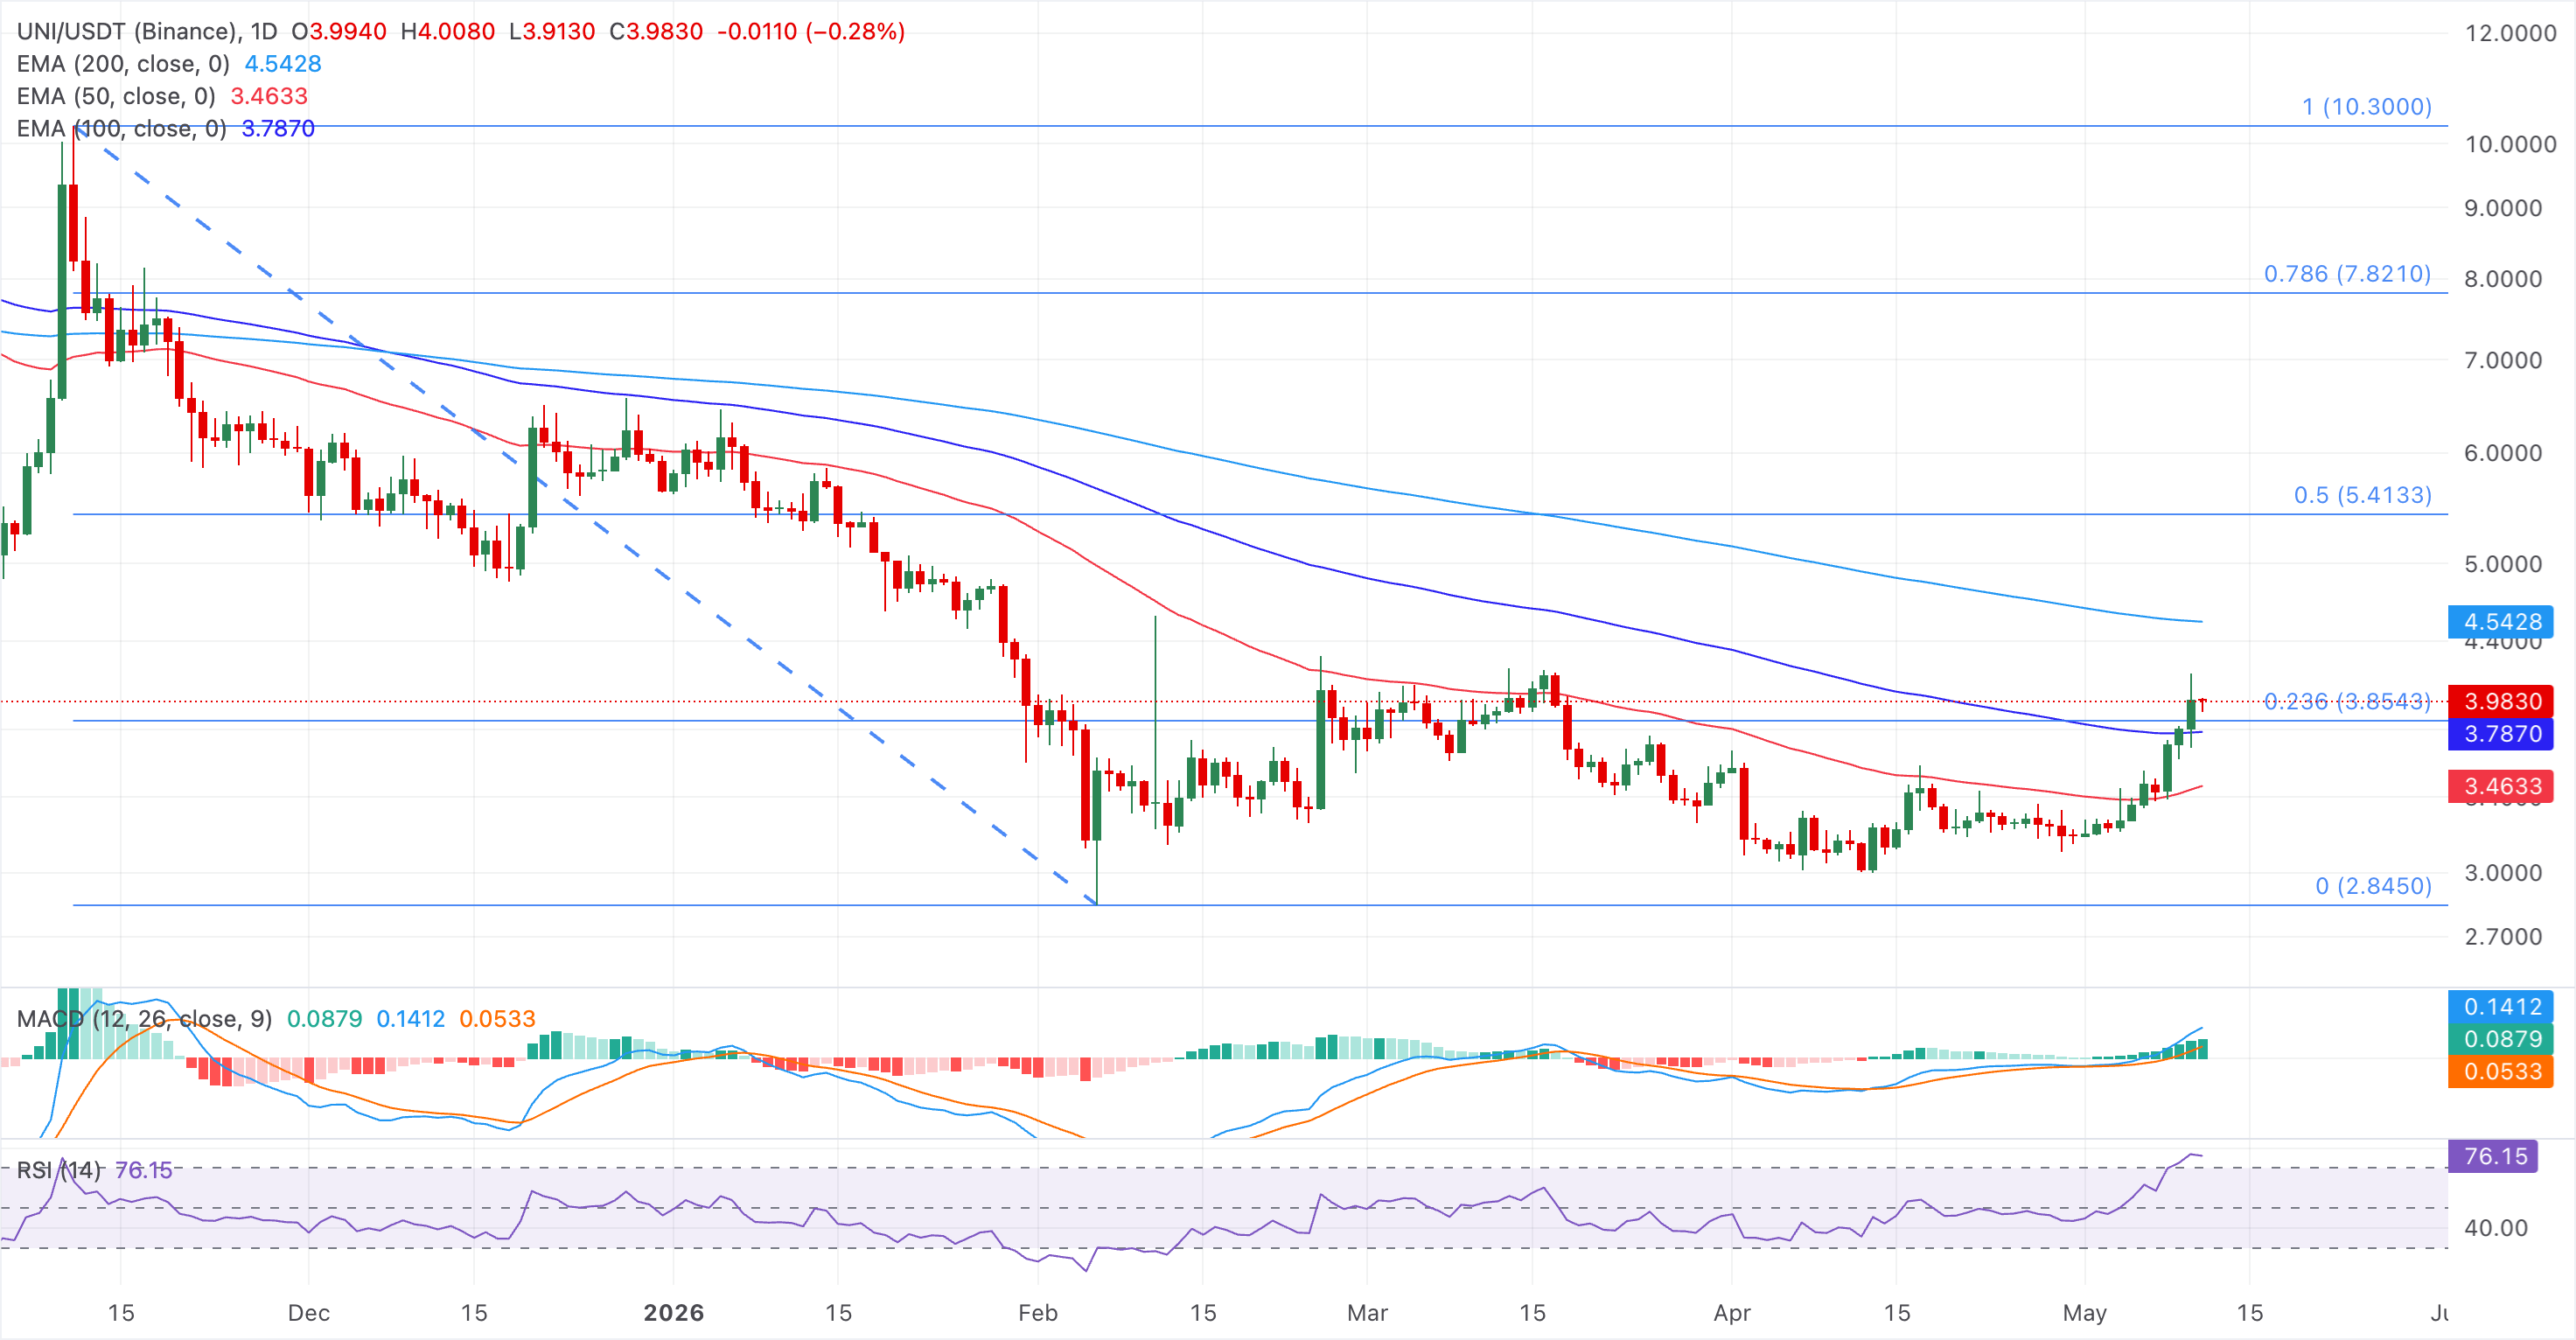
Immediate support is seen at the 100-day EMA around $3.79, ahead of the 50-day EMA near $3.46, where a deeper pullback could find buyers before the broader bullish correction is questioned.
(The technical analysis of this story was written with the help of an AI tool.)

يعتمد أكثر من مليون مستخدم على FXStreet للحصول على بيانات سوقية لحظية، وأدوات رسوم بيانية، ورؤى خبراء، وأخبار الفوركس. يساعد تقويمهم الاقتصادي الشامل والندوات التعليمية عبر الويب المتداولين على البقاء على اطلاع واتخاذ قرارات محسوبة. لدى FXStreet فريق يضم حوالي 60 محترفًا موزعين بين مقر برشلونة ومناطق عالمية مختلفة.
اقرأ المزيد


