
Crypto Overview: Bullish sentiment wanes as Bitcoin loses $77,000 – H, PUMP, TAO maintain lead
بواسطة Vishal Dixit
تم التحديث: 29 Apr 2026


المقالات الشائعة

The broader cryptocurrency market is losing its risk-on sentiment as Bitcoin (BTC) trades below $77,000 at press time on Wednesday. A drop in BTC futures Open Interest reflects weakness in the leverage market.
- Bitcoin slips below $77,000 on Wednesday, weighing down the broader market risk-on sentiment.
- Derivatives market activity dips, reflecting hesitant traders moving to the sidelines.
- Humanity Protocol, Pump.fun, and Bittensor maintain the lead over the last 24 hours.
The broader cryptocurrency market is losing its risk-on sentiment as Bitcoin (BTC) trades below $77,000 at press time on Wednesday. A drop in BTC futures Open Interest reflects weakness in the leverage market. Still, Humanity Protocol (H), Pump.fun (PUMP), and Bittensor (TAO) maintain the lead over the last 24 hours.
Crypto market sentiment weakens
Bitcoin slipped below $77,000 after two consecutive days of losses earlier this week, reflecting weakness in the broader market sentiment. CoinMarketCap’s Fear and Greed Index at 41 shows waning risk-on sentiment among investors, which could flash increased fear if it drops below 40.
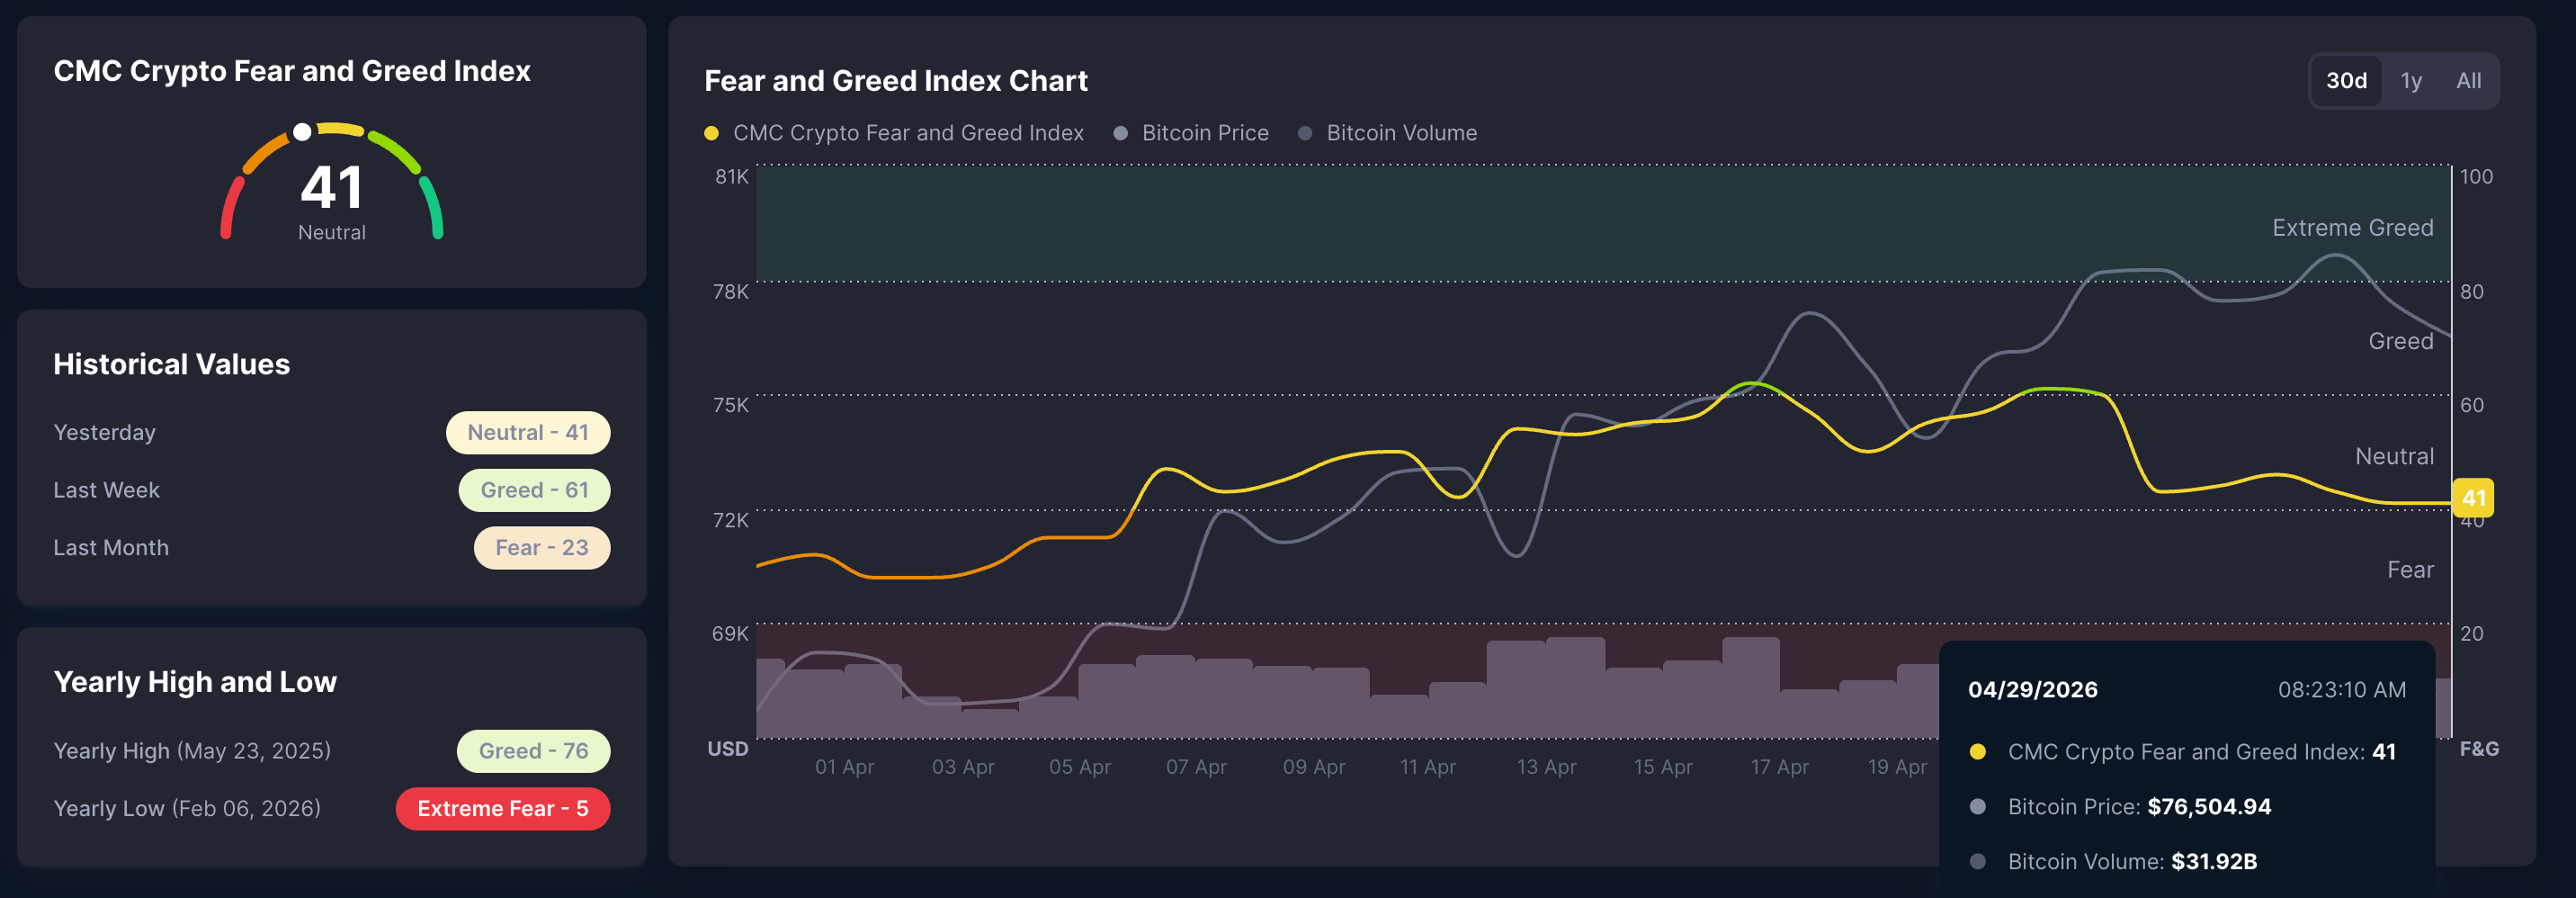
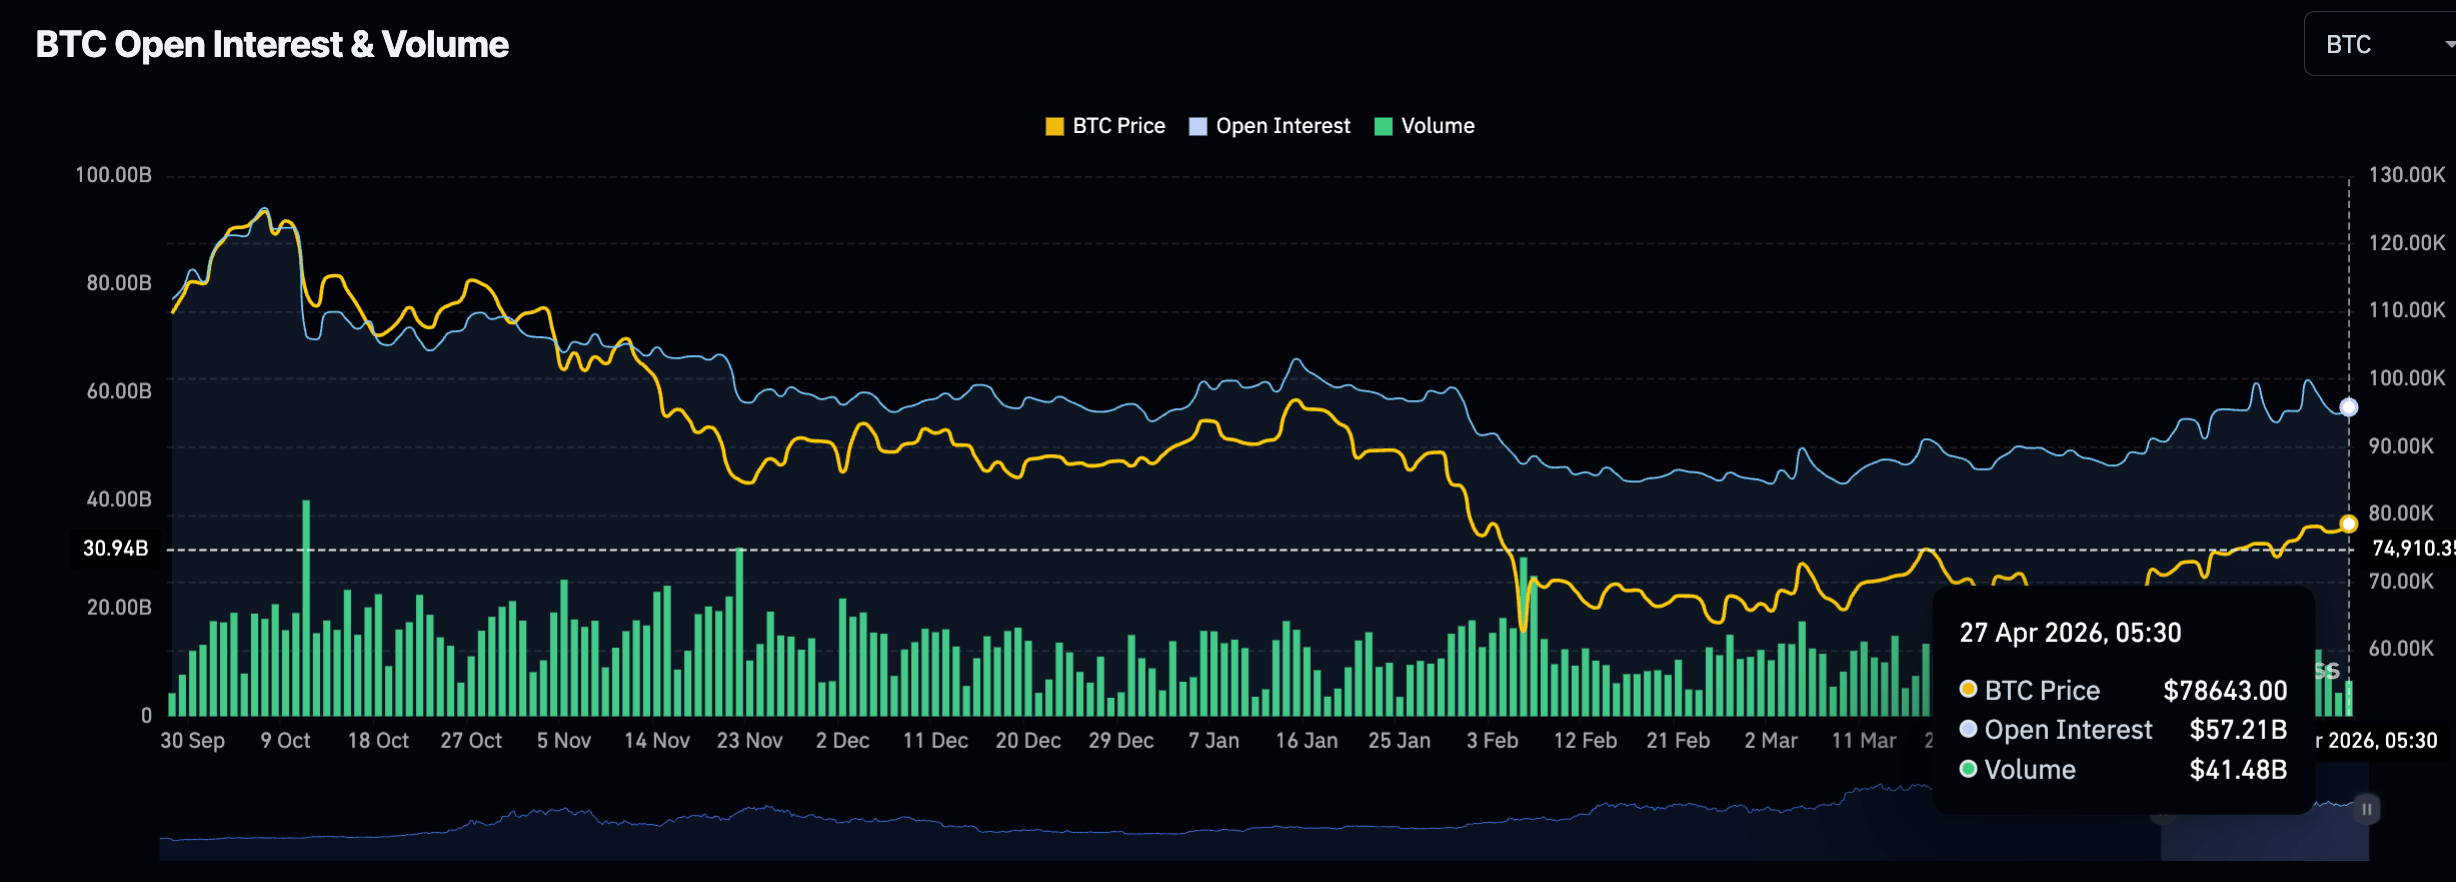
On the derivatives side, Bitcoin futures Open Interest (OI) is down to $57.21 billion, from $62.27 billion on Thursday. This reflects a drop in the positional buildup as traders either close setups or reduce leverage.
Technical outlook: Will Humanity Protocol, Pump.fun, and Bittensor sustain their lead?
Humanity Protocol maintains a constructive bullish bias, holding above its 50-day Exponential Moving Average (EMA) at $0.1202 and above the 50% Fibonacci retracement at $0.1642, measured over the $0.2511 to $0.0773 downswing.
The Relative Strength Index (14) hovers at 69, flirting with overbought territory, while the Moving Average Convergence Divergence (MACD) and its signal line rise, with a positive, slightly expanding histogram, suggesting persistent upward momentum but also warning that the rally may be getting stretched in the short term.
On the topside, immediate resistance emerges at the 61.8% Fibonacci retracement around $0.1847, with further bullish objectives at the 78.6% retracement near $0.2139 and then the swing high region around $0.2511.
Initial support is seen at the 50% retracement level of $0.1642, reinforced lower by the 38.2% retracement at $0.1437, while deeper pullbacks would look to the 50-day EMA at $0.1202.
Pump.fun holds steady above its 50-day EMA at $0.001865 at press time on Wednesday, following a 7% jump the previous day. The recovery aligns with the decision to burn 36% of the circulating supply and to implement a 50% buyback program, as previously reported by FXStreet.
Momentum is mildly constructive, with the RSI at 53 hovering just above the midline and the MACD rising above its signal line near the zero mark, which together hint that downside pressure has eased but that bulls still lack a decisive breakout.
Initial resistance emerges at the downward-sloping trendline near $0.0020, where prior rallies have struggled, and a daily close above this barrier would be needed to open the door to a more sustained recovery toward the R2 Pivot Point at $0.002417.
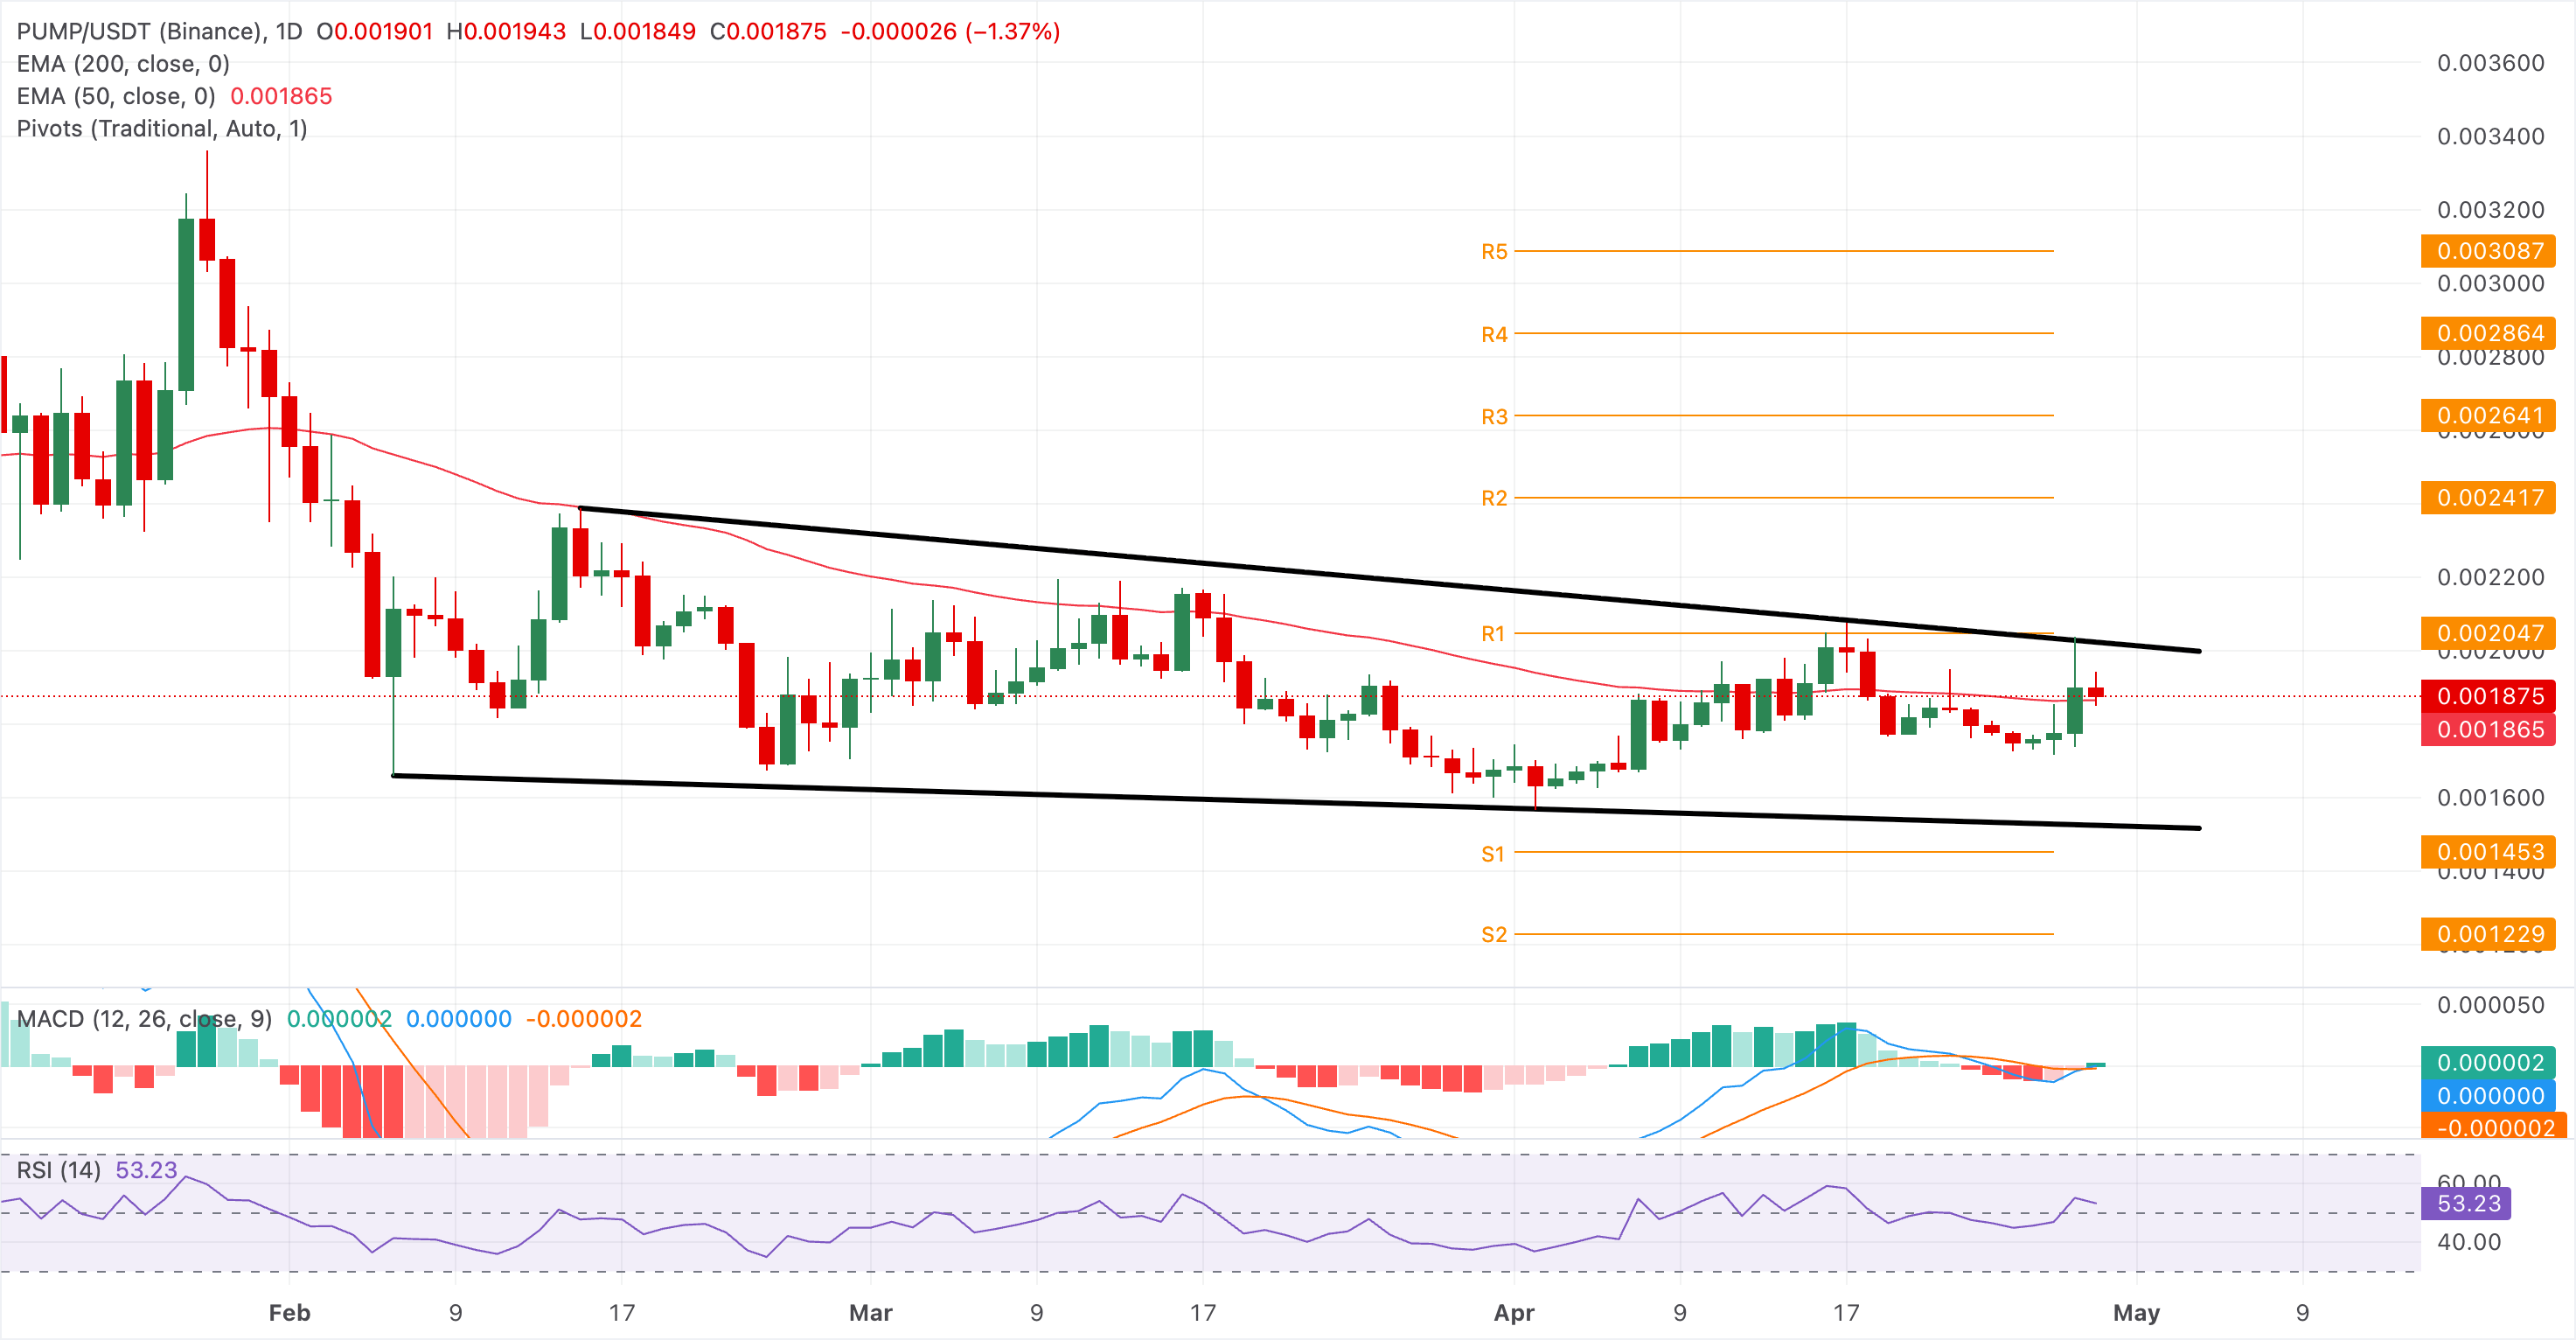
On the downside, the declining support trendline close to $0.001500 could serve as the immediate support level, where buyers could reattempt a rebound.
Bittensor extends gains at the time of writing on Wednesday, holding a neutral-to-slightly-bullish stance as it sits above the 50-day EMA at roughly $259 but remains capped under the 200-day EMA near $269. The initial resistance emerges at the 200-day EMA around $269, with further supply expected near $300.
The RSI at 50 hovers around the neutral area, while the MACD has crossed above its signal line, hinting that upside momentum is stabilizing, but the downside pressure persists overhead.
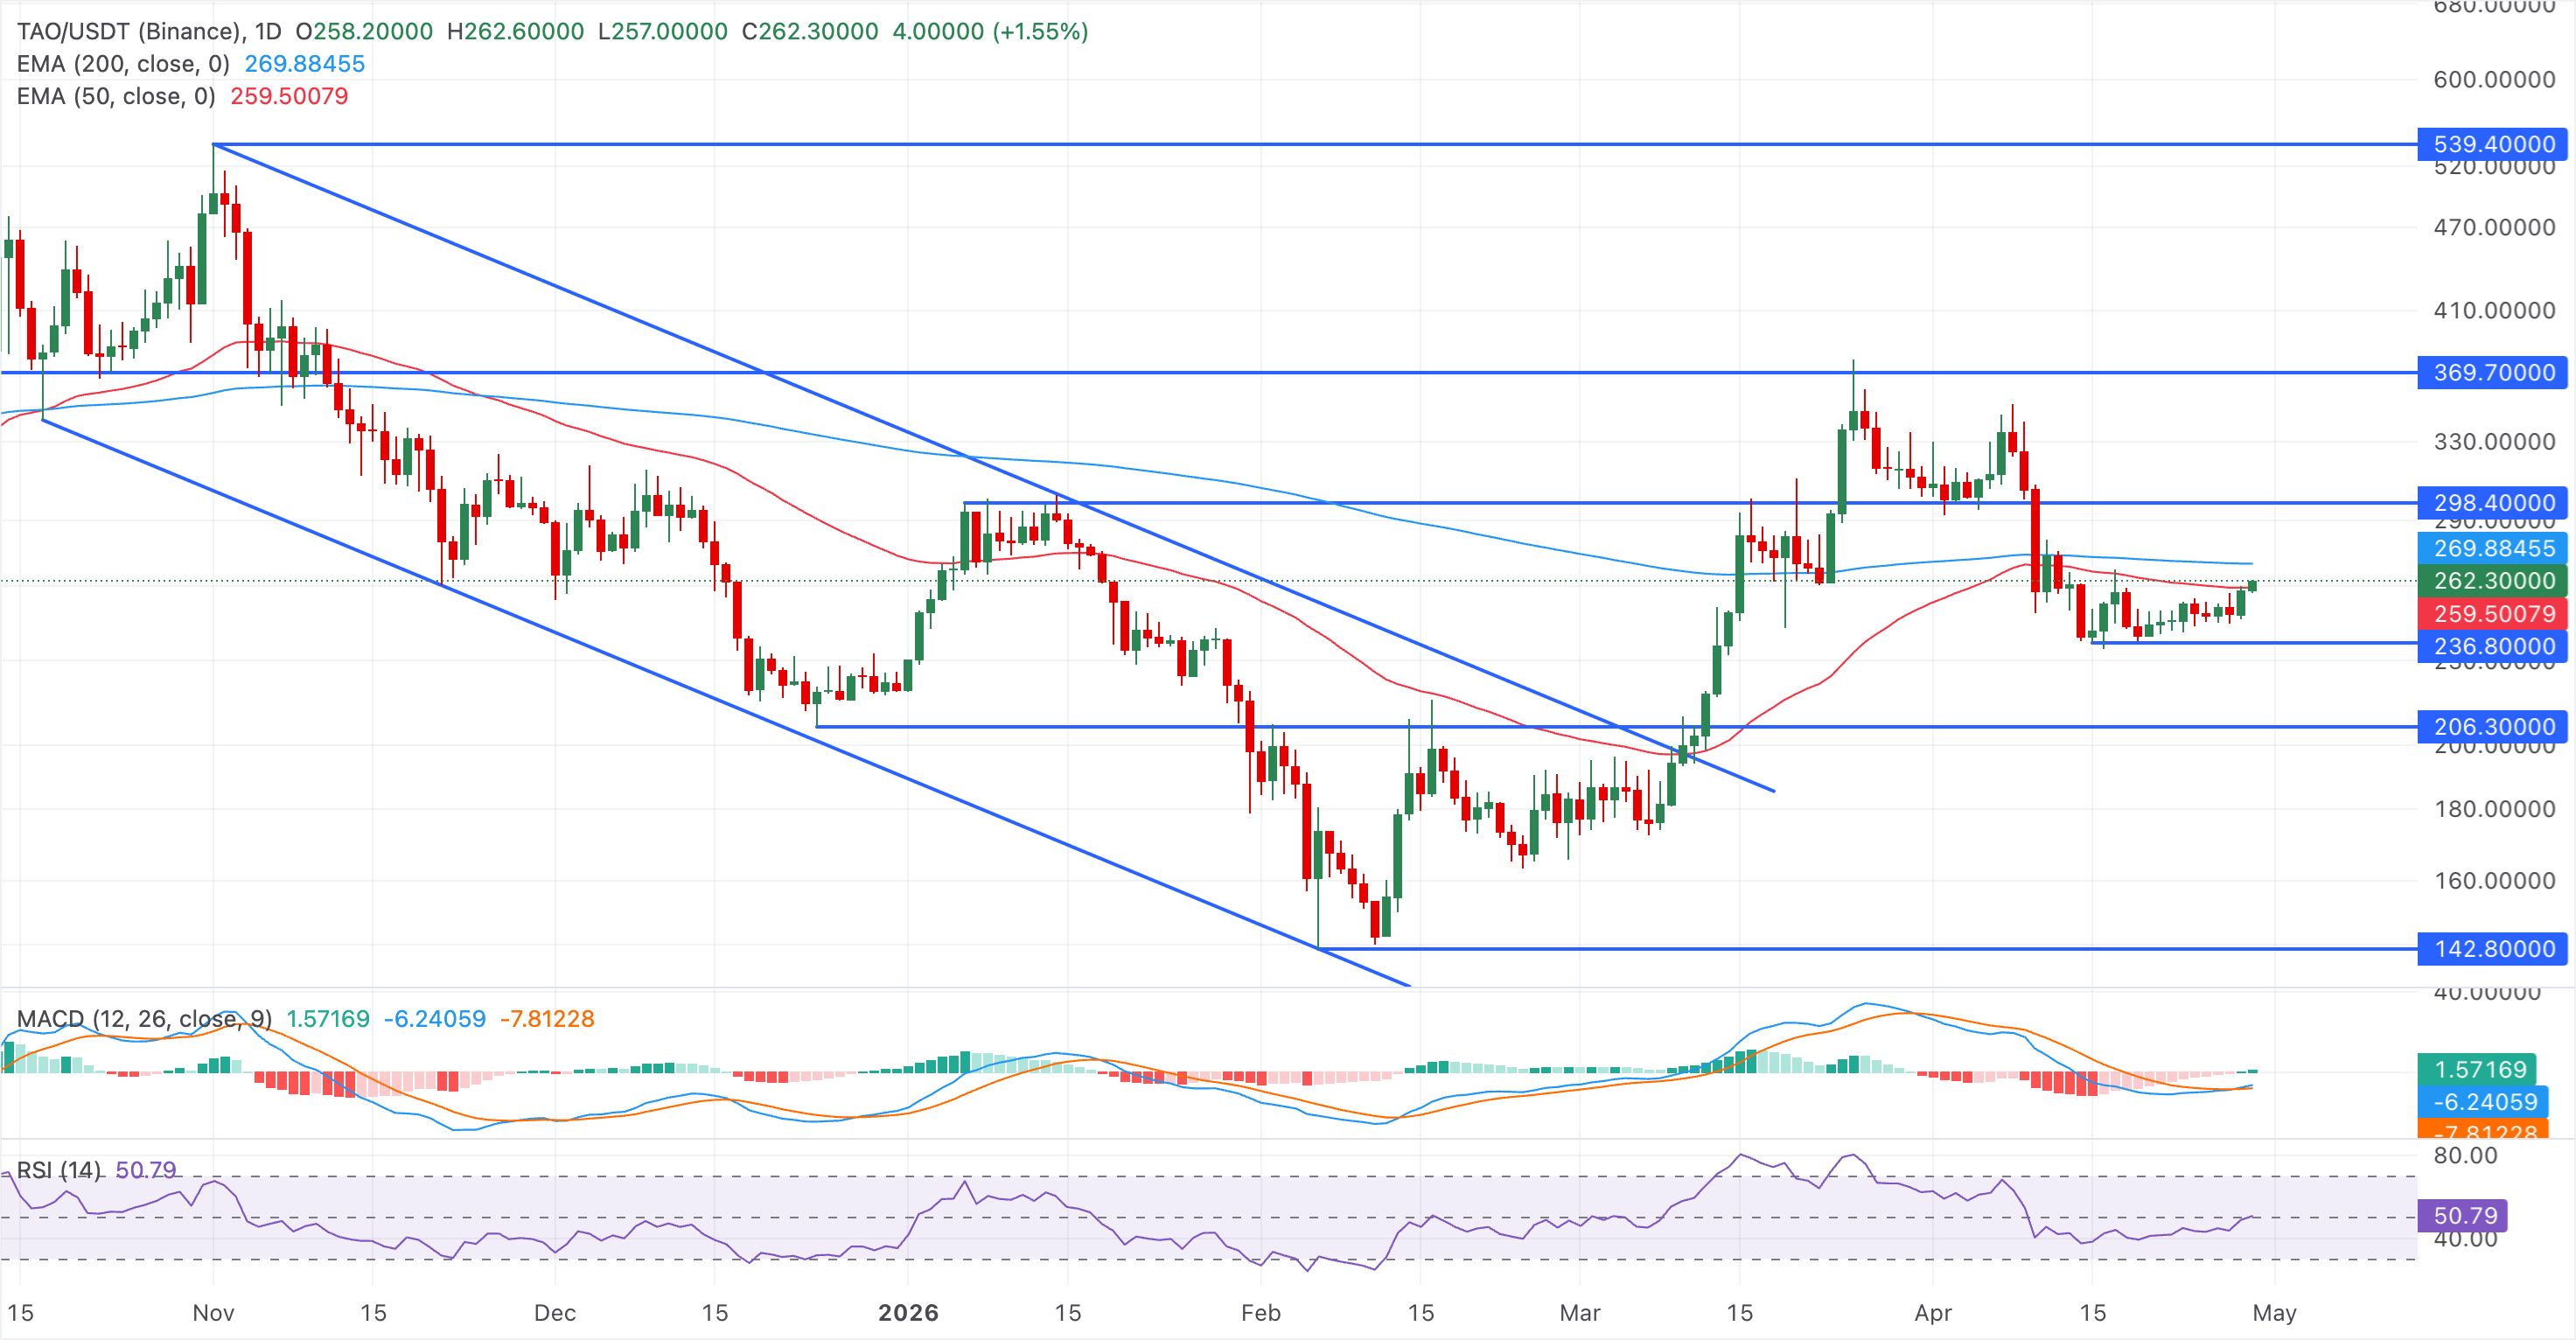
The $236 short-term support floor could absorb a reversal. However, a clear break below this floor would expose a deeper pullback toward $200.
(The technical analysis of this story was written with the help of an AI tool.)

يعتمد أكثر من مليون مستخدم على FXStreet للحصول على بيانات سوقية لحظية، وأدوات رسوم بيانية، ورؤى خبراء، وأخبار الفوركس. يساعد تقويمهم الاقتصادي الشامل والندوات التعليمية عبر الويب المتداولين على البقاء على اطلاع واتخاذ قرارات محسوبة. لدى FXStreet فريق يضم حوالي 60 محترفًا موزعين بين مقر برشلونة ومناطق عالمية مختلفة.
اقرأ المزيد


