
Crypto Today: Bitcoin, Ethereum, XRP edge higher as selling cools, retail demand steadies
بواسطة John Isige
تم التحديث: 4 May 2026


المقالات الشائعة

Bitcoin (BTC) is trading near the pivotal $80,000 threshold, rising alongside major altcoins including Ethereum (ETH) and Ripple (XRP) at the time of writing on Monday. Ethereum holds above $2,350, upholding a five-day bullish streak, while XRP has reclaimed support above $1.40.
- Bitcoin trades near $80,000, signaling a potential bullish turnaround supported by rising futures Open Interest.
- Ethereum rises for the fifth consecutive day amid growing demand for derivatives.
- XRP reclaims the 50-day EMA as support, increasing the odds of a potential range breakout.
Bitcoin (BTC) is trading near the pivotal $80,000 threshold, rising alongside major altcoins including Ethereum (ETH) and Ripple (XRP) at the time of writing on Monday. Ethereum holds above $2,350, upholding a five-day bullish streak, while XRP has reclaimed support above $1.40.
Derivatives expand amid improving risk appetite
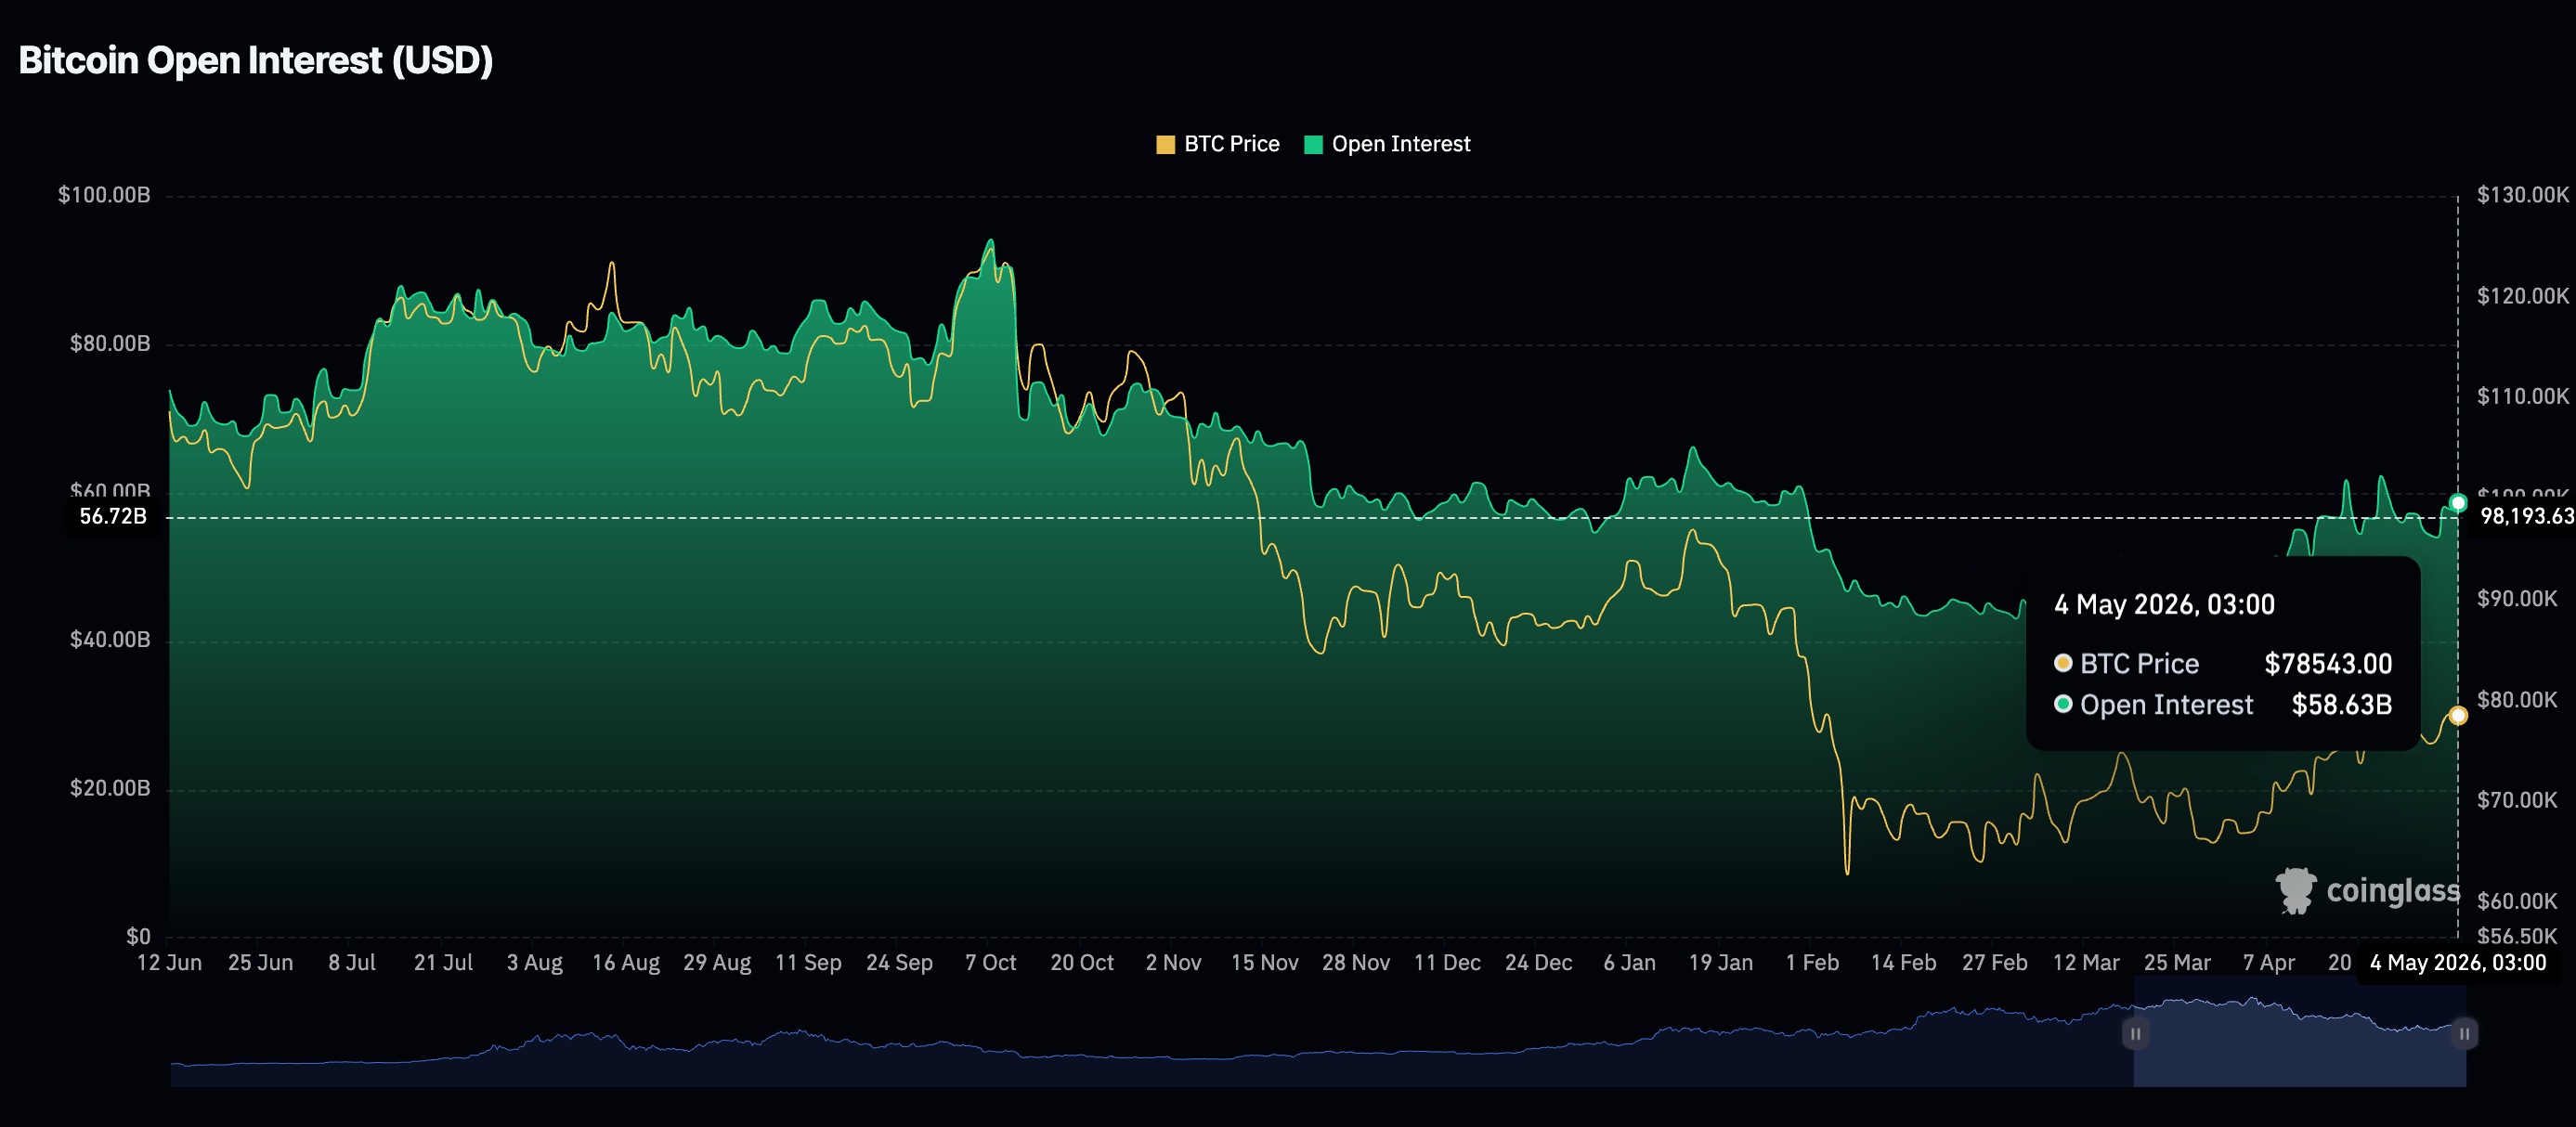
Bitcoin is showing notable signs of recovery as capital inflows through derivatives stabilize, as reflected by perpetual futures Open Interest (OI) rising to $58.63 billion on Monday, from $57.74 billion the previous day and $53.96 billion on Friday. If the appetite for derivatives remains robust, Bitcoin’s upward trajectory and prospects for a breakout above the $80,000 resistance appear well-supported.
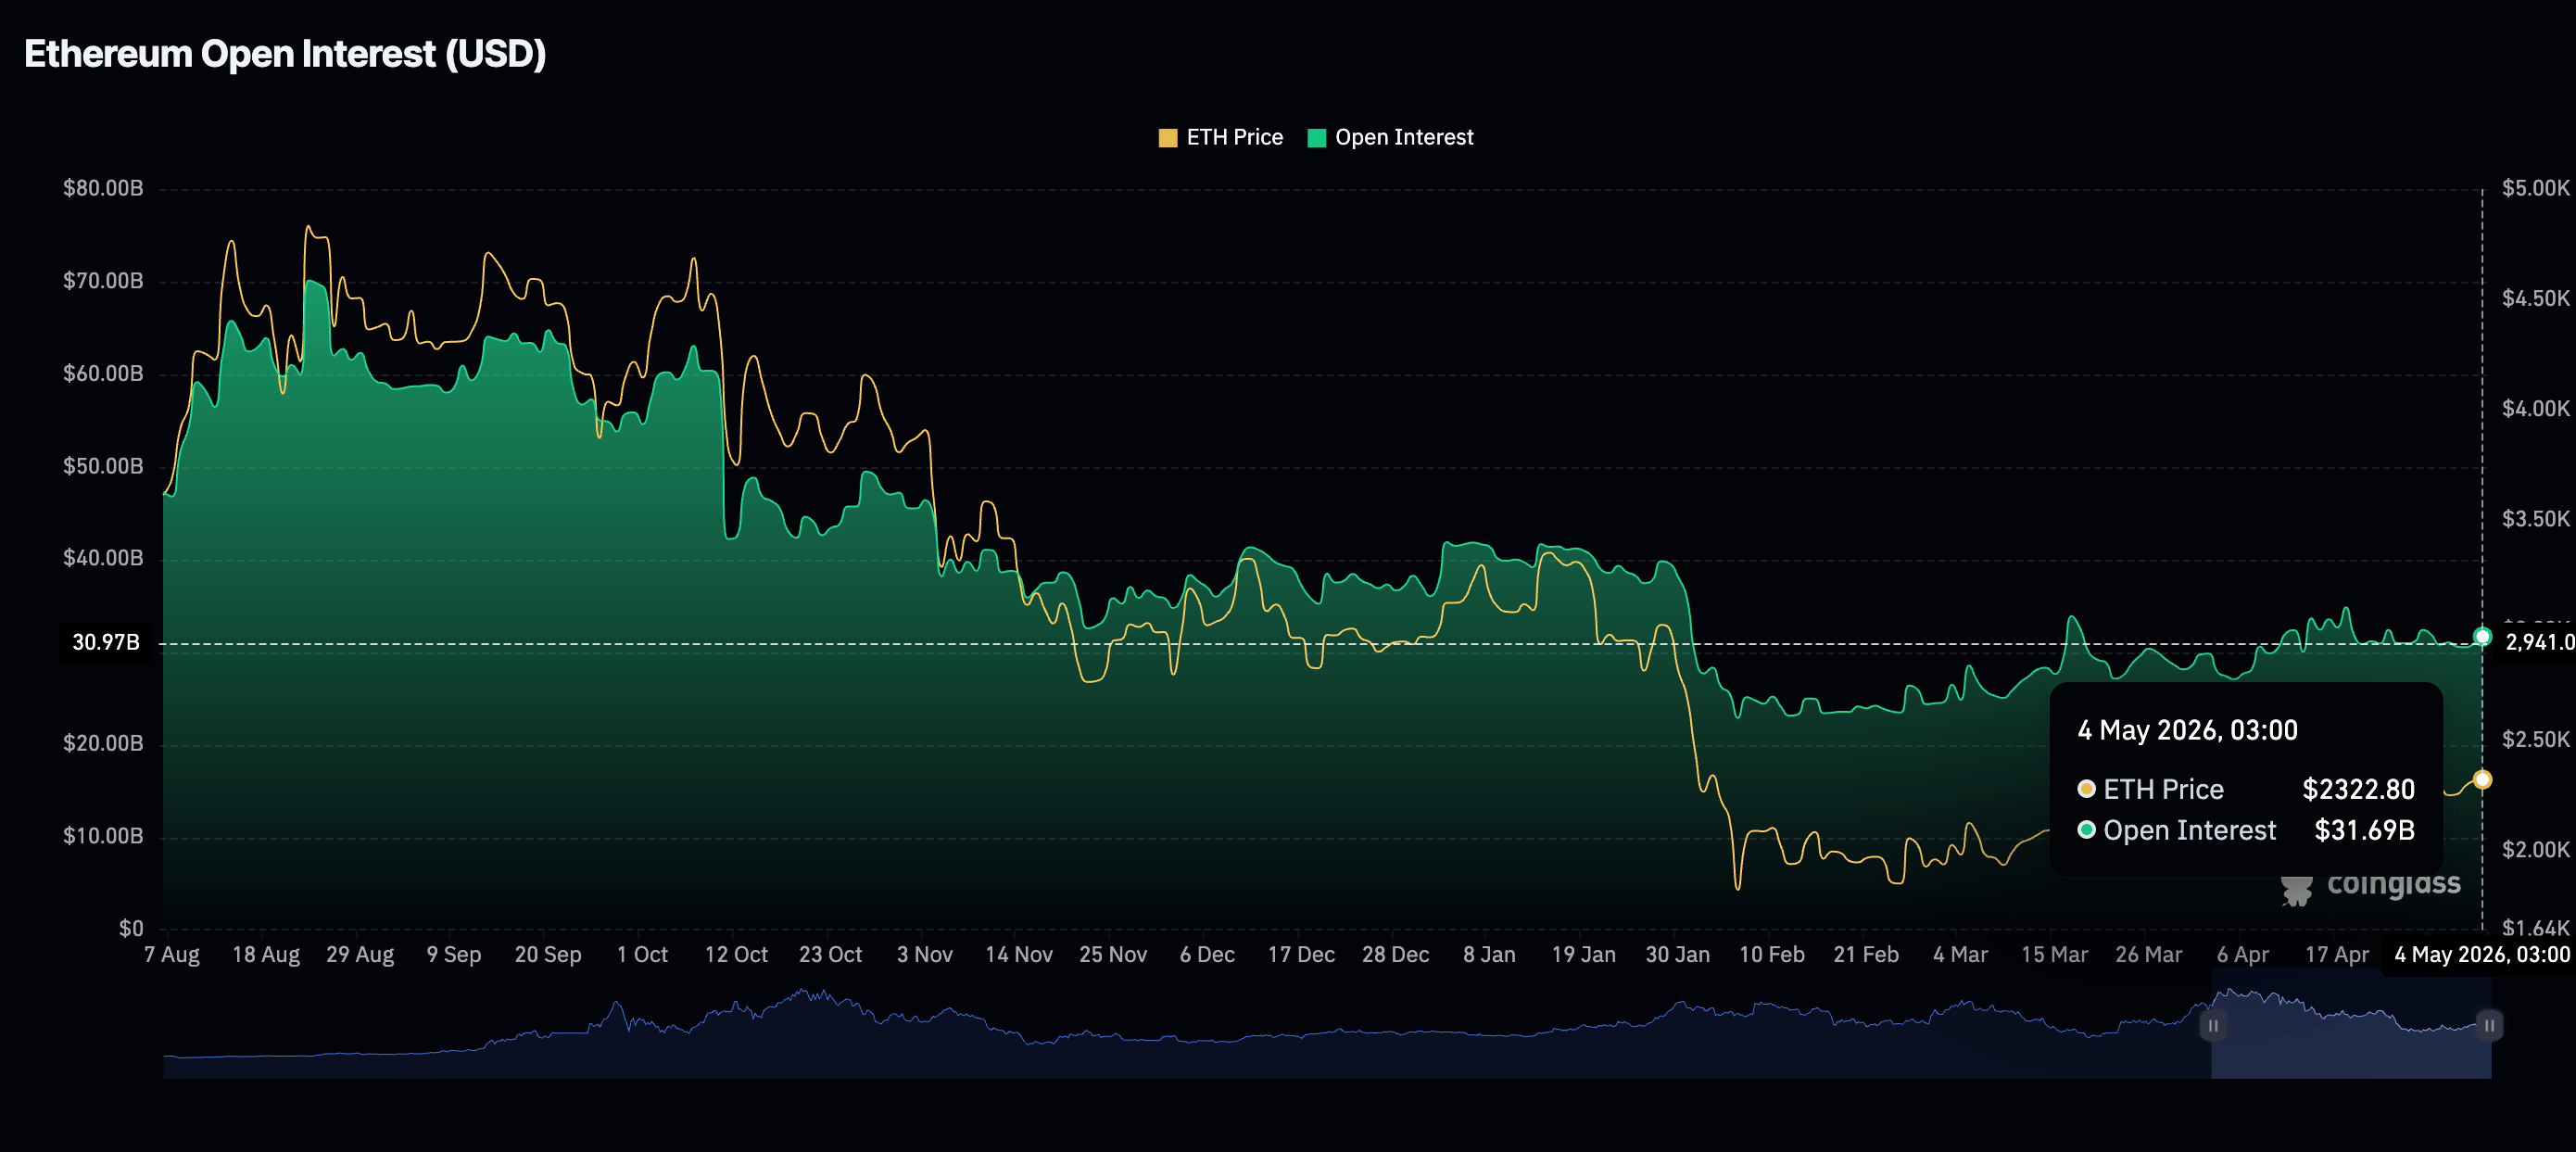
Retail investors are also showing interest in Ethereum derivatives, boosting the futures OI to $31.69 billion on Monday, from $30.95 billion the previous day. Despite OI paling in comparison to the record $70.13 billion reached in August, it has improved from the yearly low of $22.89 billion recorded in February. This suggests that growth remains organic, which could support steady price increases.
Turning to XRP, derivative demand remains subdued relative to Bitcoin and Ethereum, with Open Interest averaging just $2.5 billion on Monday. This is a sharp contrast to the July peak of $10.94 billion, highlighting persistent skepticism among retail participants about XRP’s ability to maintain an uptrend over the short to medium term.
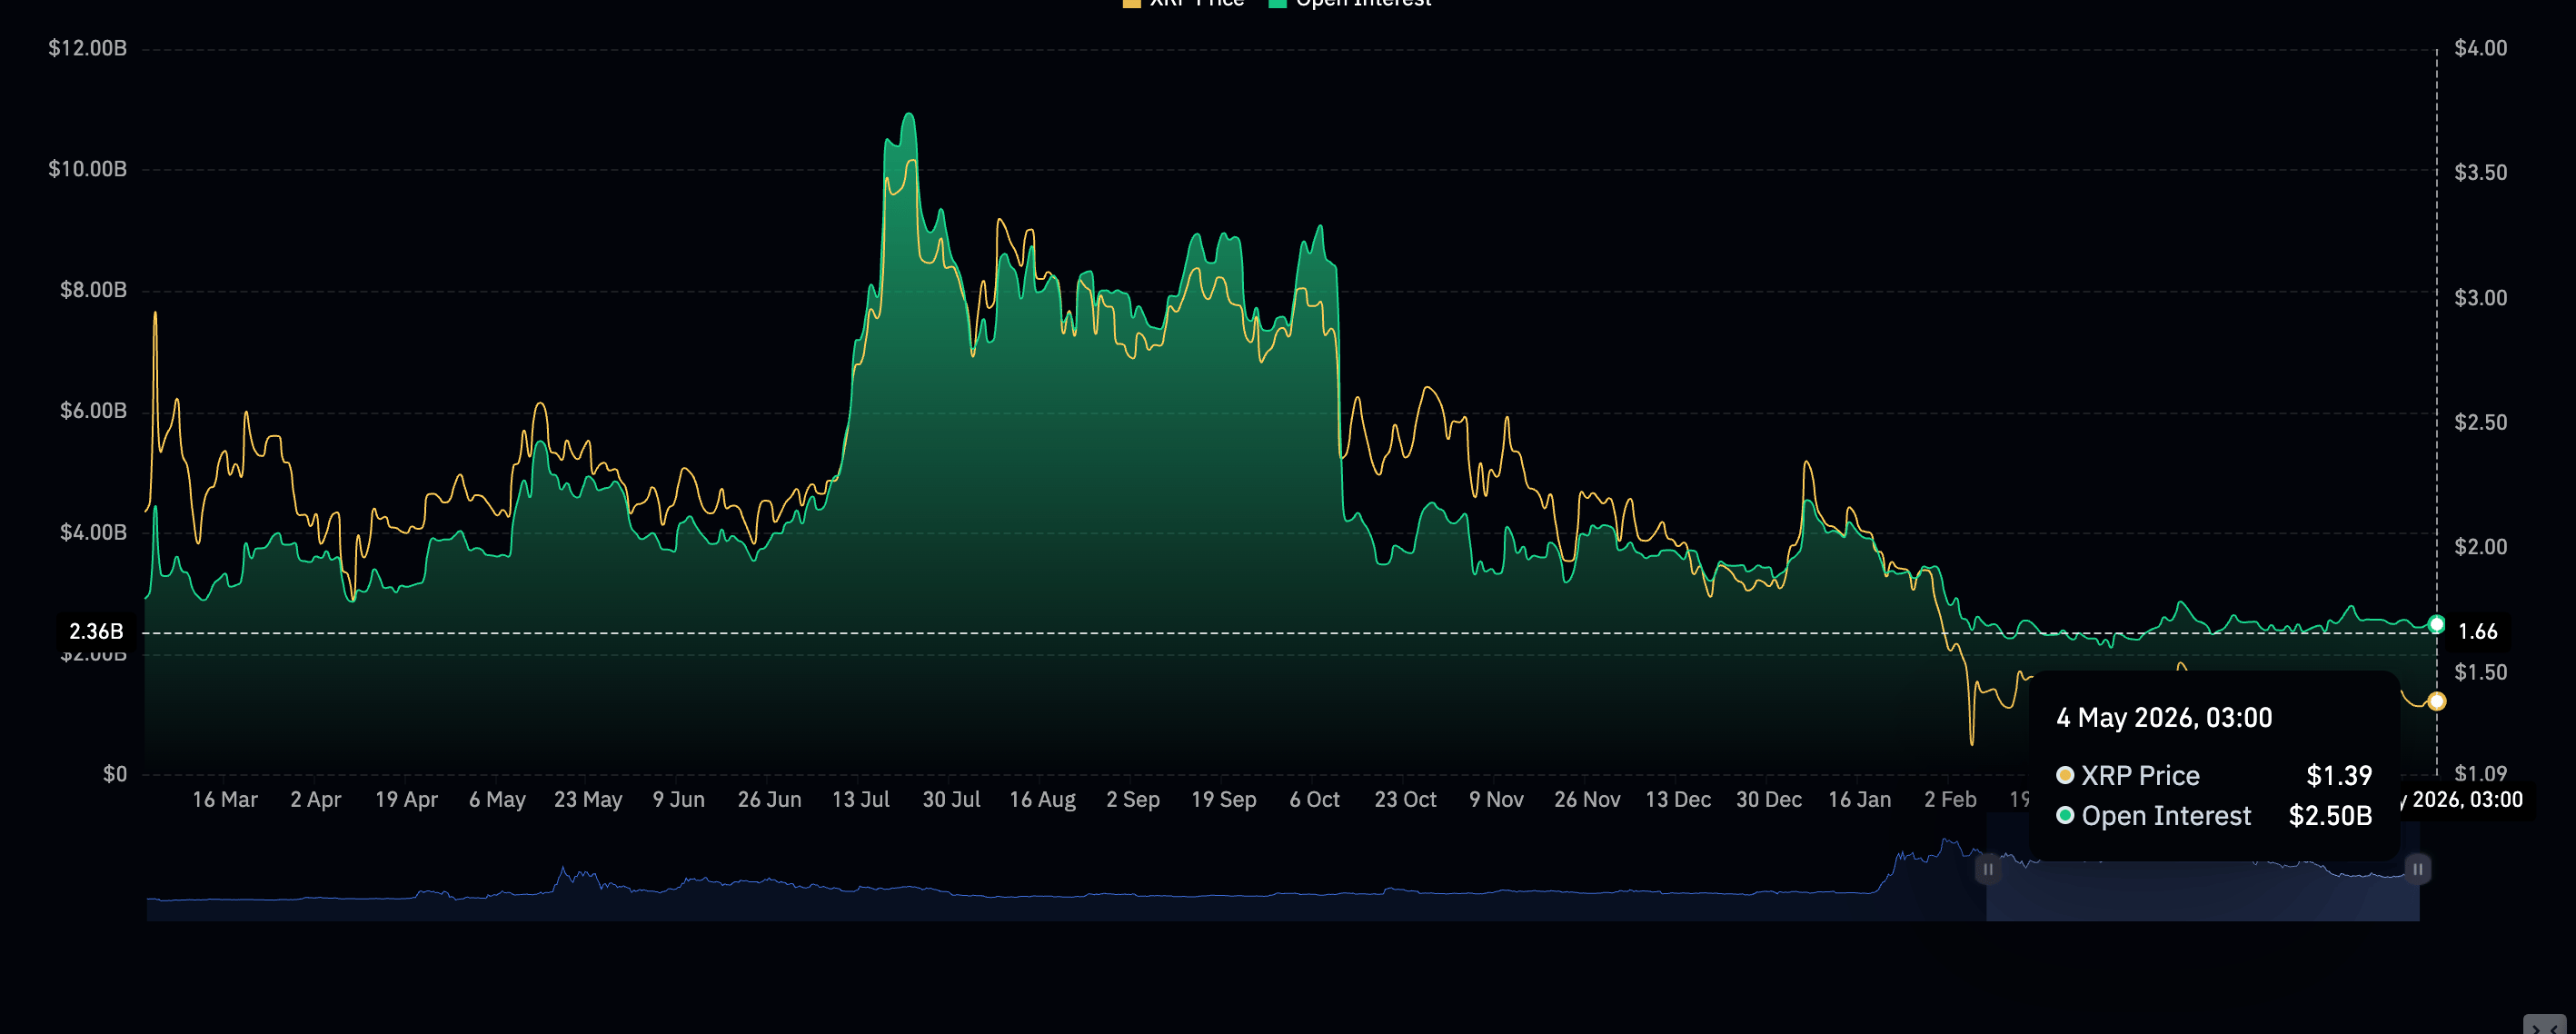
Chart of the day: Bitcoin gains momentum as bulls tighten grip
Bitcoin trades around $79,765, retaining a bullish near‑term bias as price holds well above the 50‑ and 100‑day Exponential Moving Averages (EMAs) at roughly $74,433 and $75,896 while still trading below the 200‑day EMA at about $81,894. This positioning suggests the broader uptrend remains intact but is starting to face medium‑term supply overhead.
The Relative Strength Index (RSI) at 65 on the daily chart leans toward bullish territory without yet signaling overbought conditions, while the Moving Average Convergence Divergence (MACD) histogram hovers just above the zero line with a mildly positive reading, hinting at fading but still positive momentum.
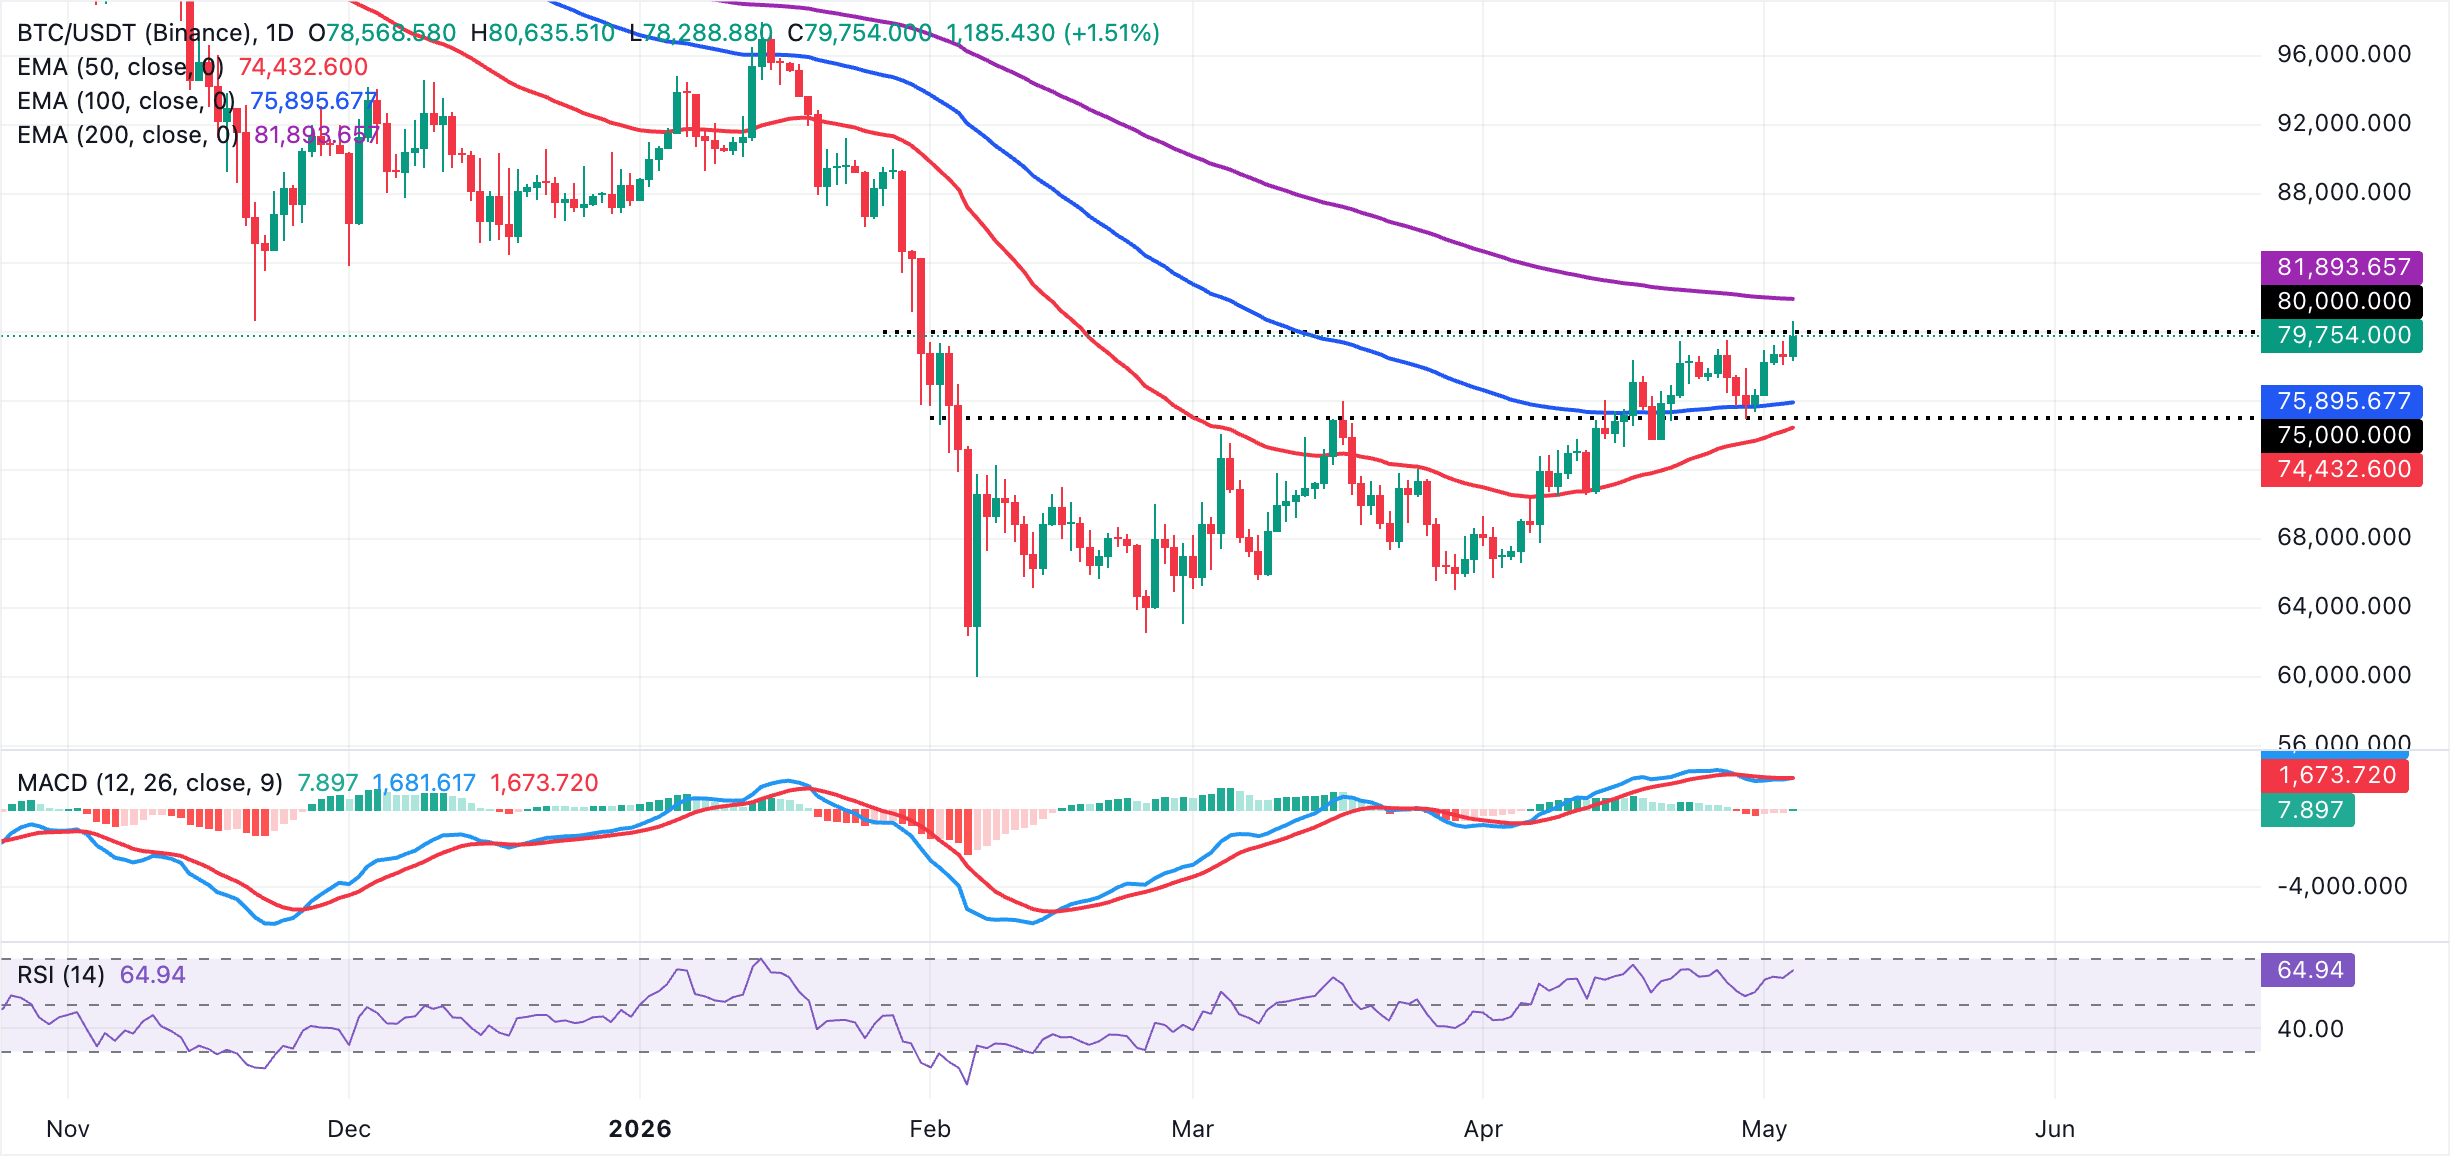
On the topside, the 200‑day EMA near $81,894 is the next significant resistance, and a sustained break above this barrier would open the door to a renewed impulsive leg higher. On the downside, initial support is seen at the 100‑day EMA around $75,896, followed by stronger dynamic support at the 50‑day EMA near $74,433. A daily close below these layers would weaken the current constructive outlook and signal a deeper corrective phase.
Altcoins technical outlook: Ethereum, XRP show signs of steady growth
Ethereum trades at $2,361, maintaining a neutral-to-slightly bullish tone as the spot price sits above the 50- and 100-day EMAs at $2,256 and $2,344, respectively, but remains capped well below the 200-day EMA at $2,571. The RSI around 58 on the daily chart hints at constructive upside momentum, but not overextended. At the same time, the MACD histogram remains below the zero line with a negative reading, suggesting that bullish attempts are still developing within a broader corrective backdrop.
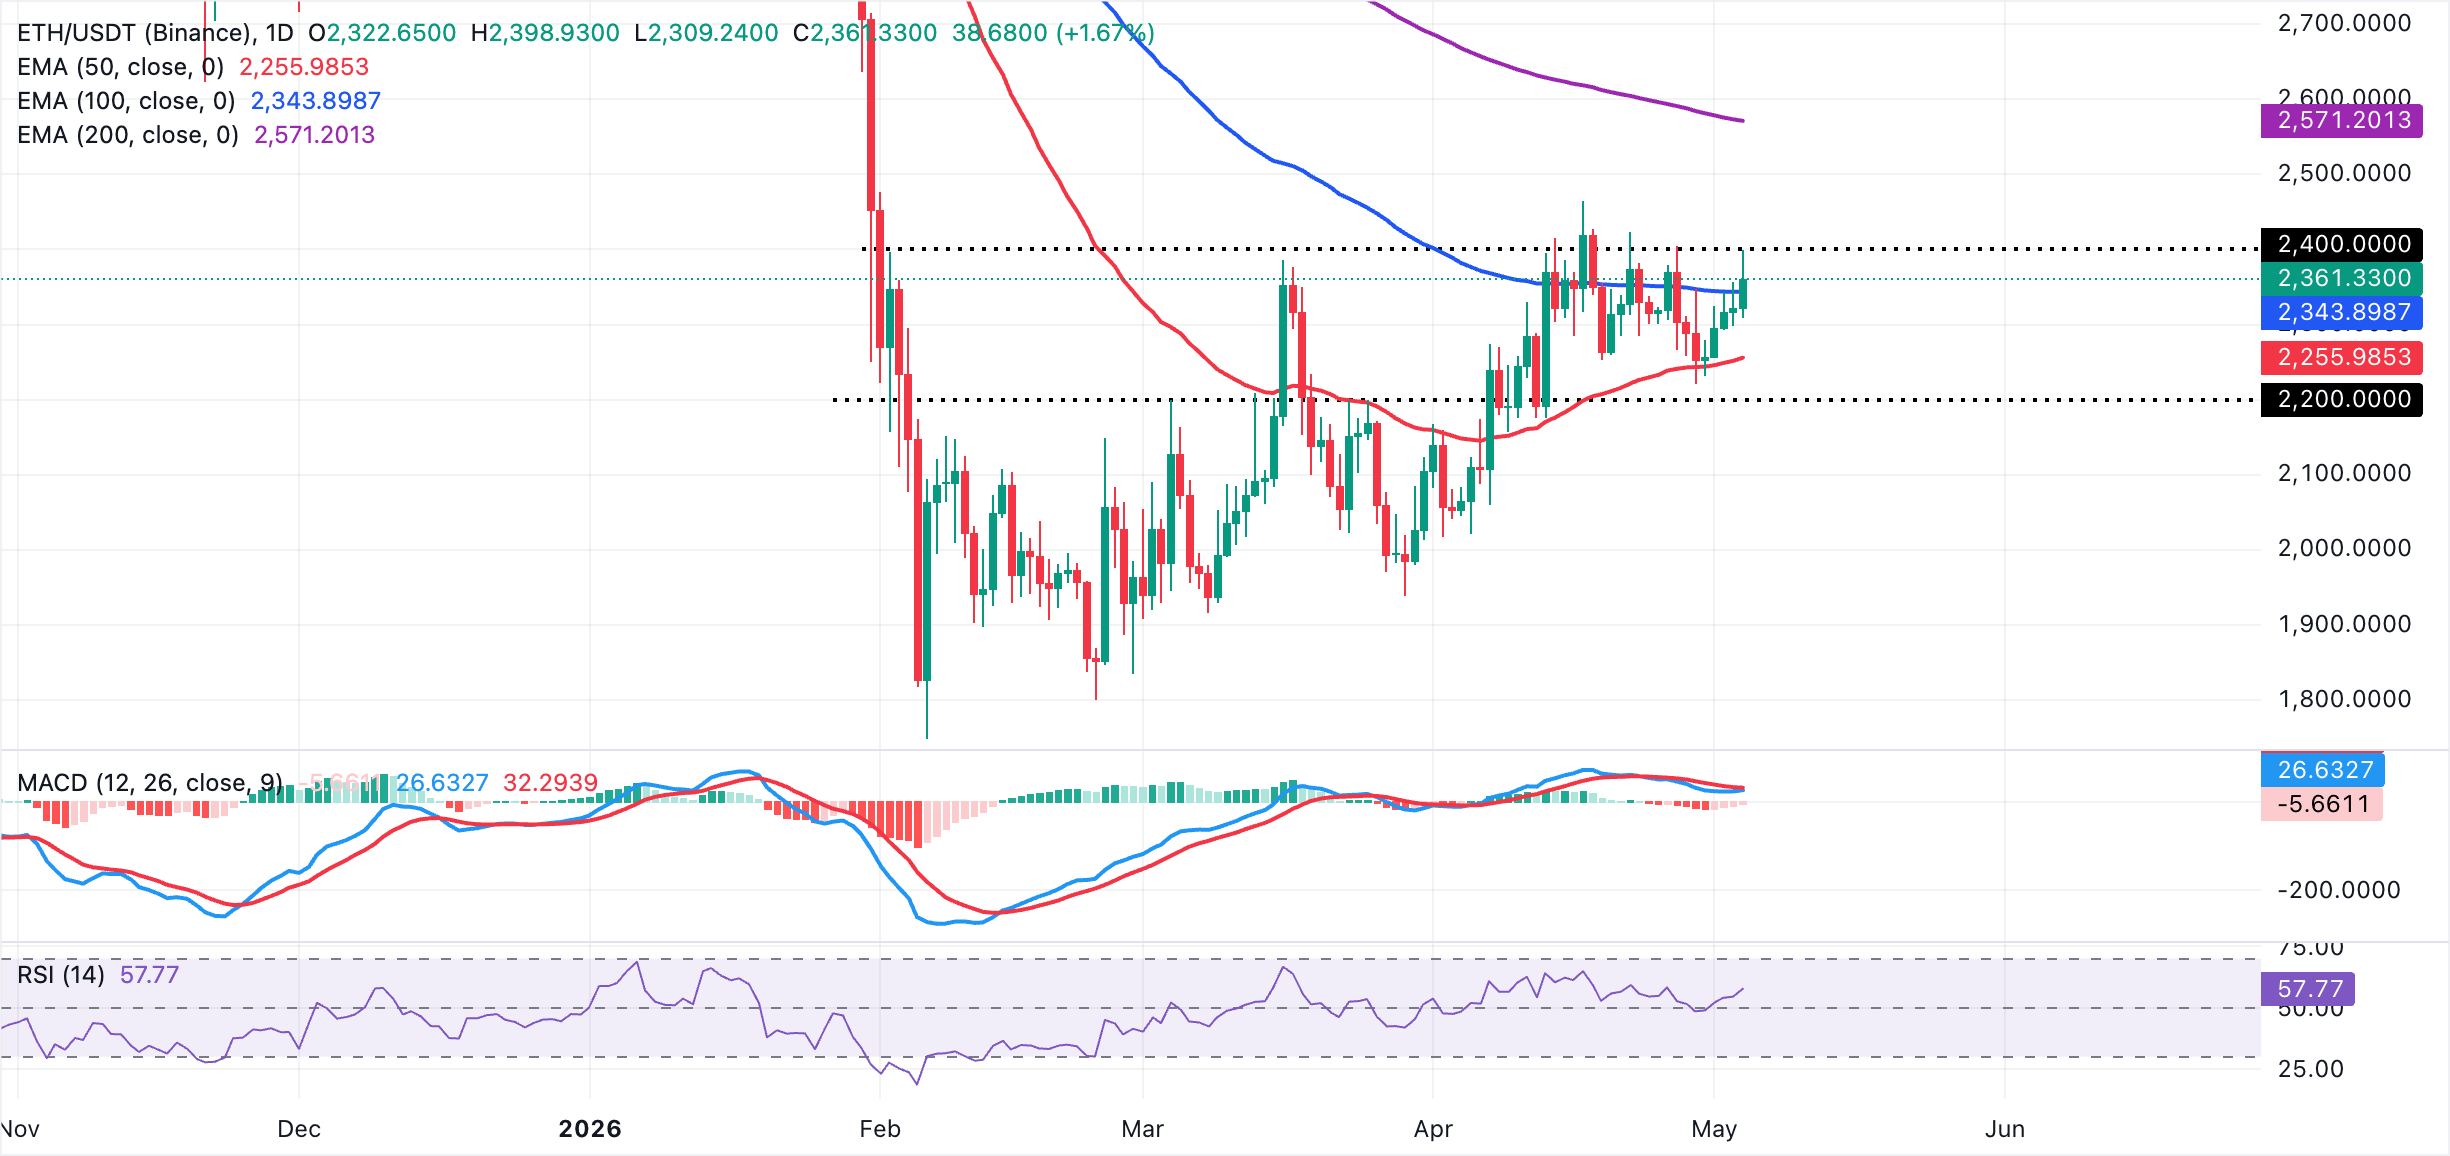
On the topside, initial resistance lies at $2,400, followed by the 200-day EMA at $2,571. A sustained break above these barriers would be needed to reopen a more decisive bullish phase. On the downside, immediate support emerges at the 100-day EMA near $2,344, with a deeper pullback exposing the 50-day EMA around $2,256 as the next key demand area that should hold to preserve the nascent constructive bias.
XRP, on the other hand, trades at $1.41 as bulls attempt to stabilize after recent gains. However, the price remains structurally capped below the 100-day and 200-day EMAs at $1.51 and $1.74, respectively. On the downside, XRP holds marginally above the 50-day EMA at $1.41, hinting at an attempt to build a base, while the 20-day Bollinger middle band at $1.41 sits just overhead as immediate resistance.
Momentum signals are mixed, with the RSI hovering around 53 on the daily chart, while the MACD histogram has slipped slightly negative, suggesting upside impetus is fading beneath the broader downtrend defined by the descending resistance line.
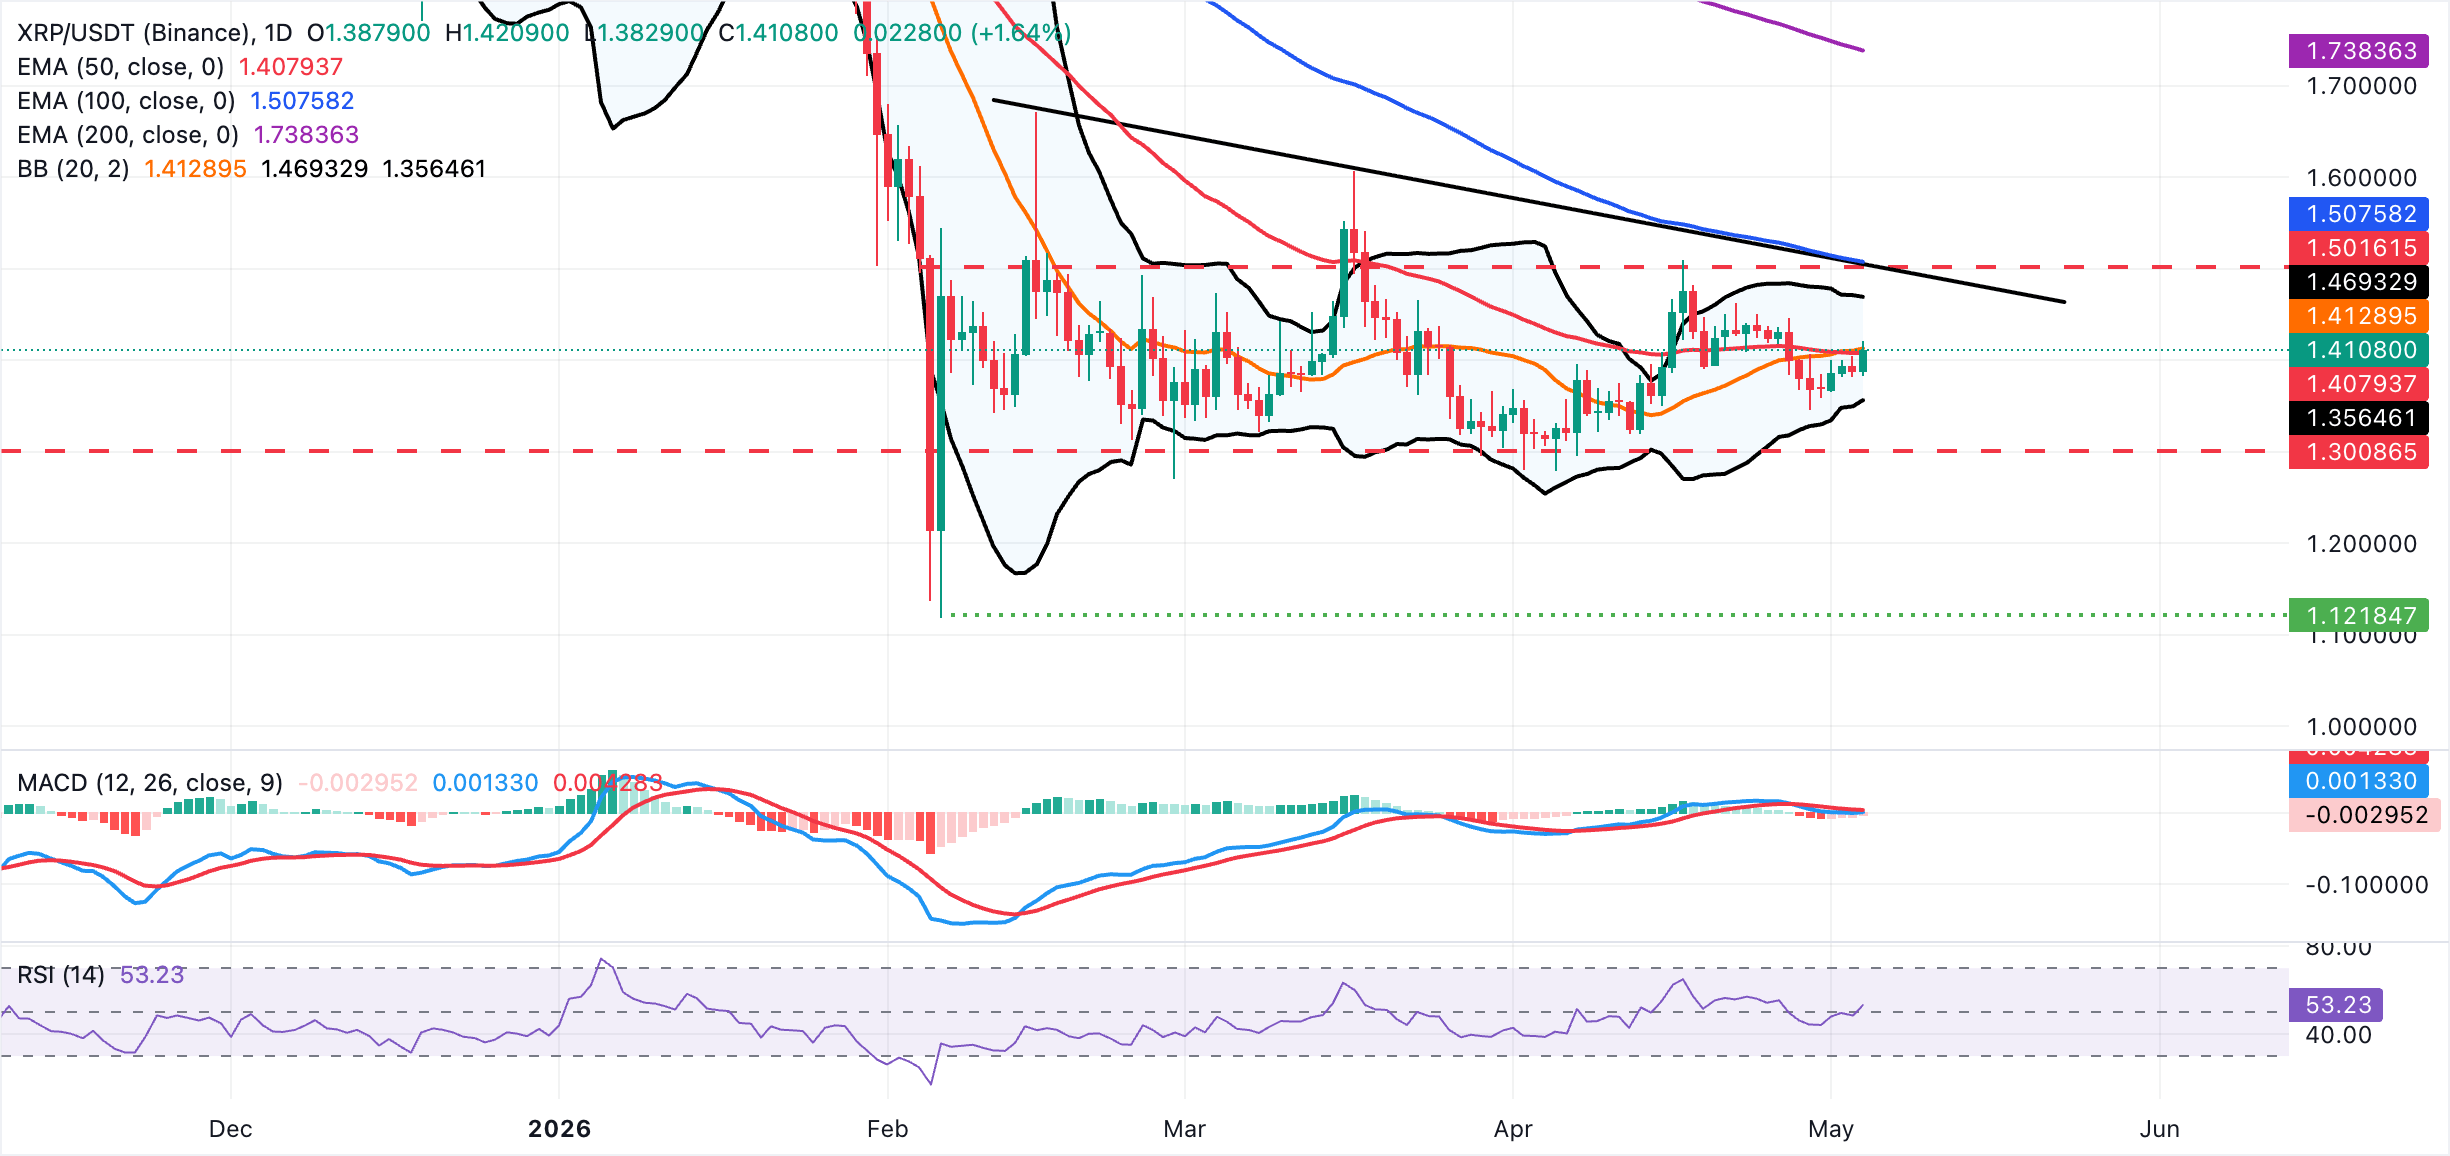
On the topside, initial resistance lies at the Bollinger middle band around $1.41, followed by the upper band near $ 1.47. A sustained break above that area would expose the descending trendline and the more important 100-day EMA at $1.51, with the 200-day EMA at $1.74 as a major bullish threshold. On the downside, immediate support is provided by the 50-day EMA at $1.41. A daily close below this level would open the door to the lower Bollinger band around $1.36, where buyers would be expected to show more interest in defending the broader consolidation range.
(The technical analysis of this story was written with the help of an AI tool.)
Open Interest, funding rate FAQs
Higher Open Interest is associated with higher liquidity and new capital inflow to the market. This is considered the equivalent of increase in efficiency and the ongoing trend continues. When Open Interest decreases, it is considered a sign of liquidation in the market, investors are leaving and the overall demand for an asset is on a decline, fueling a bearish sentiment among investors.
Funding fees bridge the difference between spot prices and prices of futures contracts of an asset by increasing liquidation risks faced by traders. A consistently high and positive funding rate implies there is a bullish sentiment among market participants and there is an expectation of a price hike. A consistently negative funding rate for an asset implies a bearish sentiment, indicating that traders expect the cryptocurrency’s price to fall and a bearish trend reversal is likely to occur.

يعتمد أكثر من مليون مستخدم على FXStreet للحصول على بيانات سوقية لحظية، وأدوات رسوم بيانية، ورؤى خبراء، وأخبار الفوركس. يساعد تقويمهم الاقتصادي الشامل والندوات التعليمية عبر الويب المتداولين على البقاء على اطلاع واتخاذ قرارات محسوبة. لدى FXStreet فريق يضم حوالي 60 محترفًا موزعين بين مقر برشلونة ومناطق عالمية مختلفة.
اقرأ المزيد


