
Crypto Today: Bitcoin, Ethereum, XRP extend losses, weighed by negative ETF flows
بواسطة John Isige
تاريخ النشر: 19 Mar 2026 | تاريخ التعديل: 19 Mar 2026


المقالات الشائعة

Cryptocurrency prices are generally edging lower on Thursday as market sentiment deteriorates following the Federal Reserve (Fed) Chair Jerome Powell’s remarks suggesting that interest rate cuts aren't planned unless there is a clear downtrend in inflation.
- Bitcoin extends its decline from weekly highs around $76,000, but still holds above the $70,000 as support amid ETF outflows.
- Ethereum slides for the third consecutive day, losing the 50-day EMA support amid capital exit from ETFs.
- XRP retests $1.45 support amid a weakening technical outlook, trading below major moving averages.
Cryptocurrency prices are generally edging lower on Thursday as market sentiment deteriorates following the Federal Reserve (Fed) Chair Jerome Powell’s remarks suggesting that interest rate cuts aren't planned unless there is a clear downtrend in inflation.
Bitcoin (BTC) is extending its correction from its weekly high of $76,000 and is trading above $70,000, suffering from the US central bank’s hawkish tone. Ethereum (ETH) hovers above $2,100, down from a weekly peak of $2,386. Similarly, Ripple (XRP) is showing technical weakness, testing support at $1.45, down nearly 10% from the week’s high at $1.61.
During his press conference on Wednesday, Powell said that inflation remains a concern despite the progress already achieved. “The forecast is that we will be making progress on inflation, not as much as we had hoped, but some progress on inflation,” Powell stated. "If inflation progress stalls, rate cuts will not follow," he added.
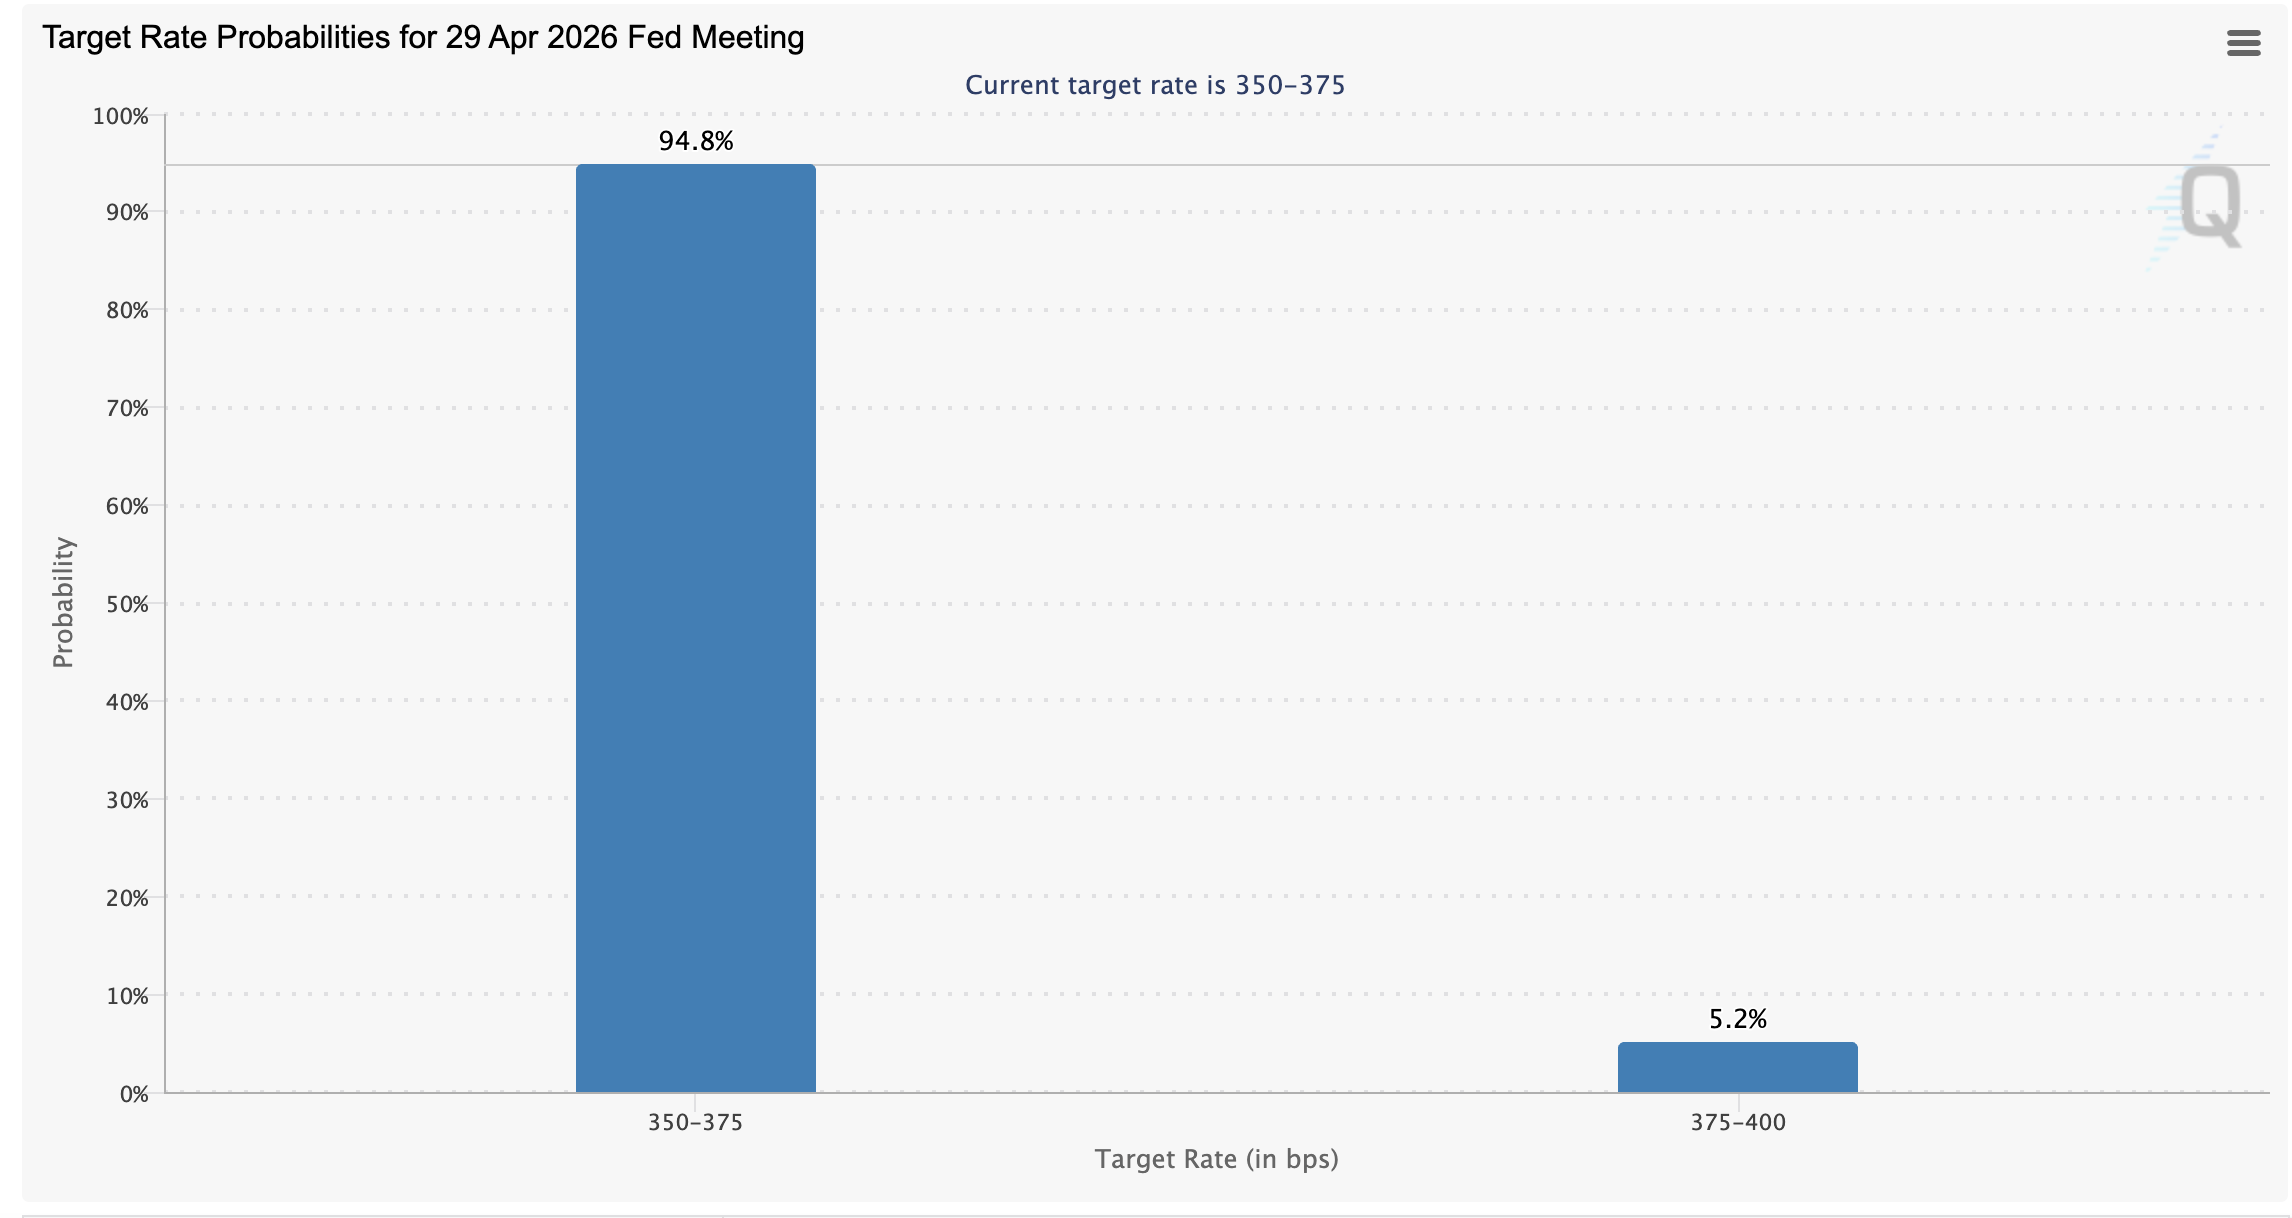
The Fed left interest rates unchanged in the 3.50%-3.75% range, matching overall market consensus, and investors don't expect rates to move either after the Fed's next meeting on April 29.
Bitcoin and Ethereum ETFs face outflows
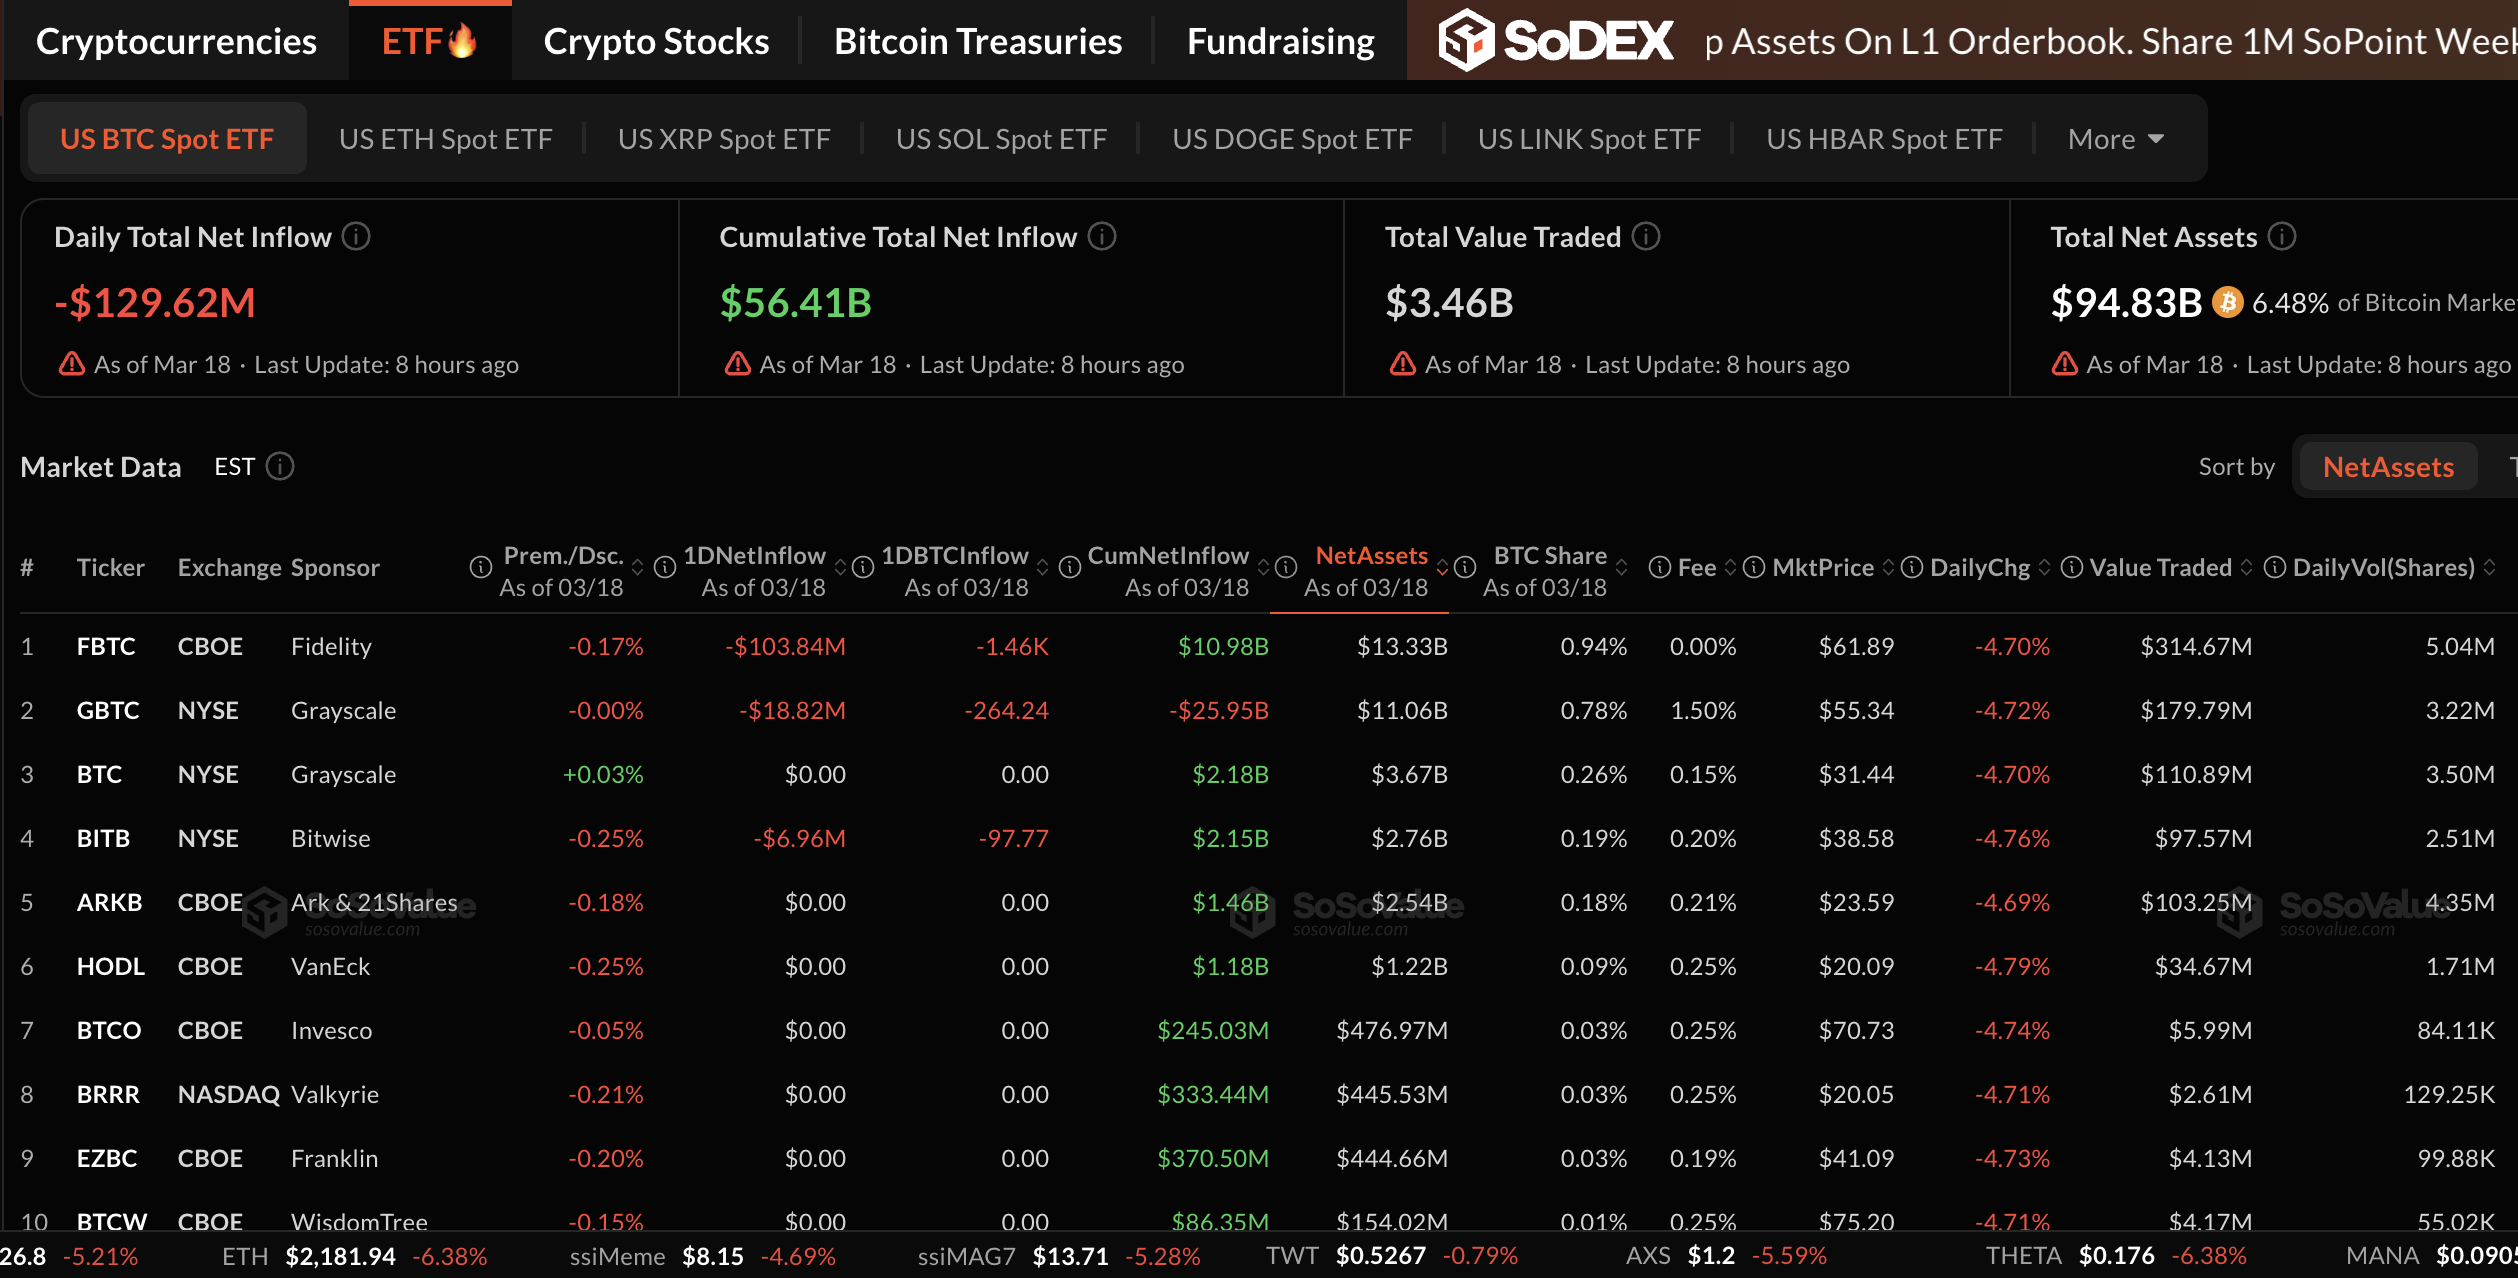
Bitcoin spot Exchange-Traded Funds (ETFs) experienced outflows totaling $130 million on Wednesday, breaking seven days of consecutive inflows. The outflows appear to reflect the dampened mood following the Fed’s hawkish tone.
Cumulative inflows stand at $56.41 billion, with net assets averaging $94.83 billion, suggesting that long-term risk appetite remains intact.
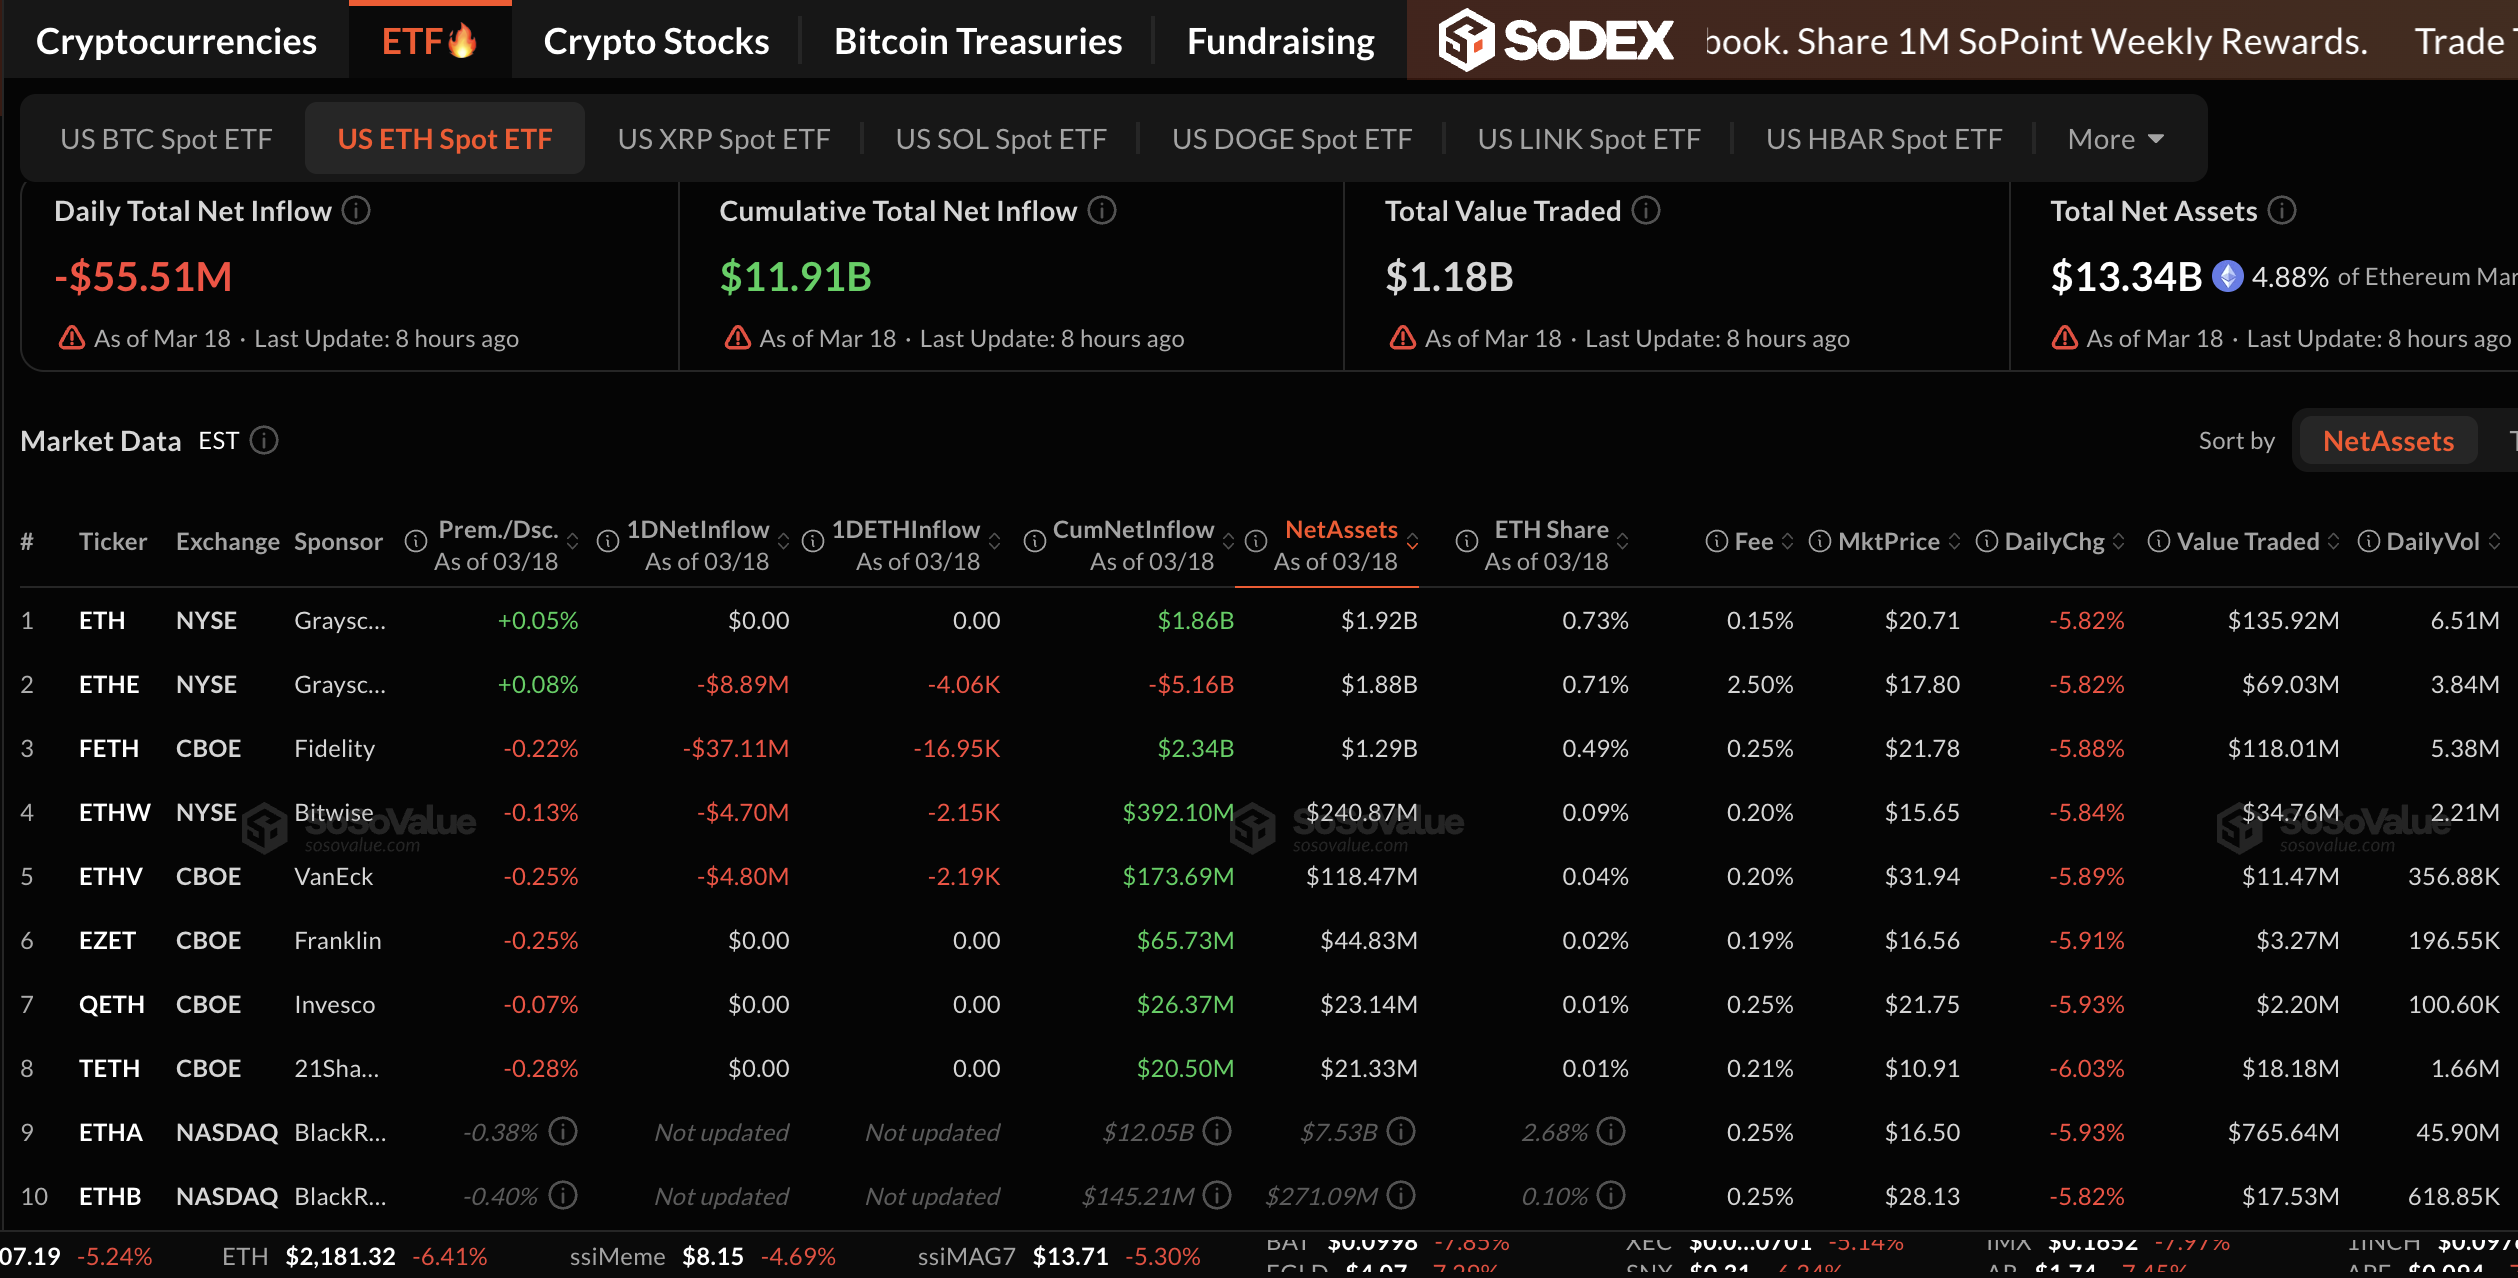
Ethereum spot ETFs also changed course on Wednesday, recording nearly $56 million in outflows after a six-day inflow streak. The total net assets under management stand at $11.91 billion, while cumulative inflows average $13.34 billion.
Meanwhile, activity in XRP spot ETFs remained muted on Wednesday, with zero flows recorded, according to SoSoValue data. Cumulative inflows hold at $1.21 billion with net assets under management averaging $1.02 billion.
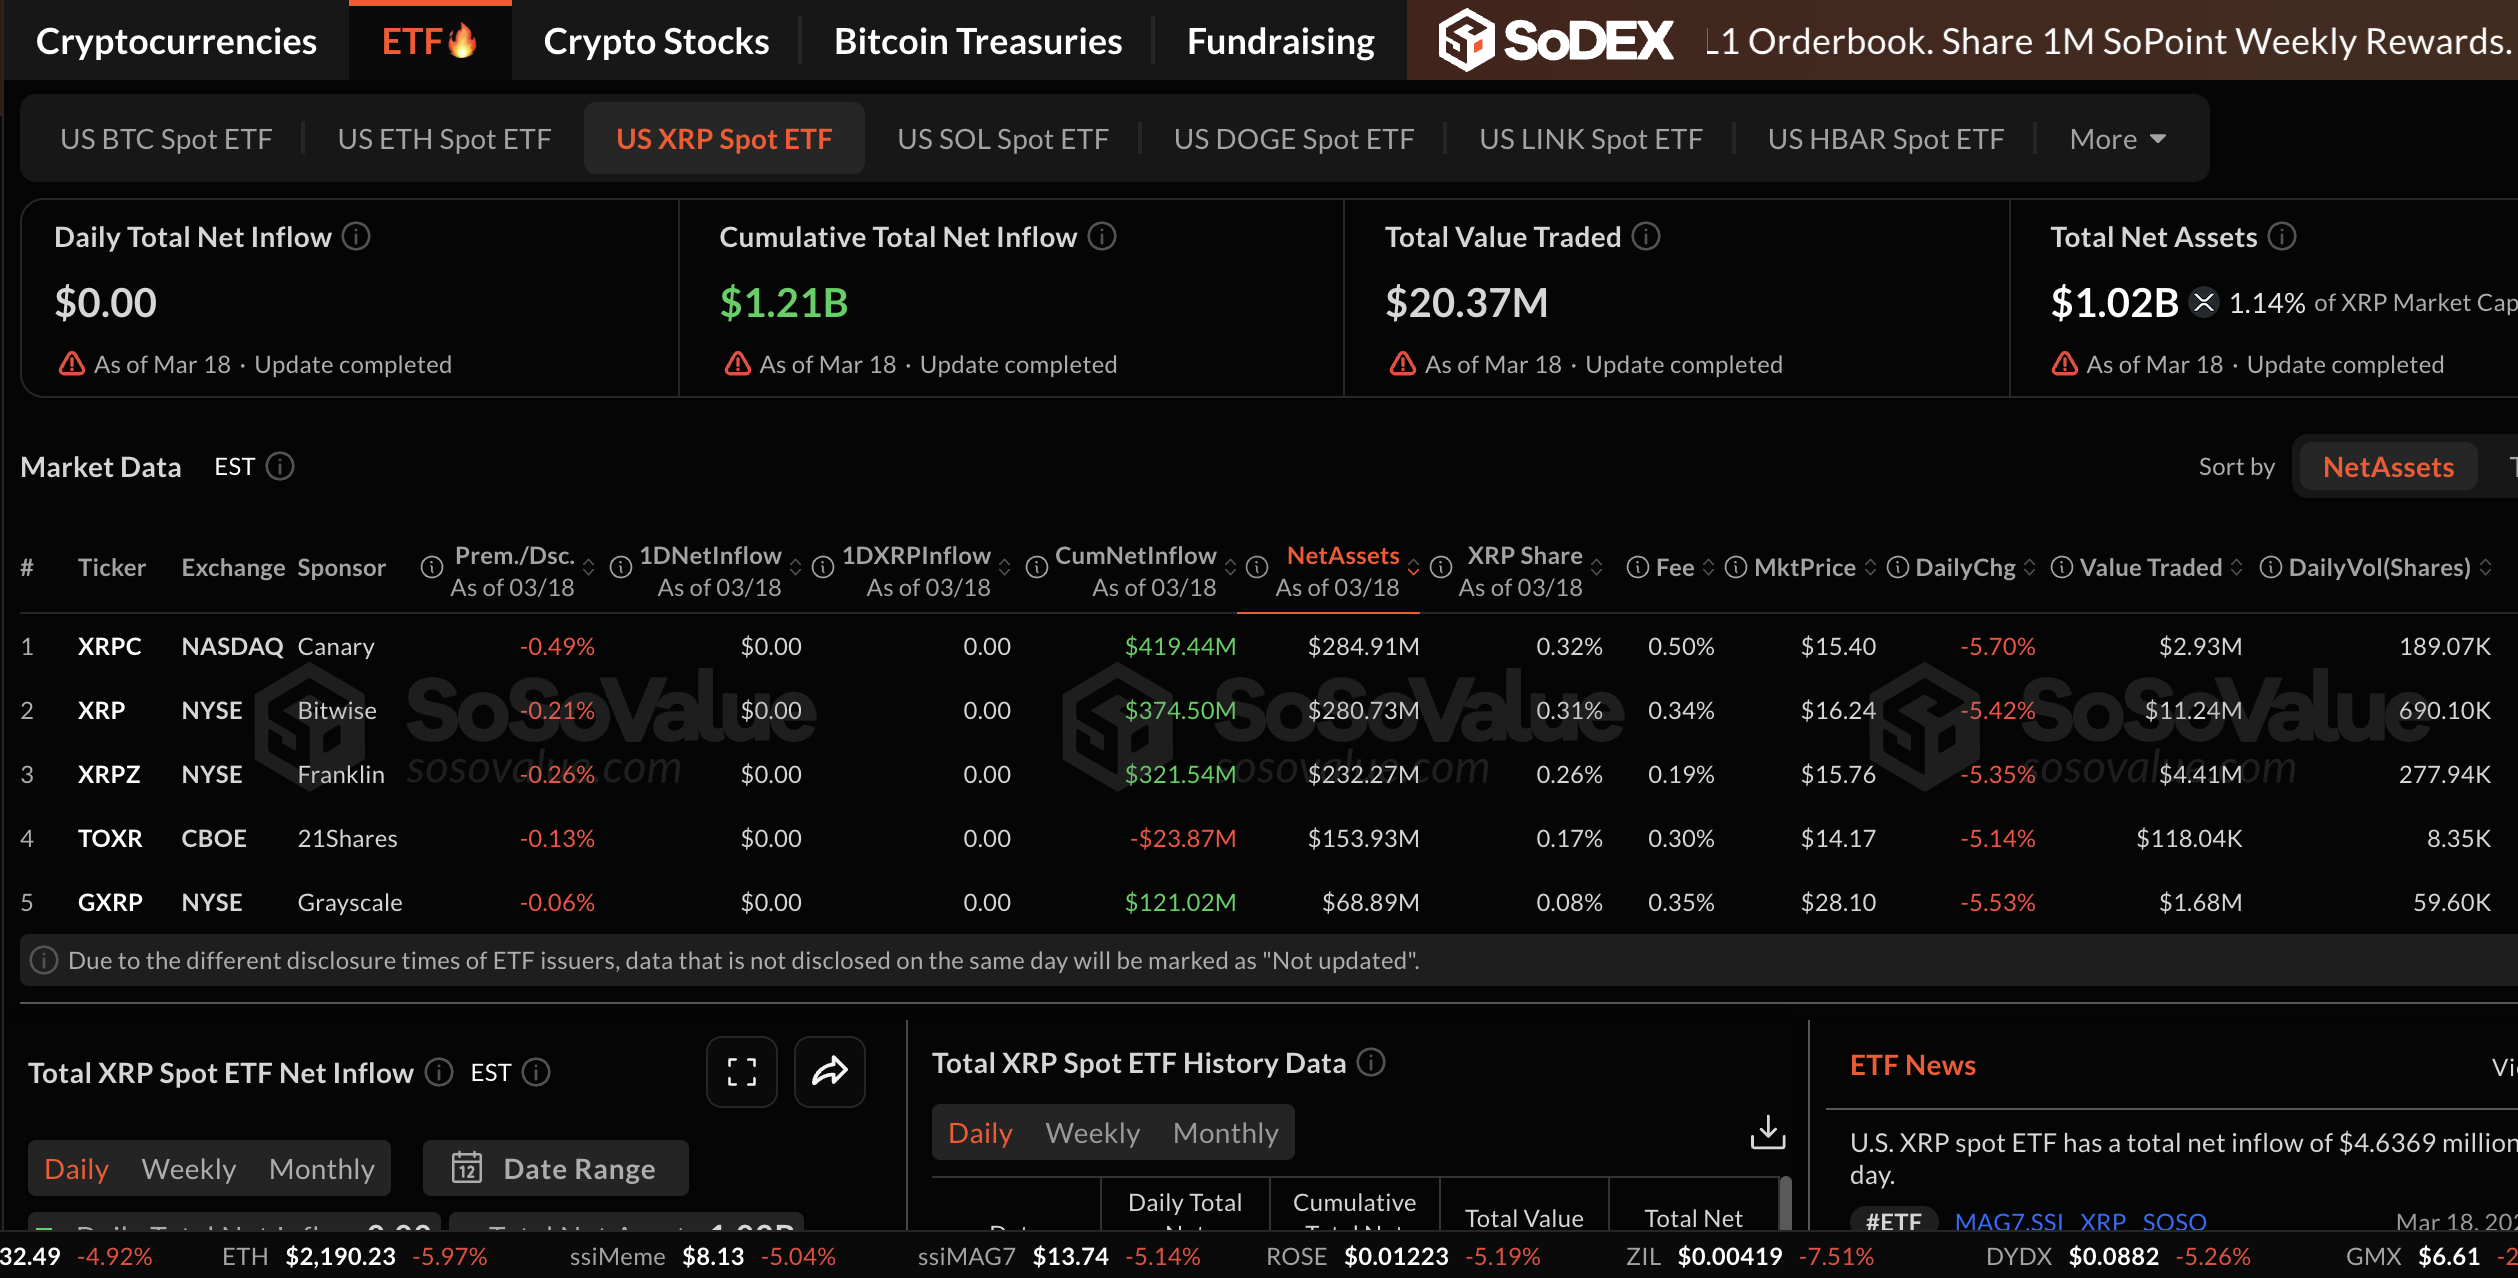
Chart of the day: Bitcoin pressured as losses mount
Bitcoin extends its correction to trade above the pivotal $70,000 level, confirming a neutral-to-bearish outlook. The price also holds below key moving averages, including the 50-day Exponential Moving Average (EMA), which had briefly served as support earlier in the week, the 100-day EMA, and the 200-day EMA. All three moving averages slope lower, keeping the overall trend bearish.
Meanwhile, the Relative Strength Index (RSI) at 48 on the daily chart stays near its midline, indicating a shift in momentum after the recent pullback from above 60. The Moving Average Convergence Divergence (MACD) green histogram bars have been contracting from elevated positive readings on the same chart, reinforcing the fading upside momentum, but not a decisive bearish reversal. A long-standing descending resistance trendline sits well above the spot price, confirming the broader bearish outlook.
-1773915562556-1773915562568.png)
Initial resistance appears at $72,753, aligning with the 50-day EMA. A break above it is likely to clear the path toward the weekly high at $76,000. On the downside, immediate support stands around $70,000, guarding a deeper pullback toward $68,400 and then $67,000, where prior swing lows cluster and dip-buying recently emerged.
Altcoins technical outlook: Ethereum, XRP test key support
Ethereum is trading at $2,163 after correcting from its weekly high of $2,386. The price is holding well below the 50-day, 100-day and 200-day EMAs, which continue to slope lower and frame a dominant downside backdrop. At the same time, the long-term downward-sloping trendline remains unbroken following the latest rebound, reinforcing the broader downtrend.
Momentum conditions soften from prior strength as the RSI eases back toward the low-50s from near overbought territory on the daily chart, while the MACD indicator retreats from recent highs, suggesting fading upside pressure within a still-depressed higher-timeframe structure.
-1773916169943-1773916169944.png)
Immediate support appears near the recent low around $2,150, where failure would expose the next bearish target near $2,100, followed by a deeper zone toward $2,050 if selling extends. On the topside, initial resistance aligns with the $2,200 area, and a break above there would open a move toward $2,250, where sellers are expected to defend in line with the descending trend line context.
A sustained recovery above $2,250 would be needed to challenge the broader bearish structure and turn focus toward the $2,300 region, but as long as ETH trades beneath these caps, rallies remain vulnerable to renewed downside pressure.
As for XRP, the price is testing the weekly open at $1.45 as immediate support amid a bearish short-term outlook. The RSI at 52 stays just above the midline on the daily chart, aligning with a neutral tone after falling from highs above 60.
Still, the MACD indicator remains in positive territory and above the signal line on the same chart, suggesting buyers retain control despite the latest moderation in upside momentum.
It is worth noting that XRP remains capped well below the long-standing descending resistance trend line, which continues to frame the broader structure as corrective rather than bullish.
-1773916992814-1773916992820.png)
On the downside, initial support lies around $1.45. A break below this level would expose deeper support toward $1.40, where the recent low aligns with the broader consolidation floor. Looking up, immediate resistance is seen at $1.50, followed by $1.61, the latest swing peak that halted the prior advance.
Crypto ETF FAQs
An Exchange-Traded Fund (ETF) is an investment vehicle or an index that tracks the price of an underlying asset. ETFs can not only track a single asset, but a group of assets and sectors. For example, a Bitcoin ETF tracks Bitcoin’s price. ETF is a tool used by investors to gain exposure to a certain asset.
Yes. The first Bitcoin futures ETF in the US was approved by the US Securities & Exchange Commission in October 2021. A total of seven Bitcoin futures ETFs have been approved, with more than 20 still waiting for the regulator’s permission. The SEC says that the cryptocurrency industry is new and subject to manipulation, which is why it has been delaying crypto-related futures ETFs for the last few years.
Yes. The SEC approved in January 2024 the listing and trading of several Bitcoin spot Exchange-Traded Funds, opening the door to institutional capital and mainstream investors to trade the main crypto currency. The decision was hailed by the industry as a game changer.
The main advantage of crypto ETFs is the possibility of gaining exposure to a cryptocurrency without ownership, reducing the risk and cost of holding the asset. Other pros are a lower learning curve and higher security for investors since ETFs take charge of securing the underlying asset holdings. As for the main drawbacks, the main one is that as an investor you can’t have direct ownership of the asset, or, as they say in crypto, “not your keys, not your coins.” Other disadvantages are higher costs associated with holding crypto since ETFs charge fees for active management. Finally, even though investing in ETFs reduces the risk of holding an asset, price swings in the underlying cryptocurrency are likely to be reflected in the investment vehicle too.
(The technical analysis of this story was written with the help of an AI tool.)

يعتمد أكثر من مليون مستخدم على FXStreet للحصول على بيانات سوقية لحظية، وأدوات رسوم بيانية، ورؤى خبراء، وأخبار الفوركس. يساعد تقويمهم الاقتصادي الشامل والندوات التعليمية عبر الويب المتداولين على البقاء على اطلاع واتخاذ قرارات محسوبة. لدى FXStreet فريق يضم حوالي 60 محترفًا موزعين بين مقر برشلونة ومناطق عالمية مختلفة.
اقرأ المزيد


