
Crypto Today: Bitcoin, Ethereum, XRP pull back despite renewed US-Iran peace hopes
بواسطة John Isige
تم التحديث: 27 Apr 2026


المقالات الشائعة

Cryptocurrency prices are broadly retracing on Monday as market participants digest new developments in the Middle East conflict. Bitcoin (BTC) is trading below $78,000 after a rejection at weekly highs around $79,485 earlier in the day, while Ethereum (ETH) hovers above $2,300 support.
- Bitcoin slides below $78,000 as investors' caution dominates despite reports that Iran has offered the US a new proposal to end the war.
- Ethereum falls below the 100-day EMA and holds $2,300 support amid softening momentum indicators.
- XRP struggles to hold the 50-day EMA support despite the SuperTrend indicator confirming a buy signal.
Cryptocurrency prices are broadly retracing on Monday as market participants digest new developments in the Middle East conflict. Bitcoin (BTC) is trading below $78,000 after a rejection at weekly highs around $79,485 earlier in the day, while Ethereum (ETH) hovers above $2,300 support.
Ripple (XRP), on the other hand, holds above the $1.40 pivotal level, but its upside remains capped below two major moving averages, defining a broader bearish outlook.
Bitcoin, Ethereum and XRP gains fade amid Middle East peace hopes
The Iranian regime is reported to have submitted a new proposal to the United States (US) via Pakistan mediators aimed at opening the Strait of Hormuz and ending the war. According to a report by Axios, the proposal seeks to delay discussions on Iran’s nuclear program to a later stage and give way to a fast-tracked peace deal.
US President Donald Trump canceled the peace talks scheduled for last Sunday after Iran remained noncommittal. Trump said that there was no point in sending the US envoys Steve Witkoff and Jared Kushner to Pakistan and that negotiations could take place on the telephone when Iran is ready.
“We can do it just as well by telephone. The Iranians can call us if they want. We are not gonna travel just to sit there," Trump said.
The new proposal from Iran raises hopes for a resolution of the conflict, helping support positive market sentiment. However, while the White House has received the proposal, it remains unclear whether the US will be willing to explore it. President Trump remains optimistic that the conflict will end soon.
Meanwhile, market sentiment continues to improve with the crypto Fear & Greed Index holding at 47 in the fear territory on Monday, up from 33 the previous day. The index held in the extreme fear territory last month, underscoring the gradual but steady turnaround in investor risk appetite.
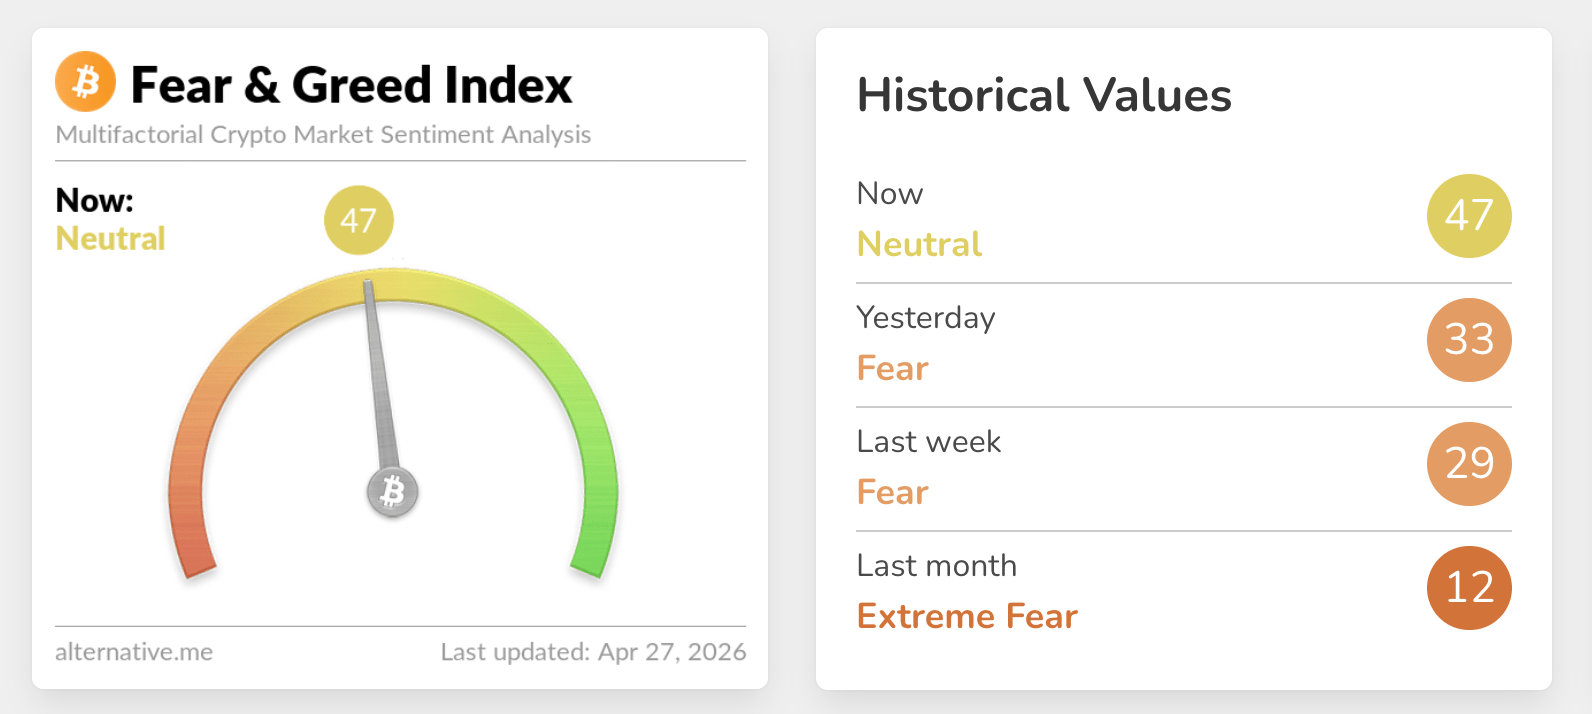
Chart of the day: Bitcoin pressured below $80,000 supply
Bitcoin trades at $77,619, maintaining a bullish near-term bias as price holds above the 50-day and 100-day Exponential Moving Averages (EMAs) at $73,362 and $75,635, respectively. Momentum metrics back the constructive tone, with the Relative Strength Index (RSI) hovering around 61 on the daily chart and the Moving Average Convergence Divergence (MACD) histogram remaining in positive territory, hinting that buyers still control the tape despite some loss of upside momentum.
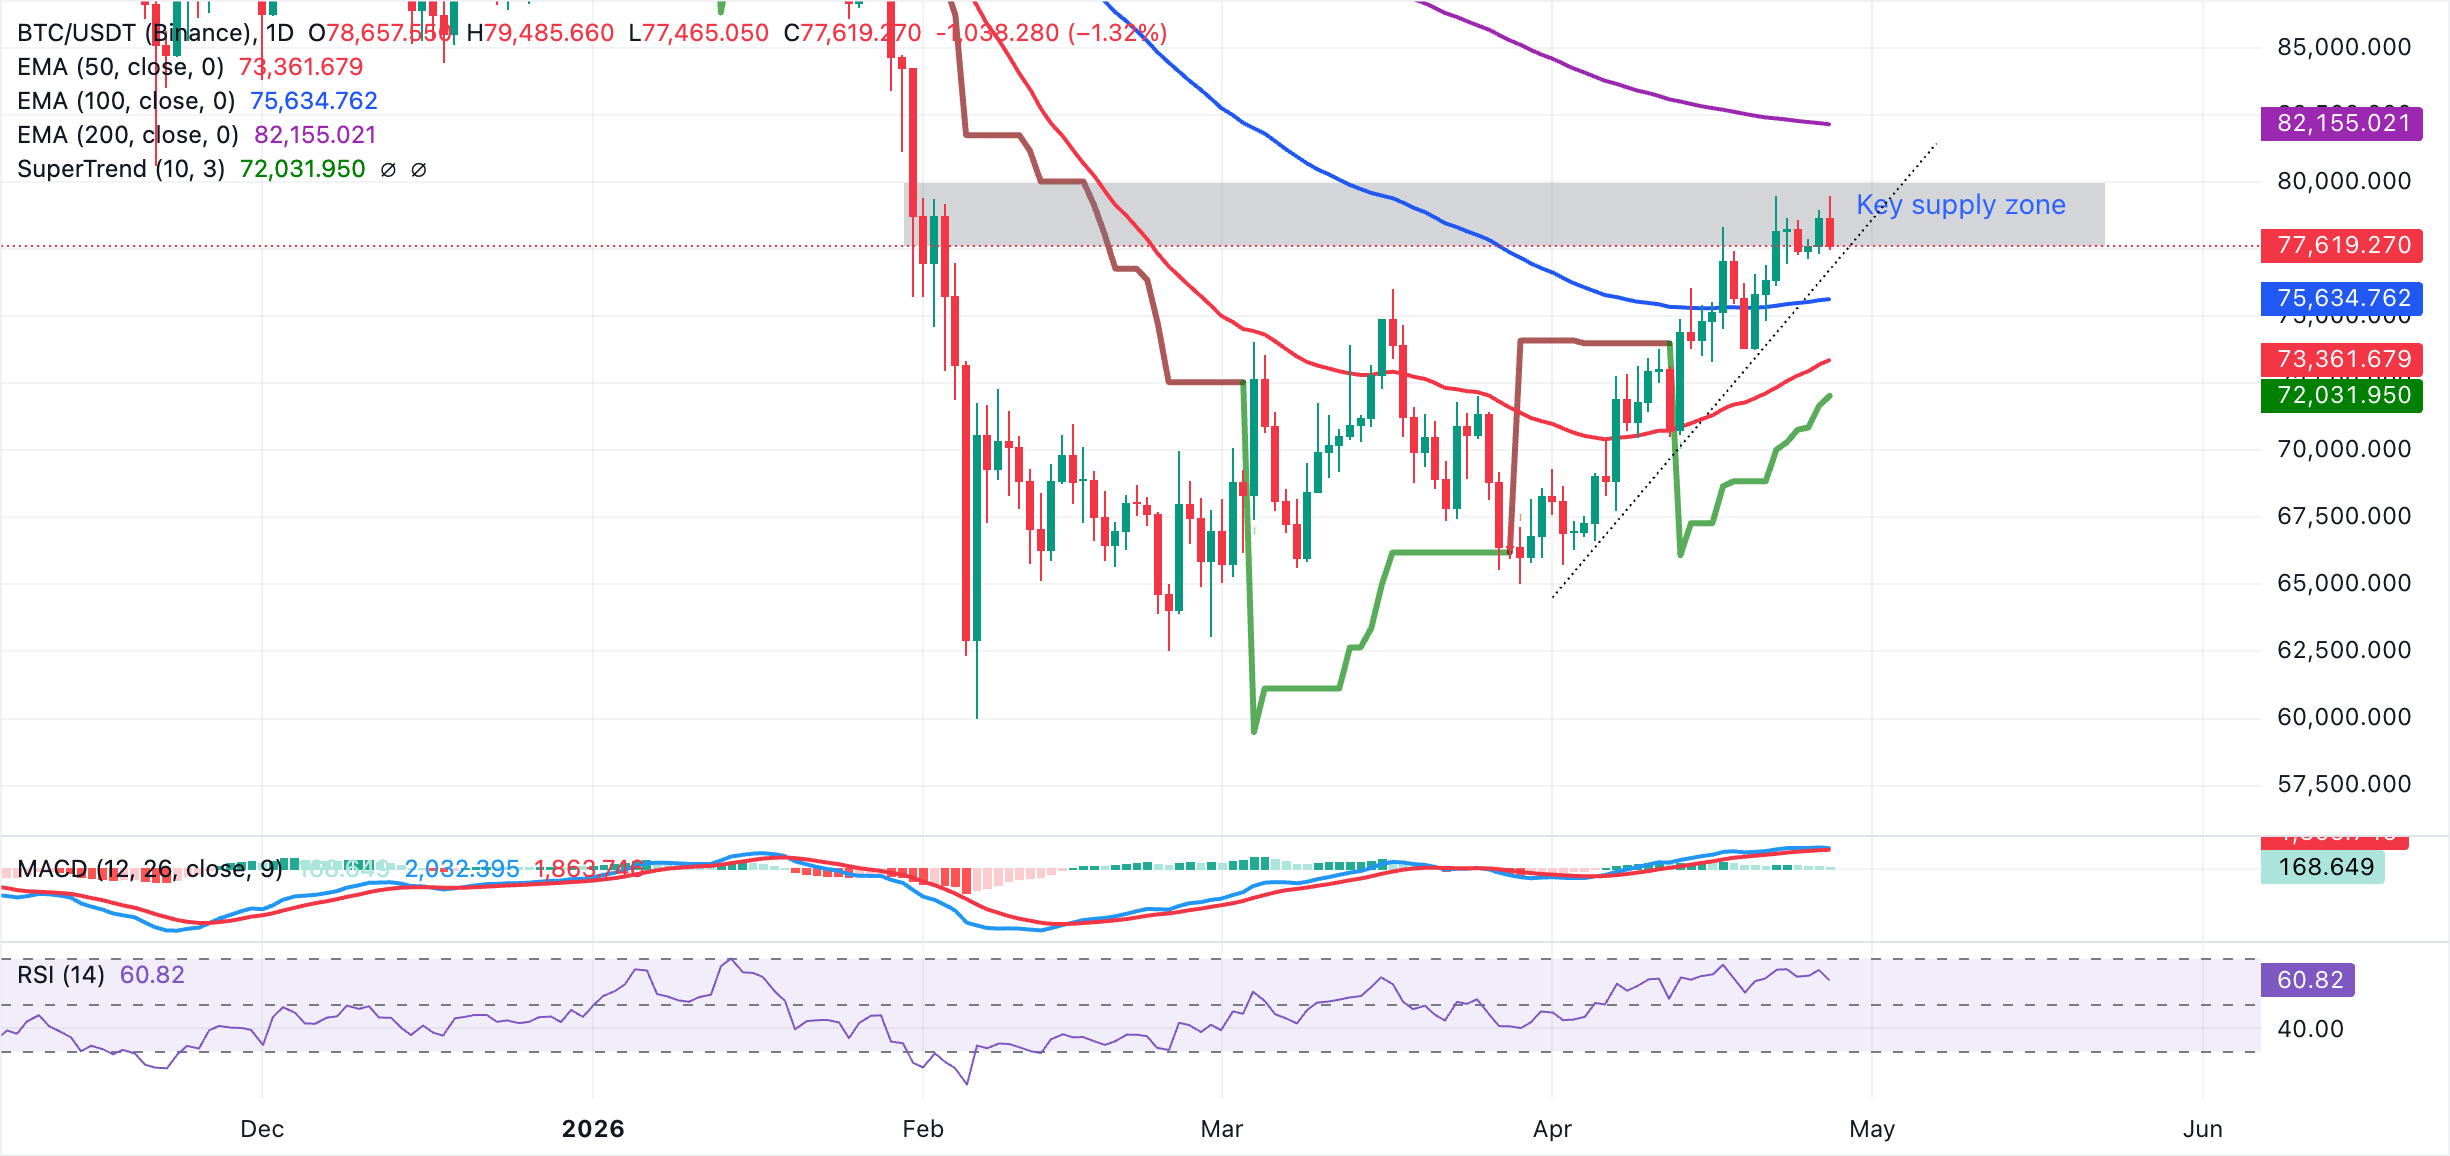
On the topside, the 200-day EMA at $82,155 is the next significant resistance, and a break above it would open the door to a stronger continuation of the broader uptrend. On the downside, initial support is seen at the rising trendline around $76,897, followed by the 100-day EMA at $75,635 and the 50-day EMA at $73,362. A deeper pullback could then test the SuperTrend support zone near $72,031, where dip-buying interest would be expected to emerge if the bullish structure is to remain intact.
Altcoins technical outlook: Ethereum and XRP pause rebound
Ethereum trades at $2,310, as bulls push back above the descending resistance trendline, now turned support, near $2,304. The smart contract token holds above the 50-day EMA around $2,241, tilting the near-term bias mildly bullish despite the broader corrective backdrop. Momentum is mixed, with the RSI hovering just above the midline at 50 on the daily chart and the MACD histogram remaining in negative territory, suggesting upside attempts are constructive but not yet impulsive.
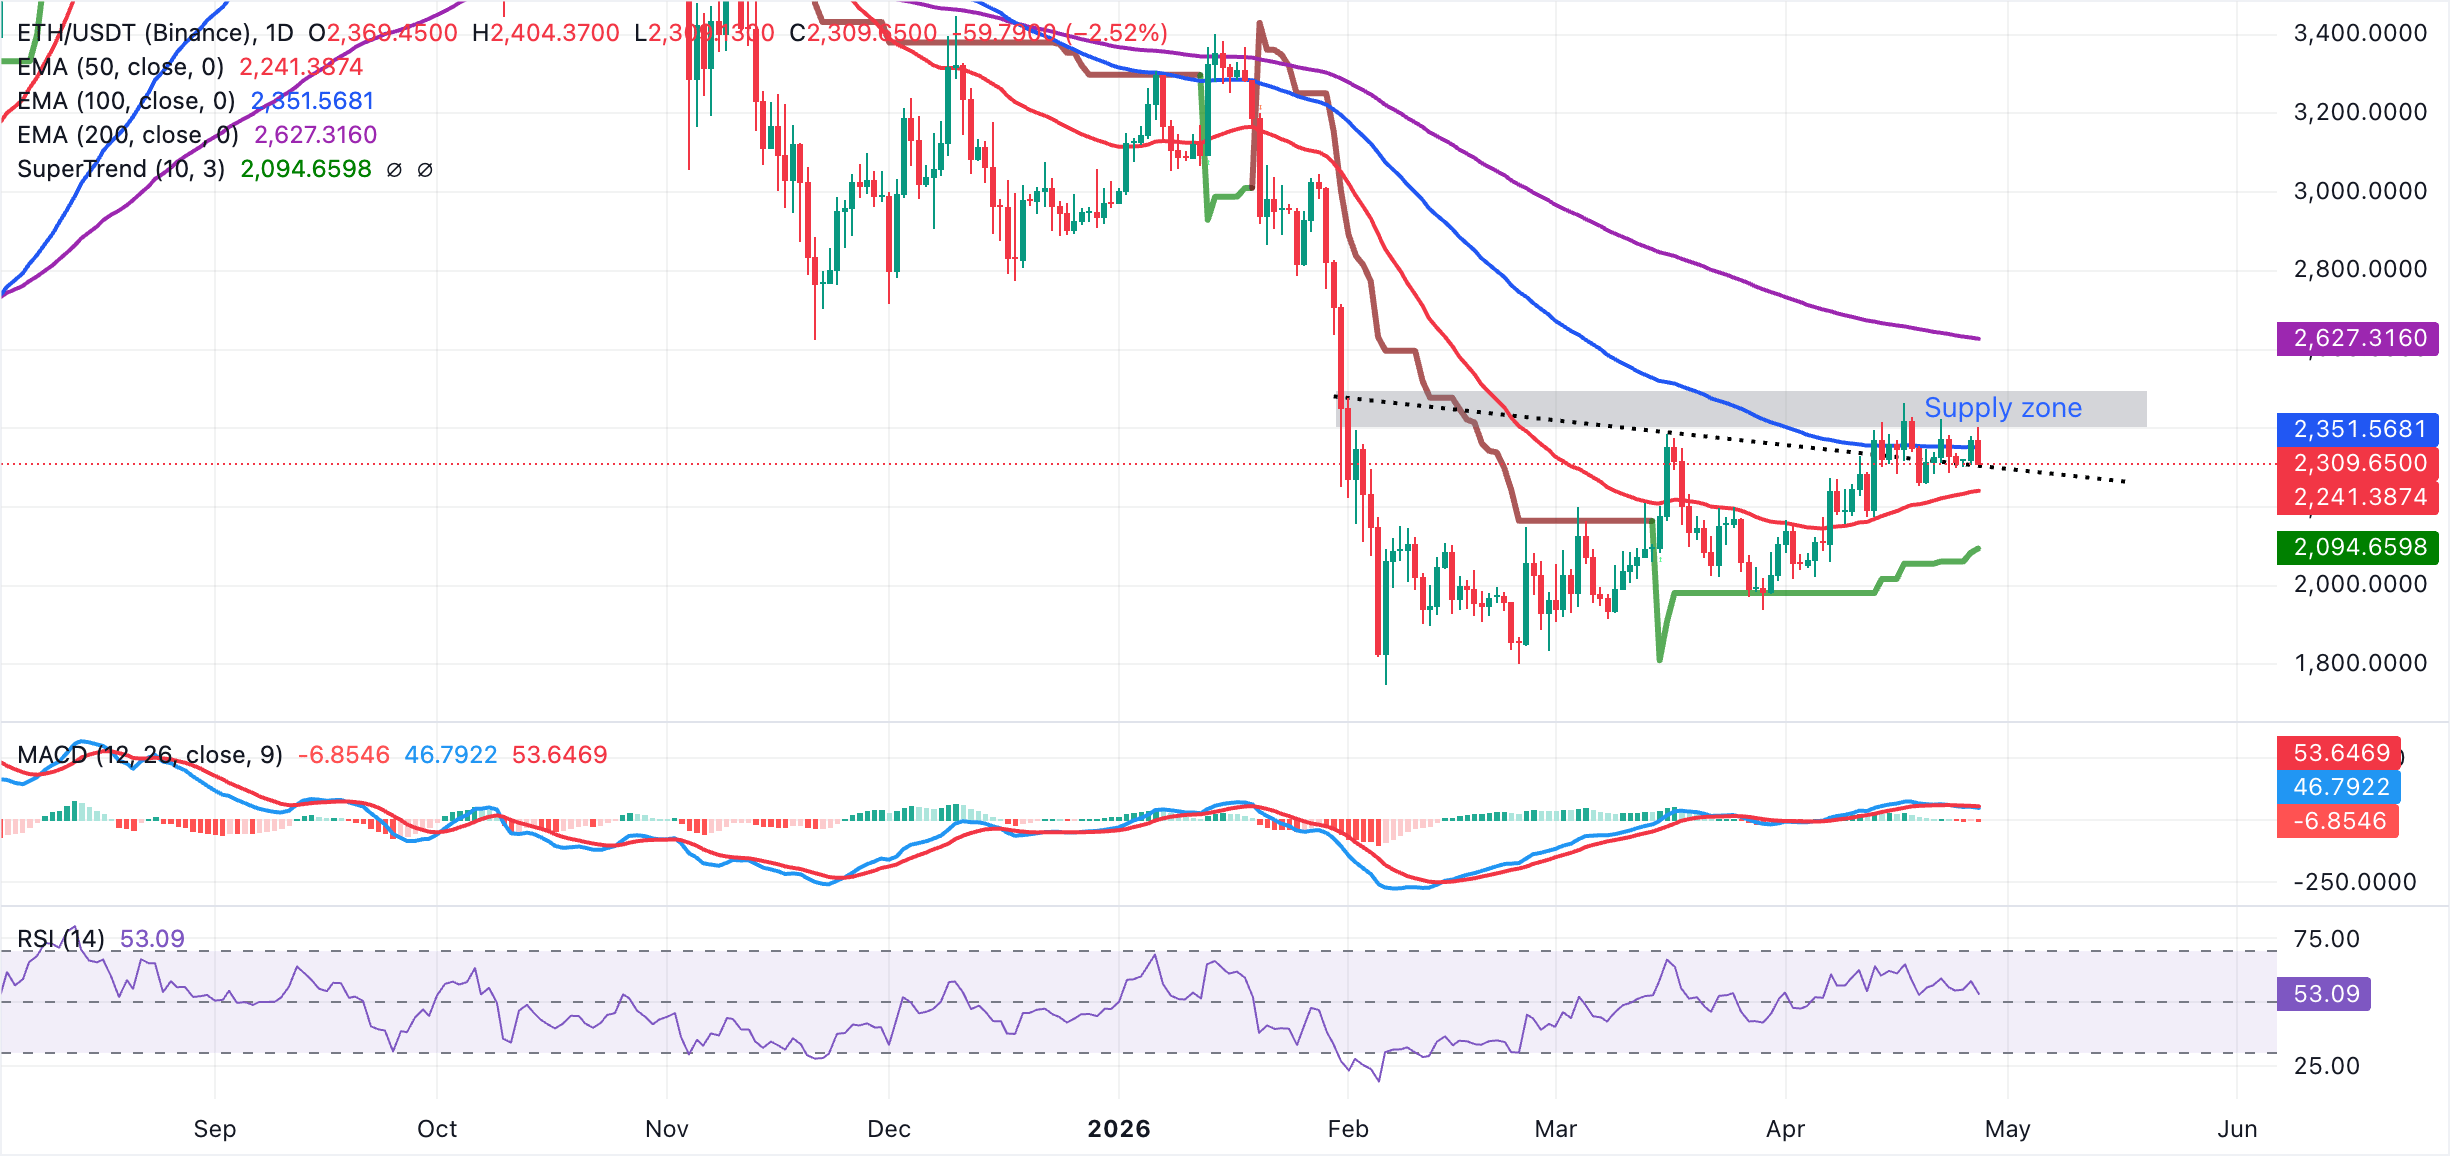
On the topside, initial resistance aligns with the 100-day EMA at roughly $2,352, with a sustained break opening the way toward the 200-day EMA near $2,627. On the downside, immediate support is seen around the broken trendline zone just under the market at $2,304, followed by the 50-day EMA at $2,241. A deeper pullback would expose the SuperTrend support region near $2,095.
As for XRP, the price is clinging just above the 50-day EMA at $1.42 while remaining capped beneath the descending trendline break level at $1.43 and, more importantly, the 100-day and 200-day EMAs at $1.53 and $1.78. This configuration keeps the broader tone capped despite a still mildly constructive backdrop, as the RSI holds near a neutral 52 on the daily chart. Moreover, the MACD histogram stays marginally positive on the same chart but has been losing momentum in recent sessions.
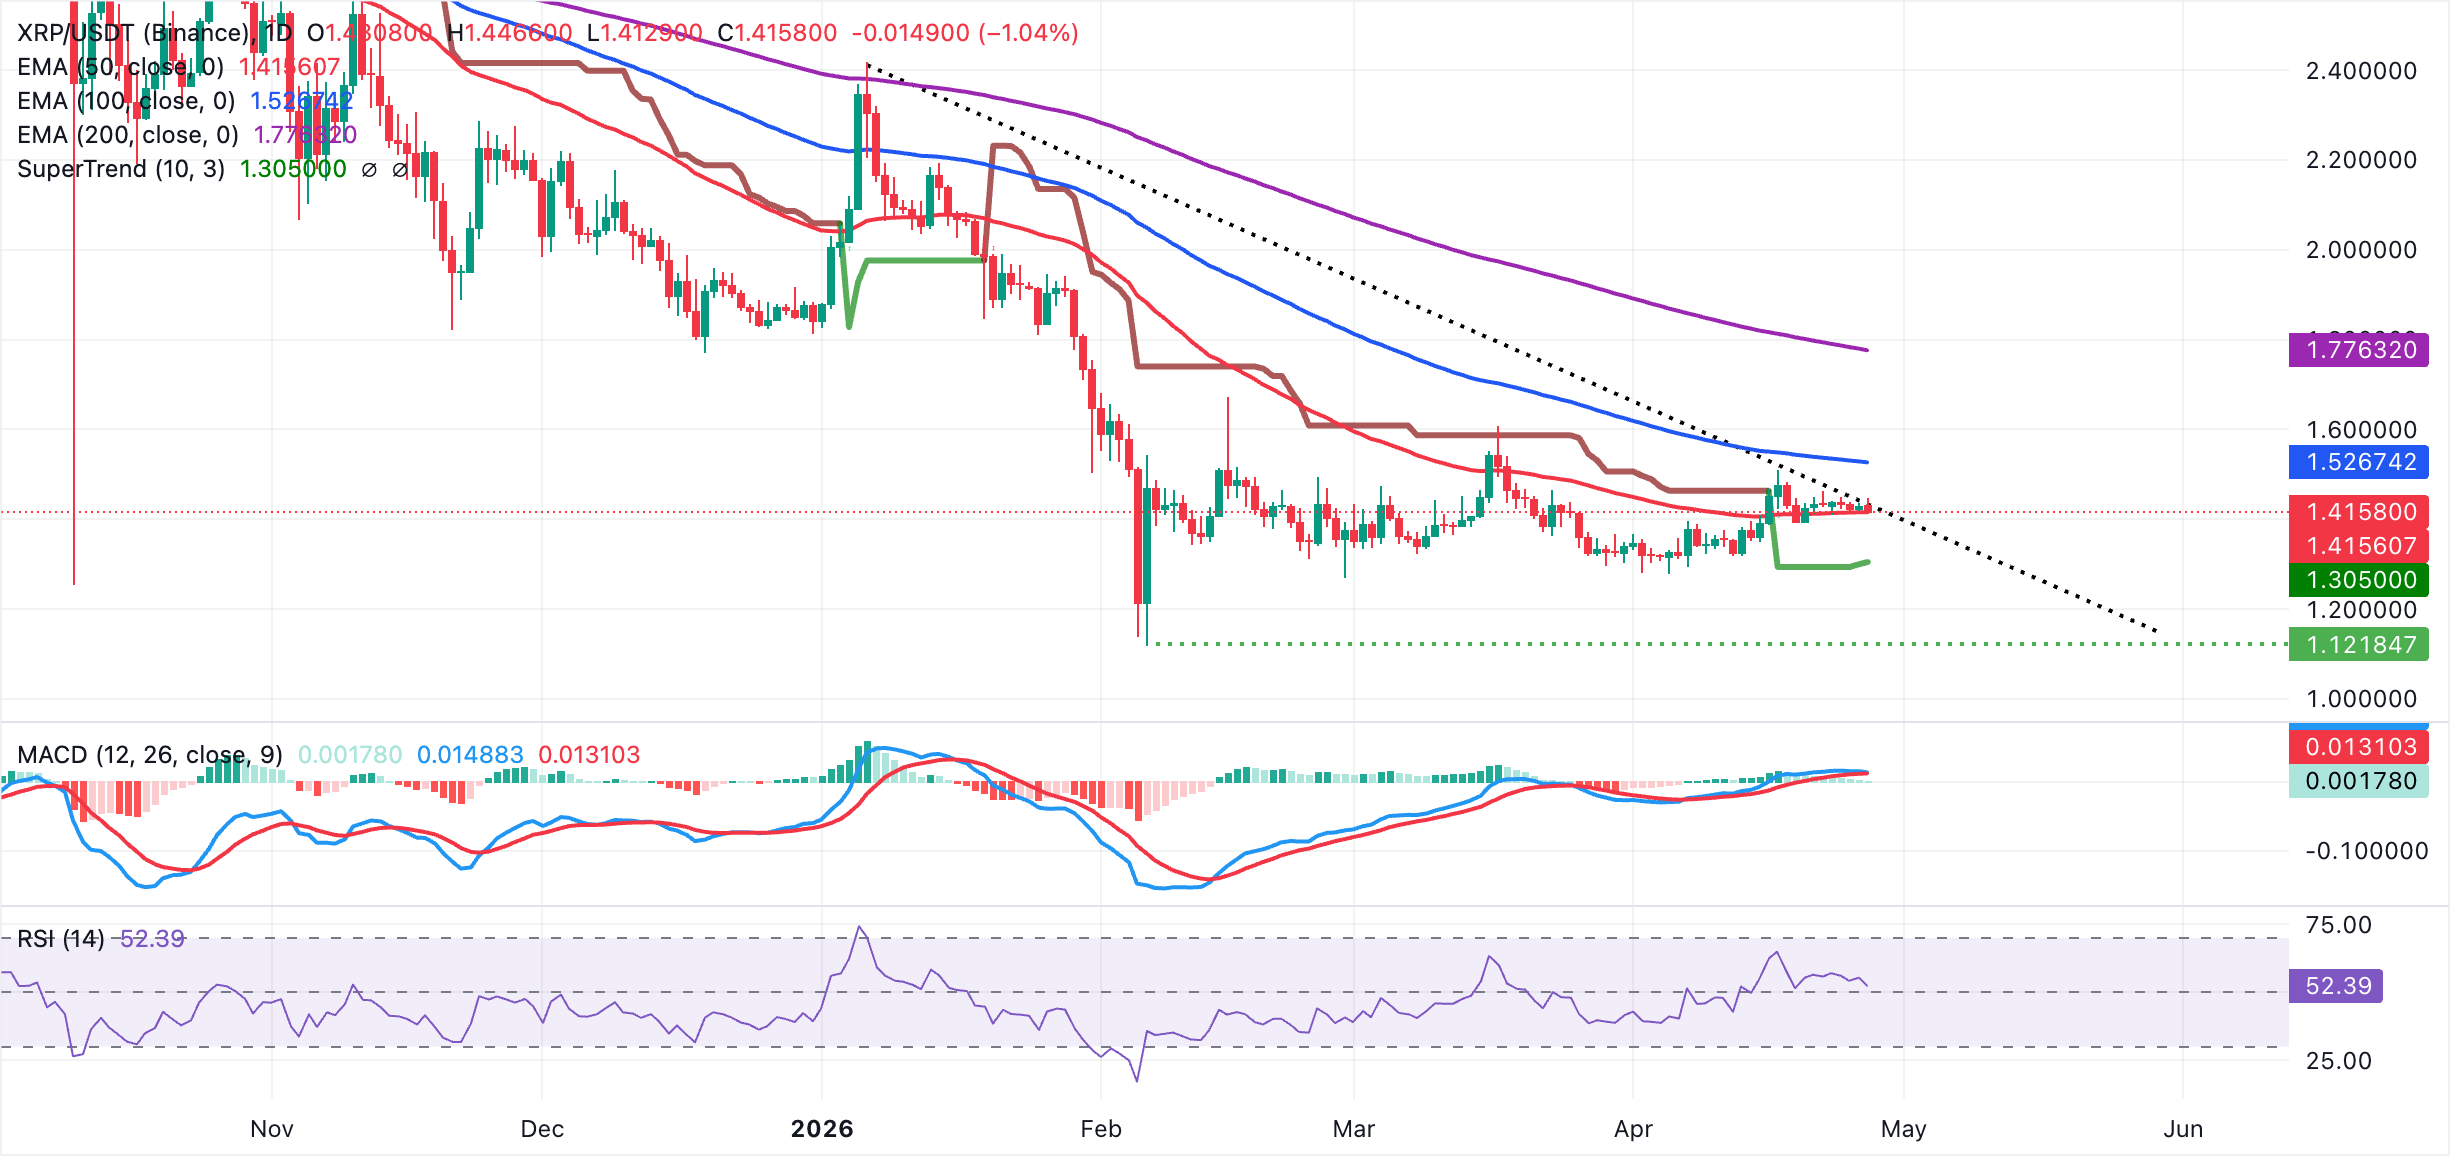
On the downside, immediate support is aligned with the 50-day EMA at $1.42. A daily close back below this pivot would expose the SuperTrend line as the next notable floor near $1.31. On the topside, initial resistance is seen at the former descending trendline break area around $1.43, and only a sustained move above that barrier would open the way toward the 100-day EMA at $1.53.
(The technical analysis of this story was written with the help of an AI tool.)
Bitcoin, altcoins, stablecoins FAQs
Bitcoin is the largest cryptocurrency by market capitalization, a virtual currency designed to serve as money. This form of payment cannot be controlled by any one person, group, or entity, which eliminates the need for third-party participation during financial transactions.
Altcoins are any cryptocurrency apart from Bitcoin, but some also regard Ethereum as a non-altcoin because it is from these two cryptocurrencies that forking happens. If this is true, then Litecoin is the first altcoin, forked from the Bitcoin protocol and, therefore, an “improved” version of it.
Stablecoins are cryptocurrencies designed to have a stable price, with their value backed by a reserve of the asset it represents. To achieve this, the value of any one stablecoin is pegged to a commodity or financial instrument, such as the US Dollar (USD), with its supply regulated by an algorithm or demand. The main goal of stablecoins is to provide an on/off-ramp for investors willing to trade and invest in cryptocurrencies. Stablecoins also allow investors to store value since cryptocurrencies, in general, are subject to volatility.
Bitcoin dominance is the ratio of Bitcoin's market capitalization to the total market capitalization of all cryptocurrencies combined. It provides a clear picture of Bitcoin’s interest among investors. A high BTC dominance typically happens before and during a bull run, in which investors resort to investing in relatively stable and high market capitalization cryptocurrency like Bitcoin. A drop in BTC dominance usually means that investors are moving their capital and/or profits to altcoins in a quest for higher returns, which usually triggers an explosion of altcoin rallies.

يعتمد أكثر من مليون مستخدم على FXStreet للحصول على بيانات سوقية لحظية، وأدوات رسوم بيانية، ورؤى خبراء، وأخبار الفوركس. يساعد تقويمهم الاقتصادي الشامل والندوات التعليمية عبر الويب المتداولين على البقاء على اطلاع واتخاذ قرارات محسوبة. لدى FXStreet فريق يضم حوالي 60 محترفًا موزعين بين مقر برشلونة ومناطق عالمية مختلفة.
اقرأ المزيد


