
Crypto Today: Bitcoin, Ethereum, XRP test rebound strength as focus shifts to Fed minutes
بواسطة John Isige
تم التحديث: 20 May 2026


المقالات الشائعة

Bitcoin (BTC) preserves its $77,000 support following the recent drawdown from its May peak around $82,500.
- Bitcoin steadies above $77,000 support as market participants await the release of the Fed minutes from its April meeting.
- Ethereum gains traction as buyers step in at the $2,100 level, bolstered by stable futures Open Interest.
- XRP rises above $1.35 support amid growing retail demand.
Bitcoin (BTC) preserves its $77,000 support following the recent drawdown from its May peak around $82,500. The broader cryptocurrency market, including altcoins such as Ethereum (ETH) and Ripple (XRP), shows subtle signs of recovery, with ETH steadily above $2,100 and XRP rebounding from support at $1.35.
All eyes on Fed minutes
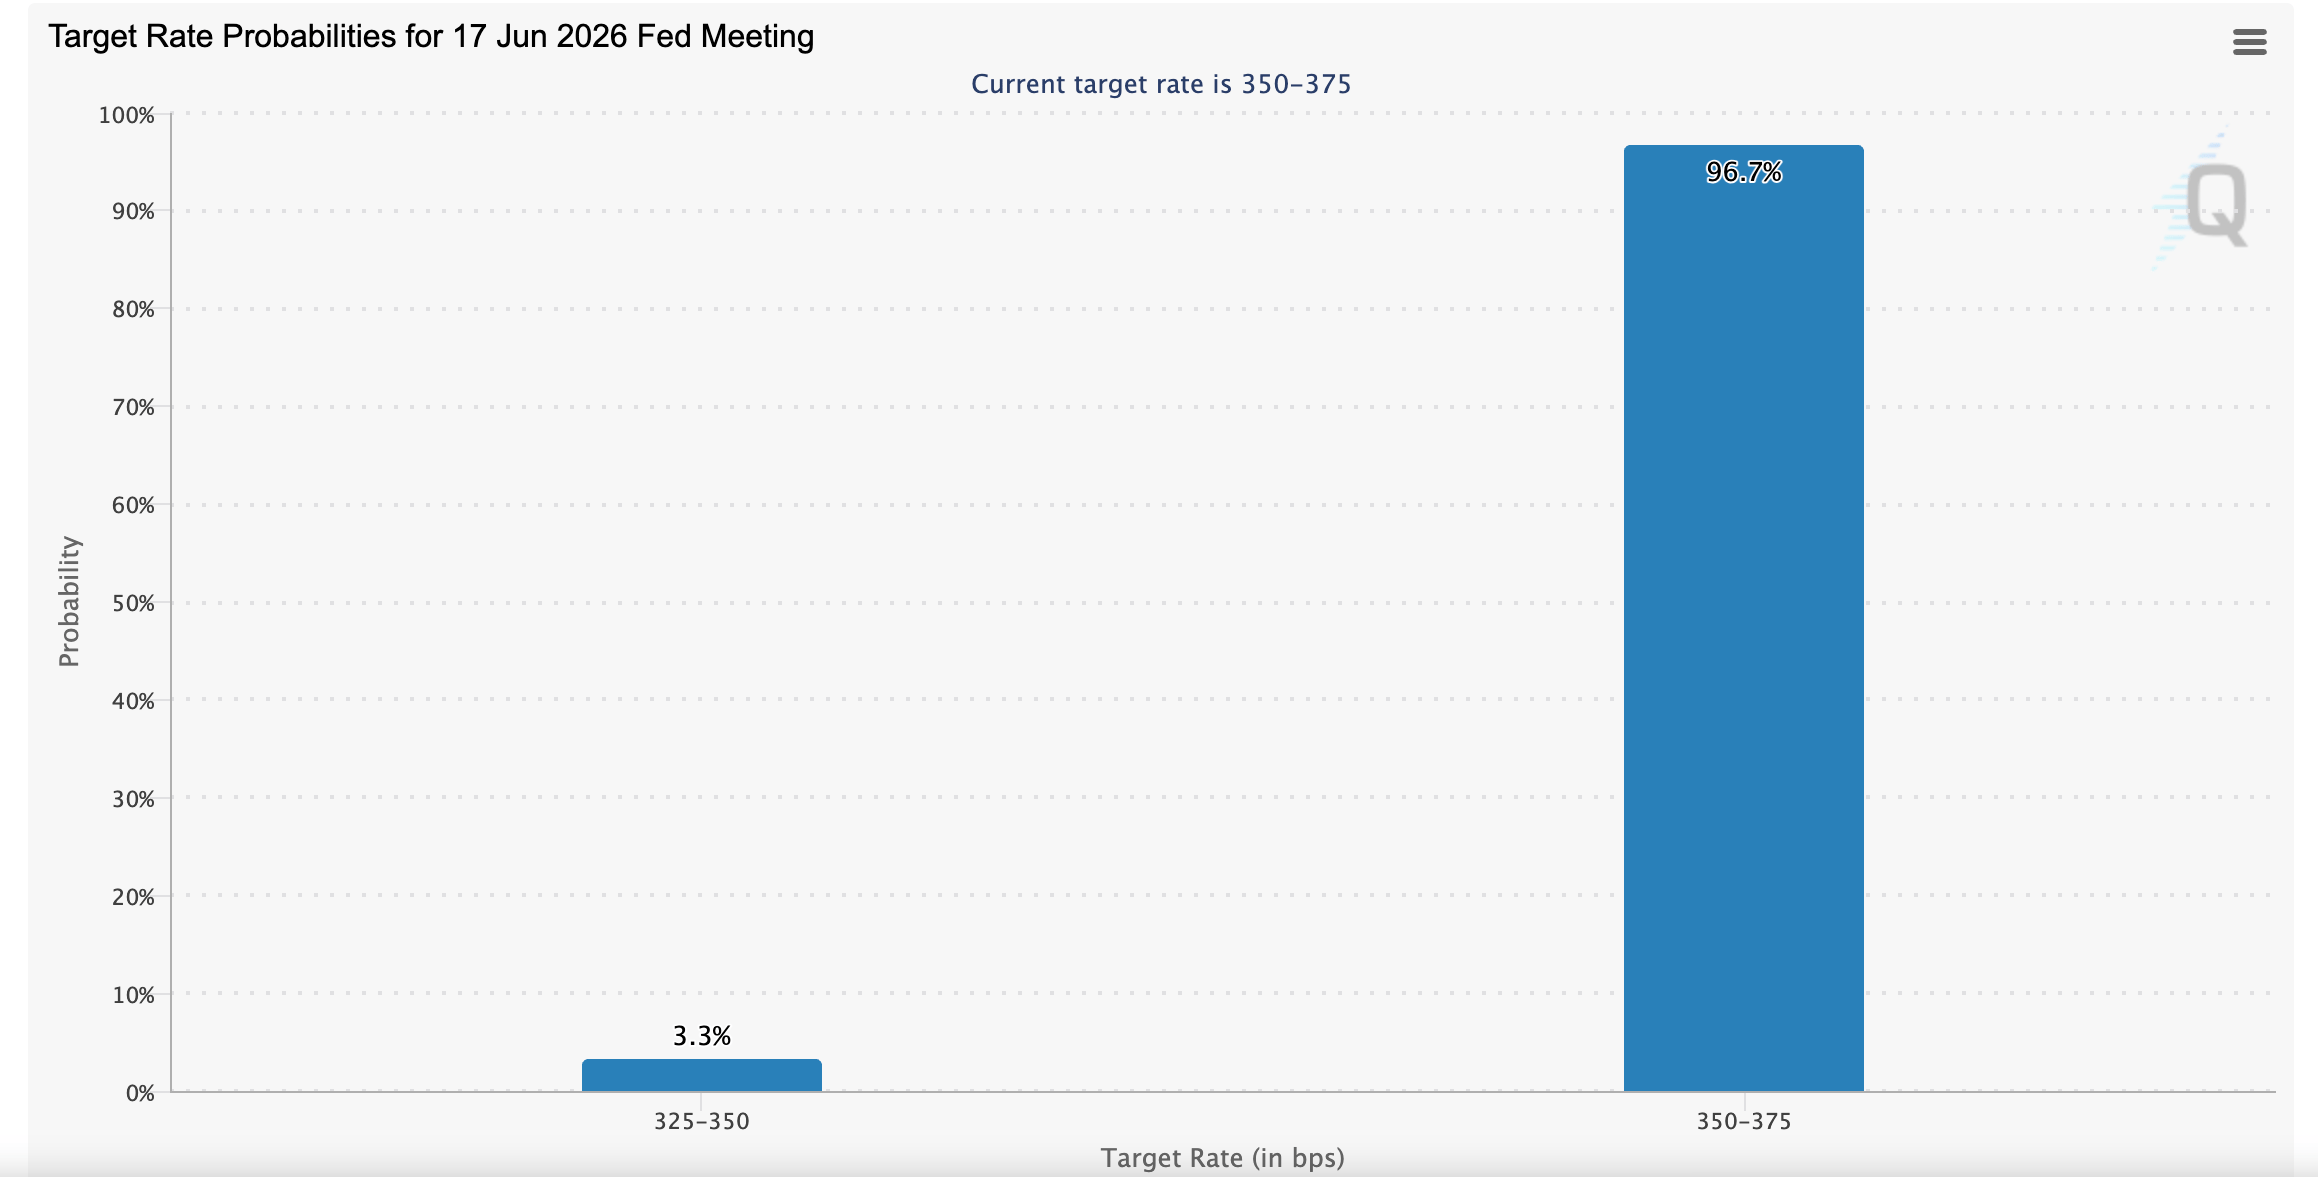
The Federal Reserve (Fed) will release the minutes of the April Federal Open Market Committee (FOMC) meeting at 18:00 GMT on Wednesday. Although interest rates remained unchanged in the 3.50%-3.75% range, market participants will be watching out for sentiment from hawkish committee members, especially after April’s US inflation data came in hotter than expected.
Another standout of the minutes will likely be the stance taken by the Fed officials on inflation and policy direction, especially under the new Chair Kevin Warsh.
Market participants are already pricing in a 96.7% probability that the Fed will leave interest rates unchanged in the 3.50%-3.75% range in the next review cycle scheduled for June 17. Moreover, rising inflation and growing macroeconomic uncertainty due to the US-Iran conflict raise the odds of a rate hike by the end of 2026.
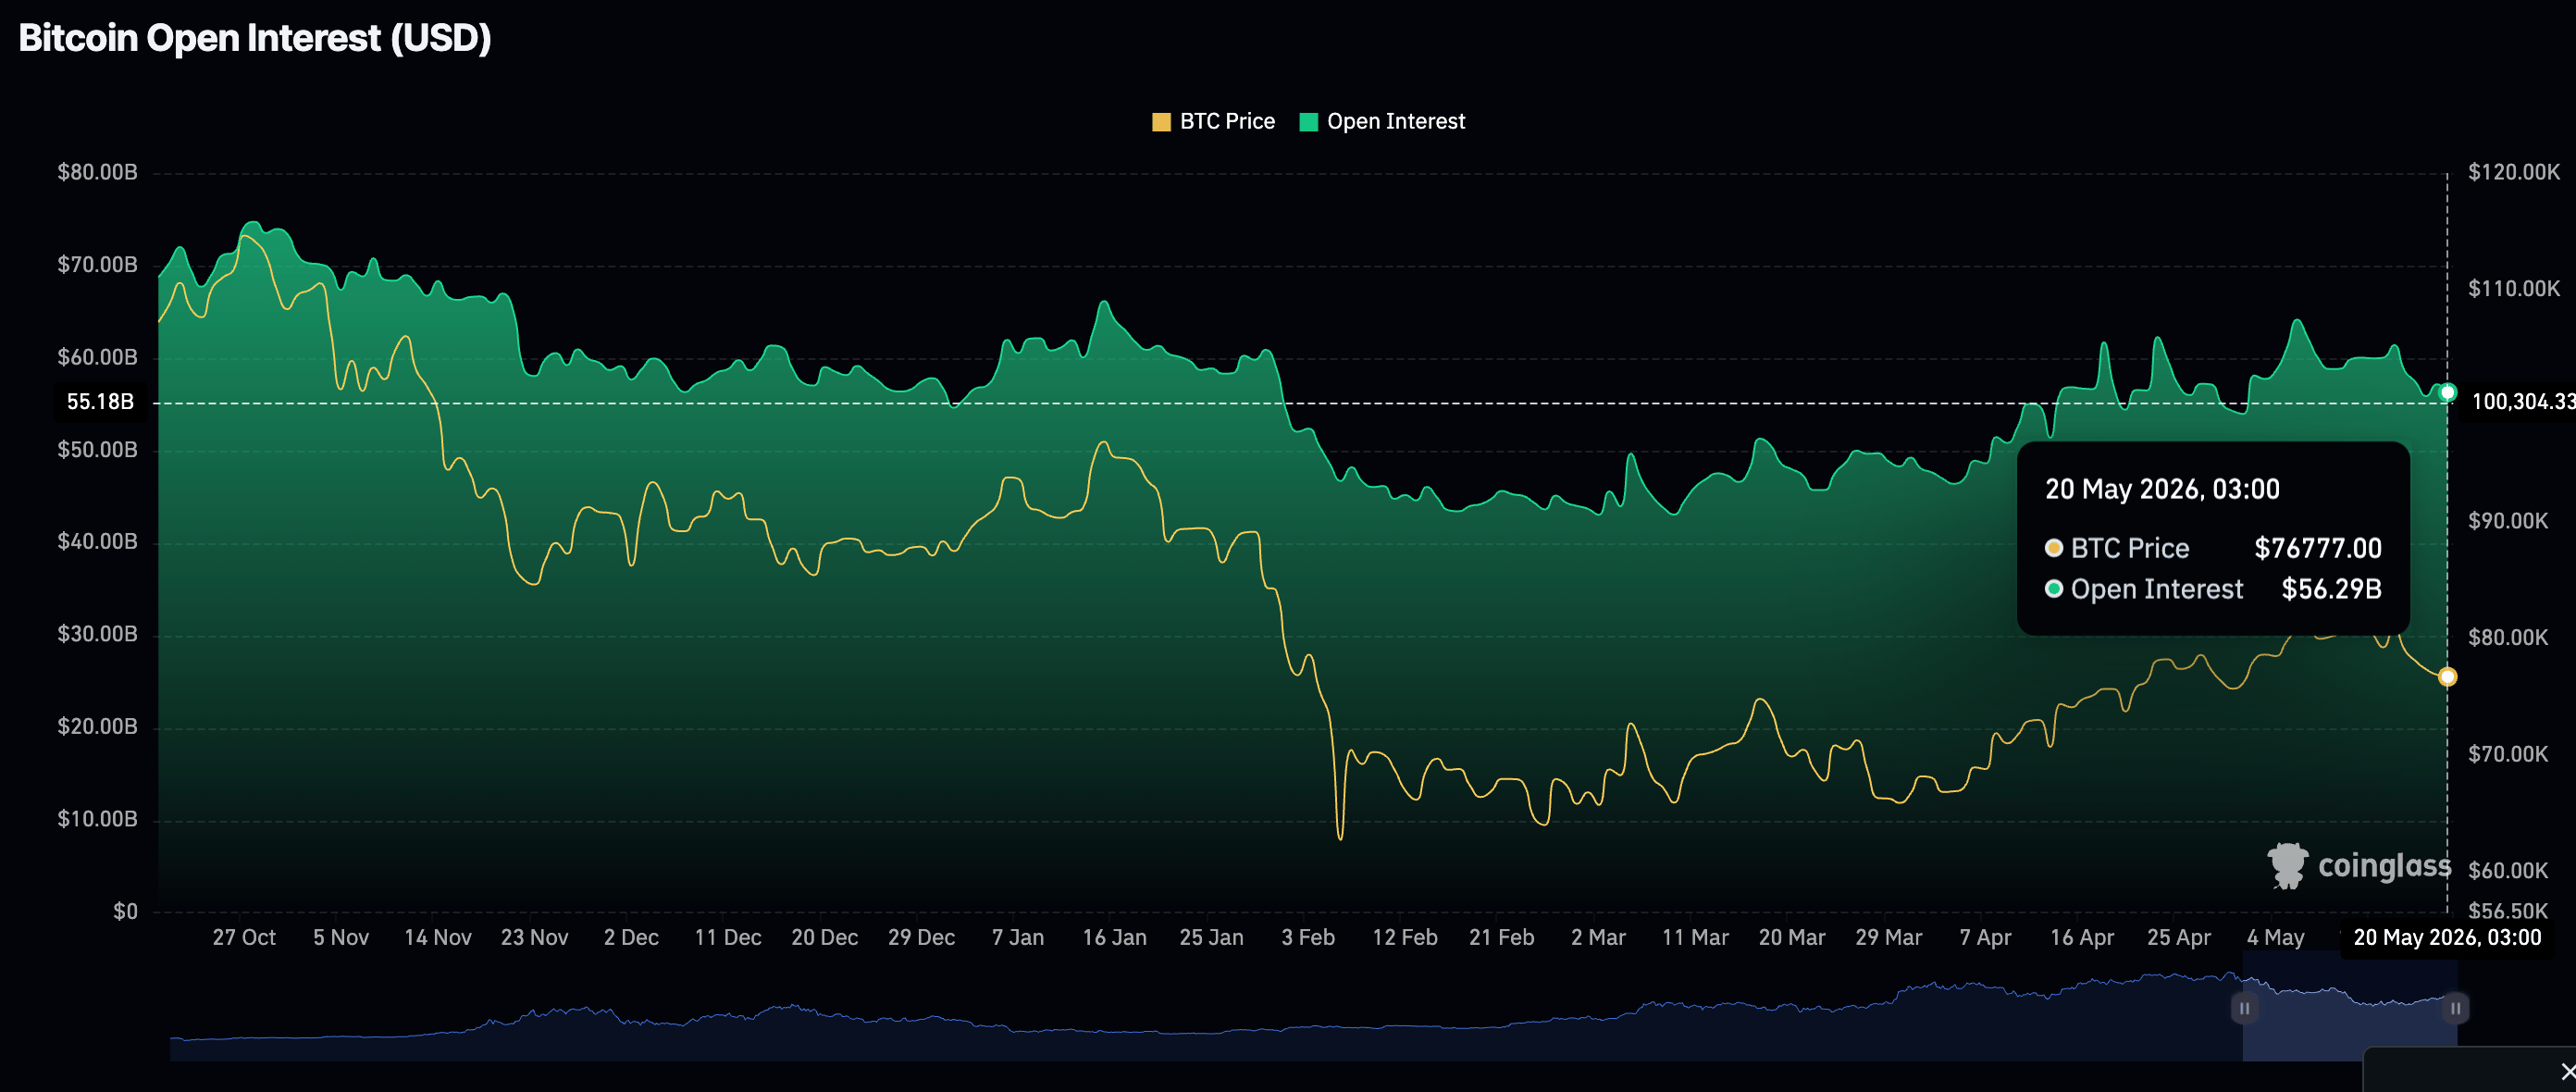
Meanwhile, retail demand for Bitcoin appears to be waning, as evidenced by a drop in futures Open Interest (OI) to $56.29 billion on Wednesday, down from $57.17 billion the day before and significantly below the monthly peak of $64.17 billion reached on May 6. Should OI presently decline, it would suggest a lack of conviction in BTC’s ability to uphold short-term gains, as traders refrain from opening new positions.
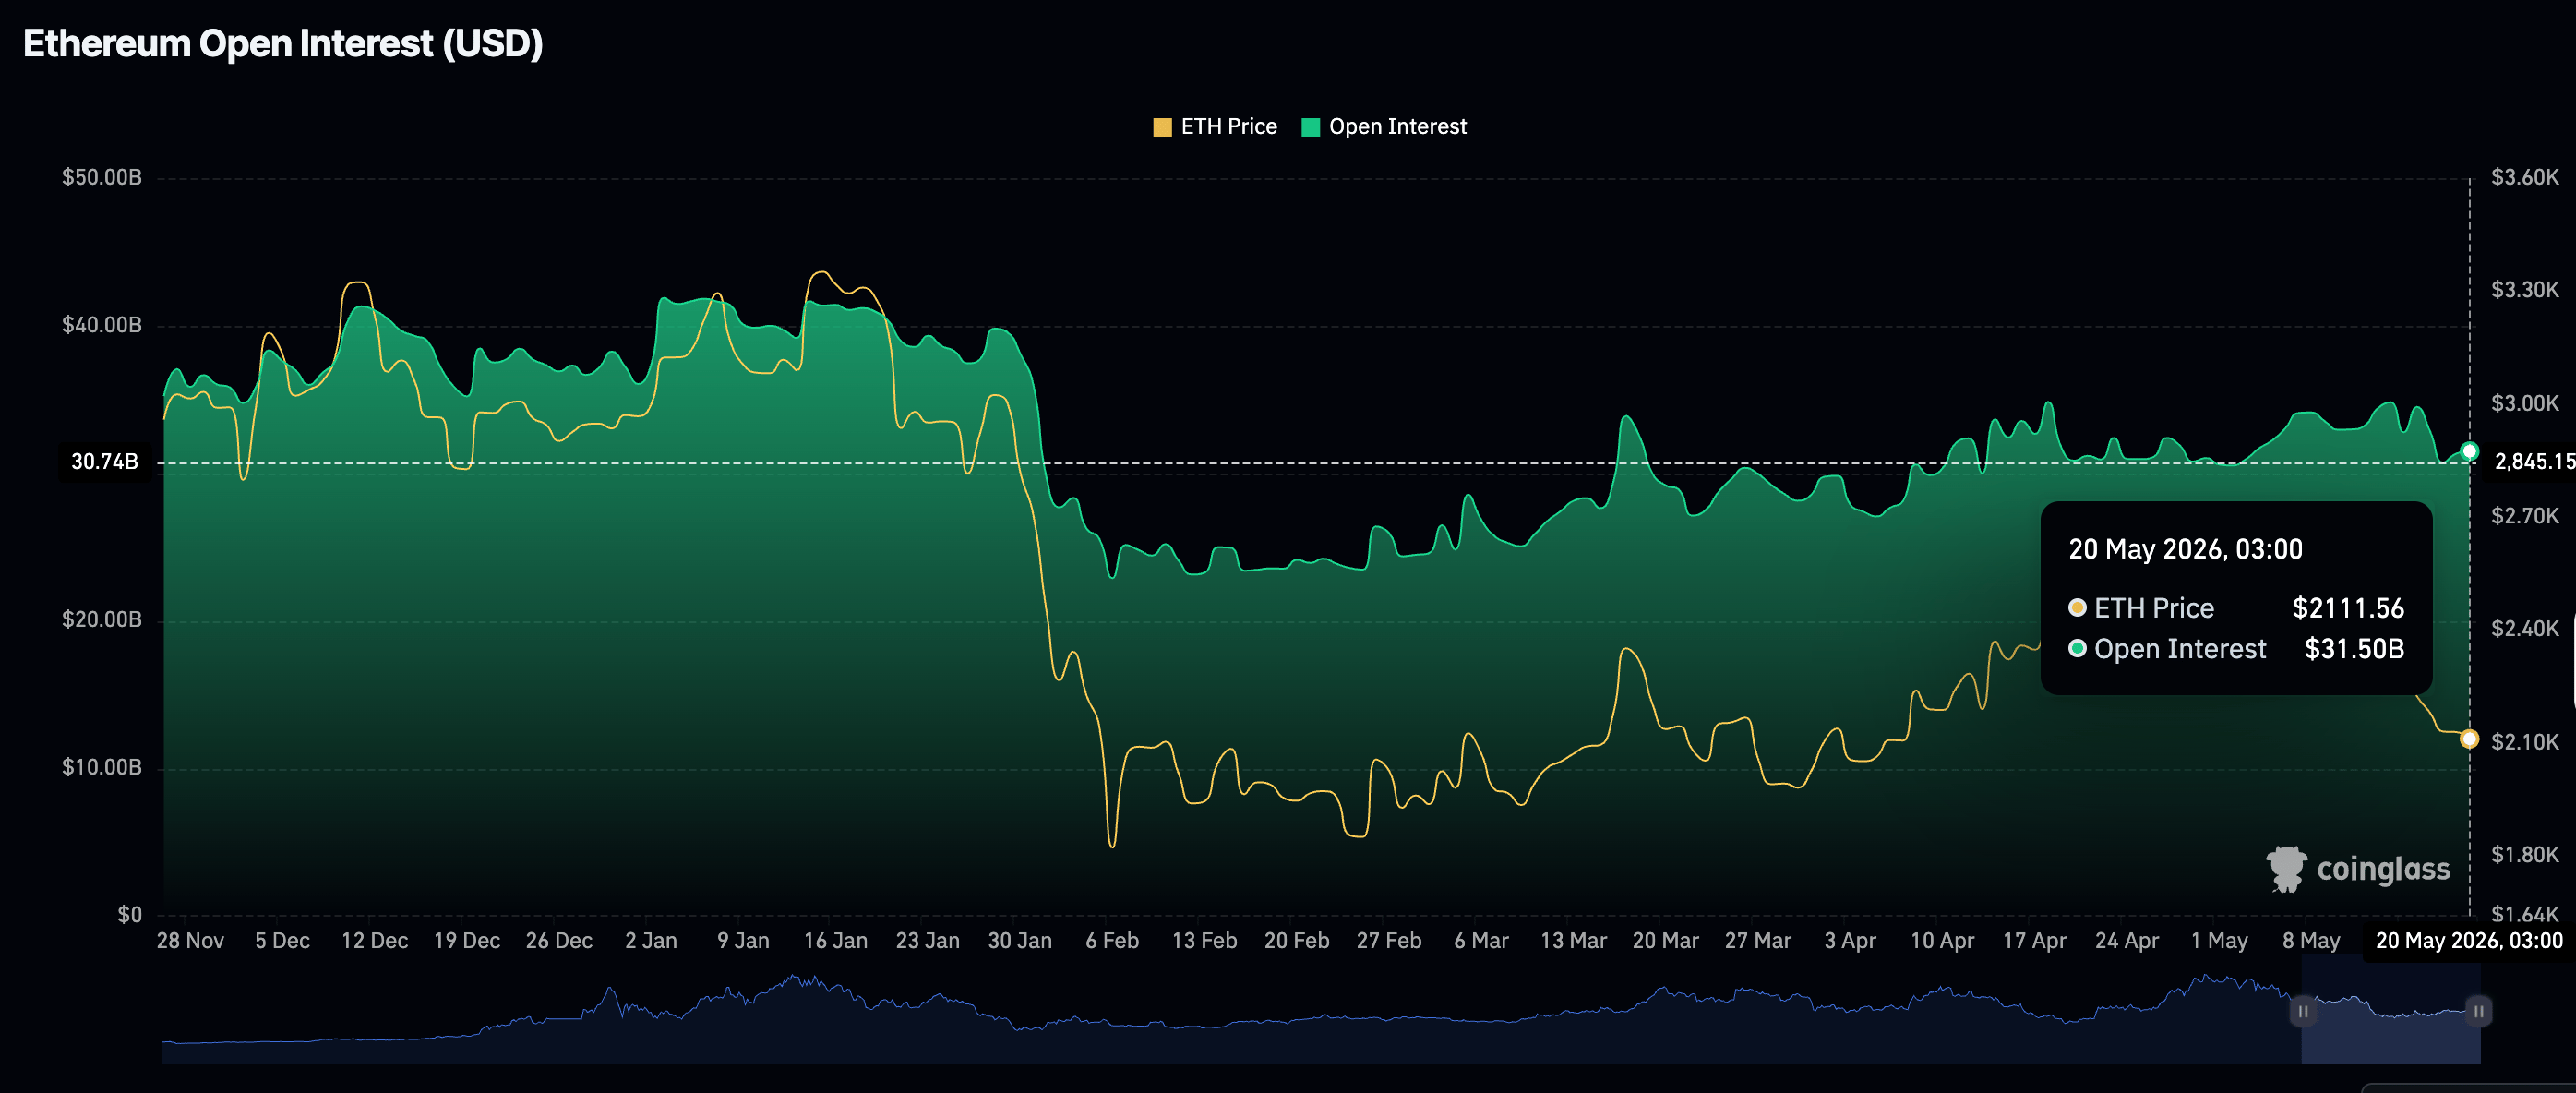
Ethereum derivatives, on the other hand, have logged a mild increase with the OI reaching $31.50 billion on Wednesday, up from $31.34 billion the previous day and $30.73 billion on Monday. Appetite for ETH perpetual futures contracts should continue to grow exponentially to support price recovery.
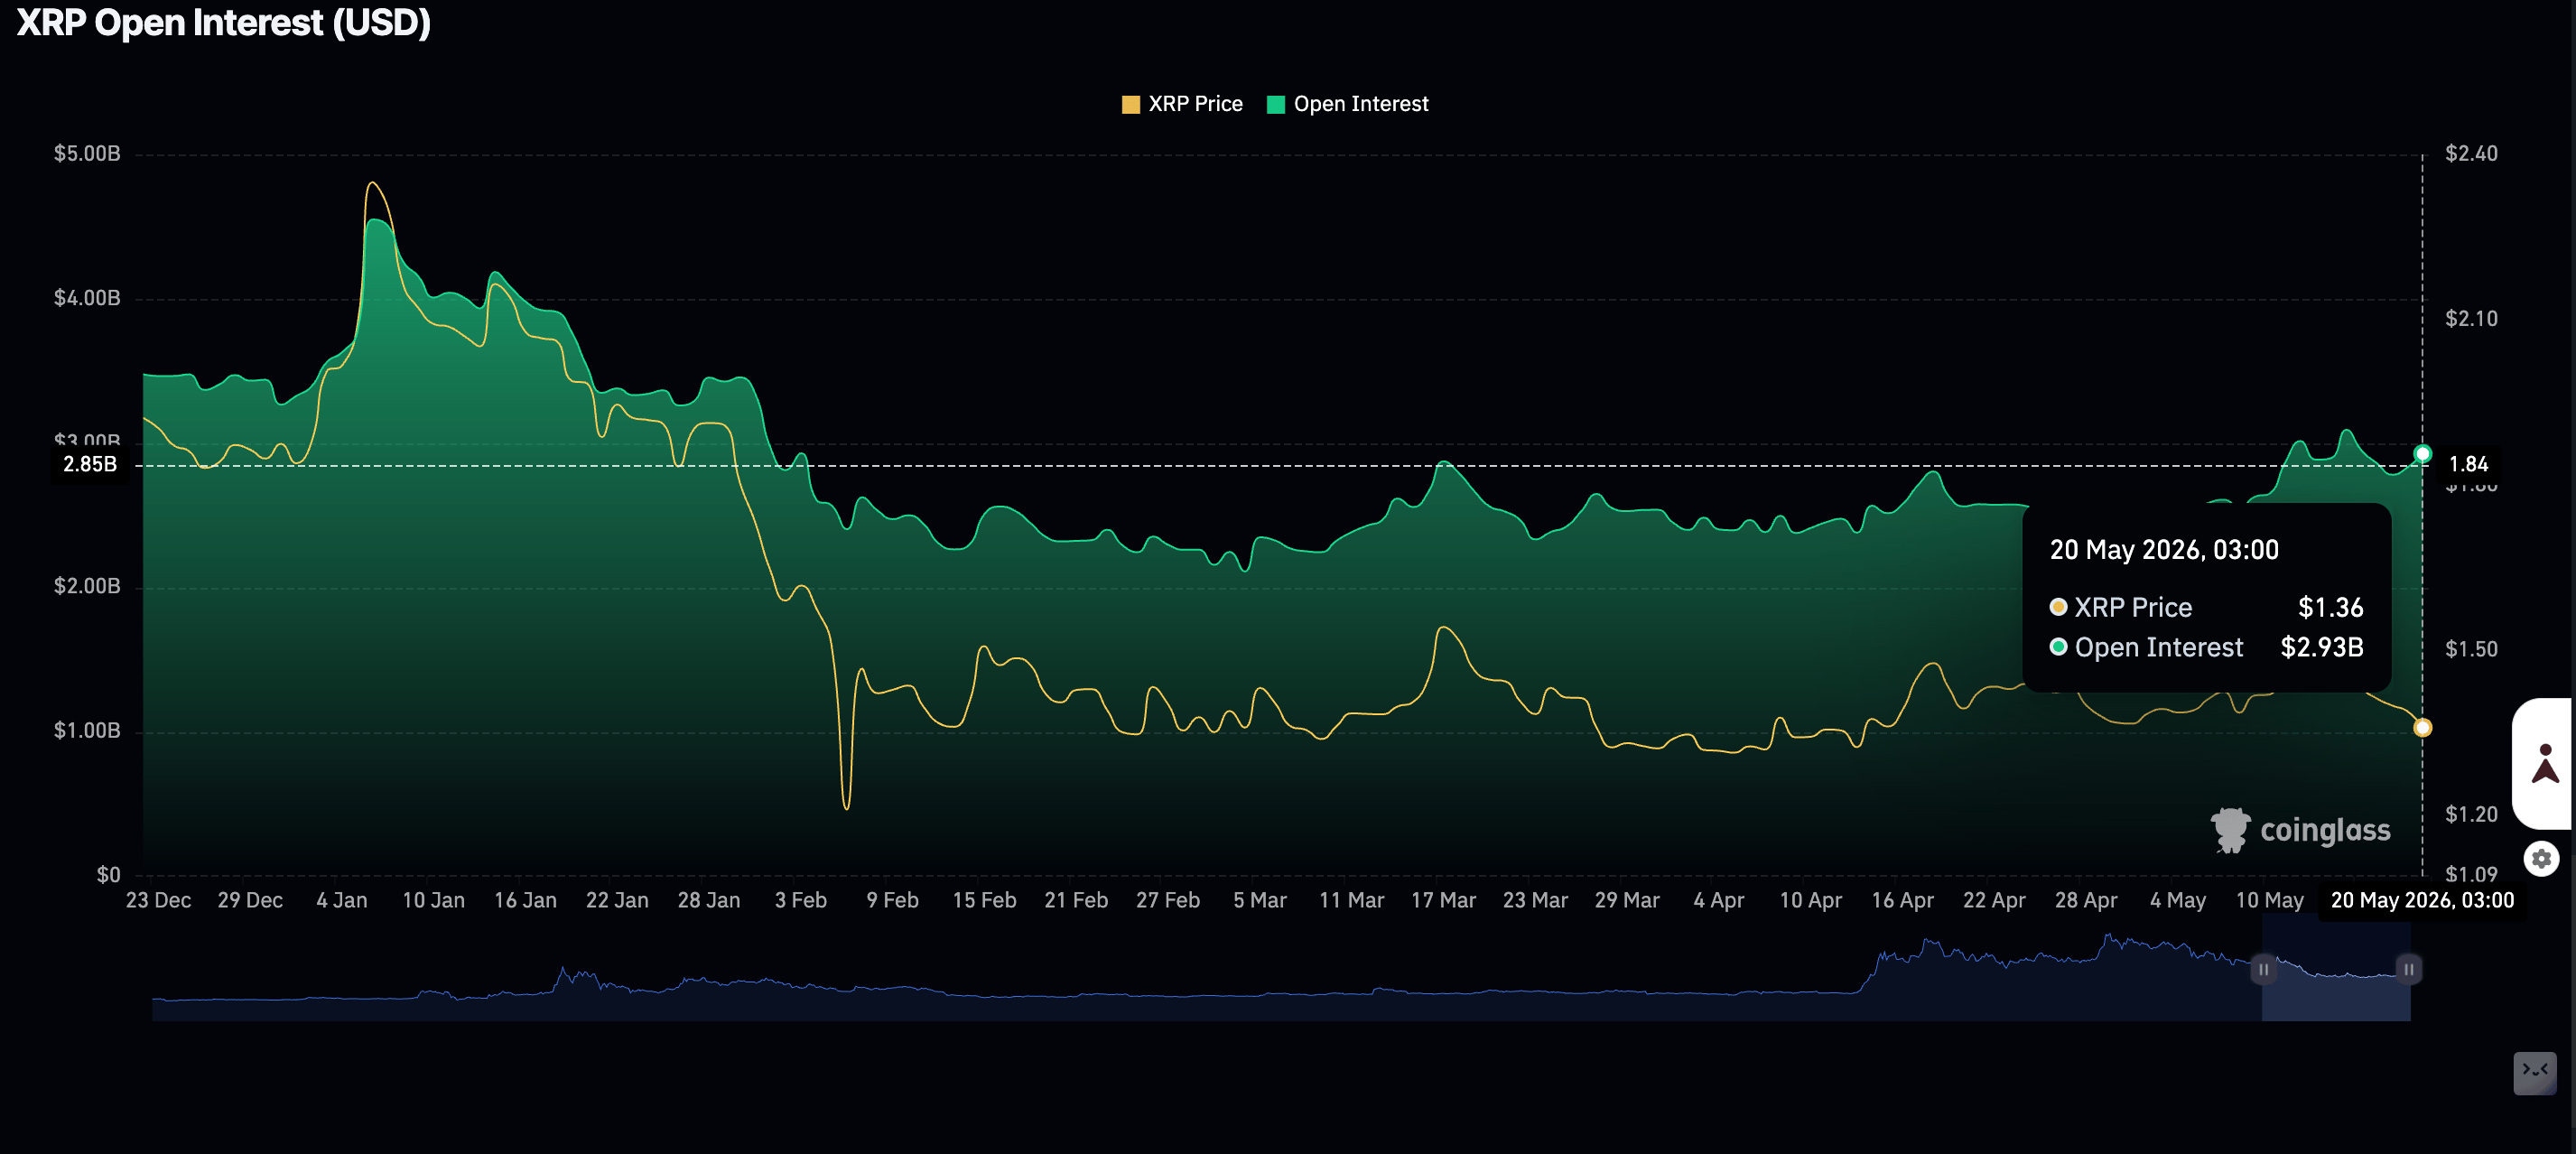
Retail interest in XRP remains steady with futures OI averaging $2.93 billion on Wednesday, up from $2.83 billion the day before. A further increase in the OI could help steady the price of XRP toward the pivotal $1.40 level.
Price Analysis: Bitcoin bulls seek to regain control
Bitcoin trades at $77,274, capped below the 200-day Exponential Moving Average (EMA) at $81,644, keeping the broader tone neutral-to-bearish despite price holding above a rising support structure. A tight cluster of the 100-day EMA at $76,878 and the 50-day EMA at $76,761 sits just underneath spot, suggesting nearby dynamic support.
The negative Moving Average Convergence Divergence (MACD) histogram on the daily chart and a sub-50 Relative Strength Index (RSI) hint at still-fragile momentum, partially offset by an oversold Money Flow Index (MFI) that points to some downside fatigue.
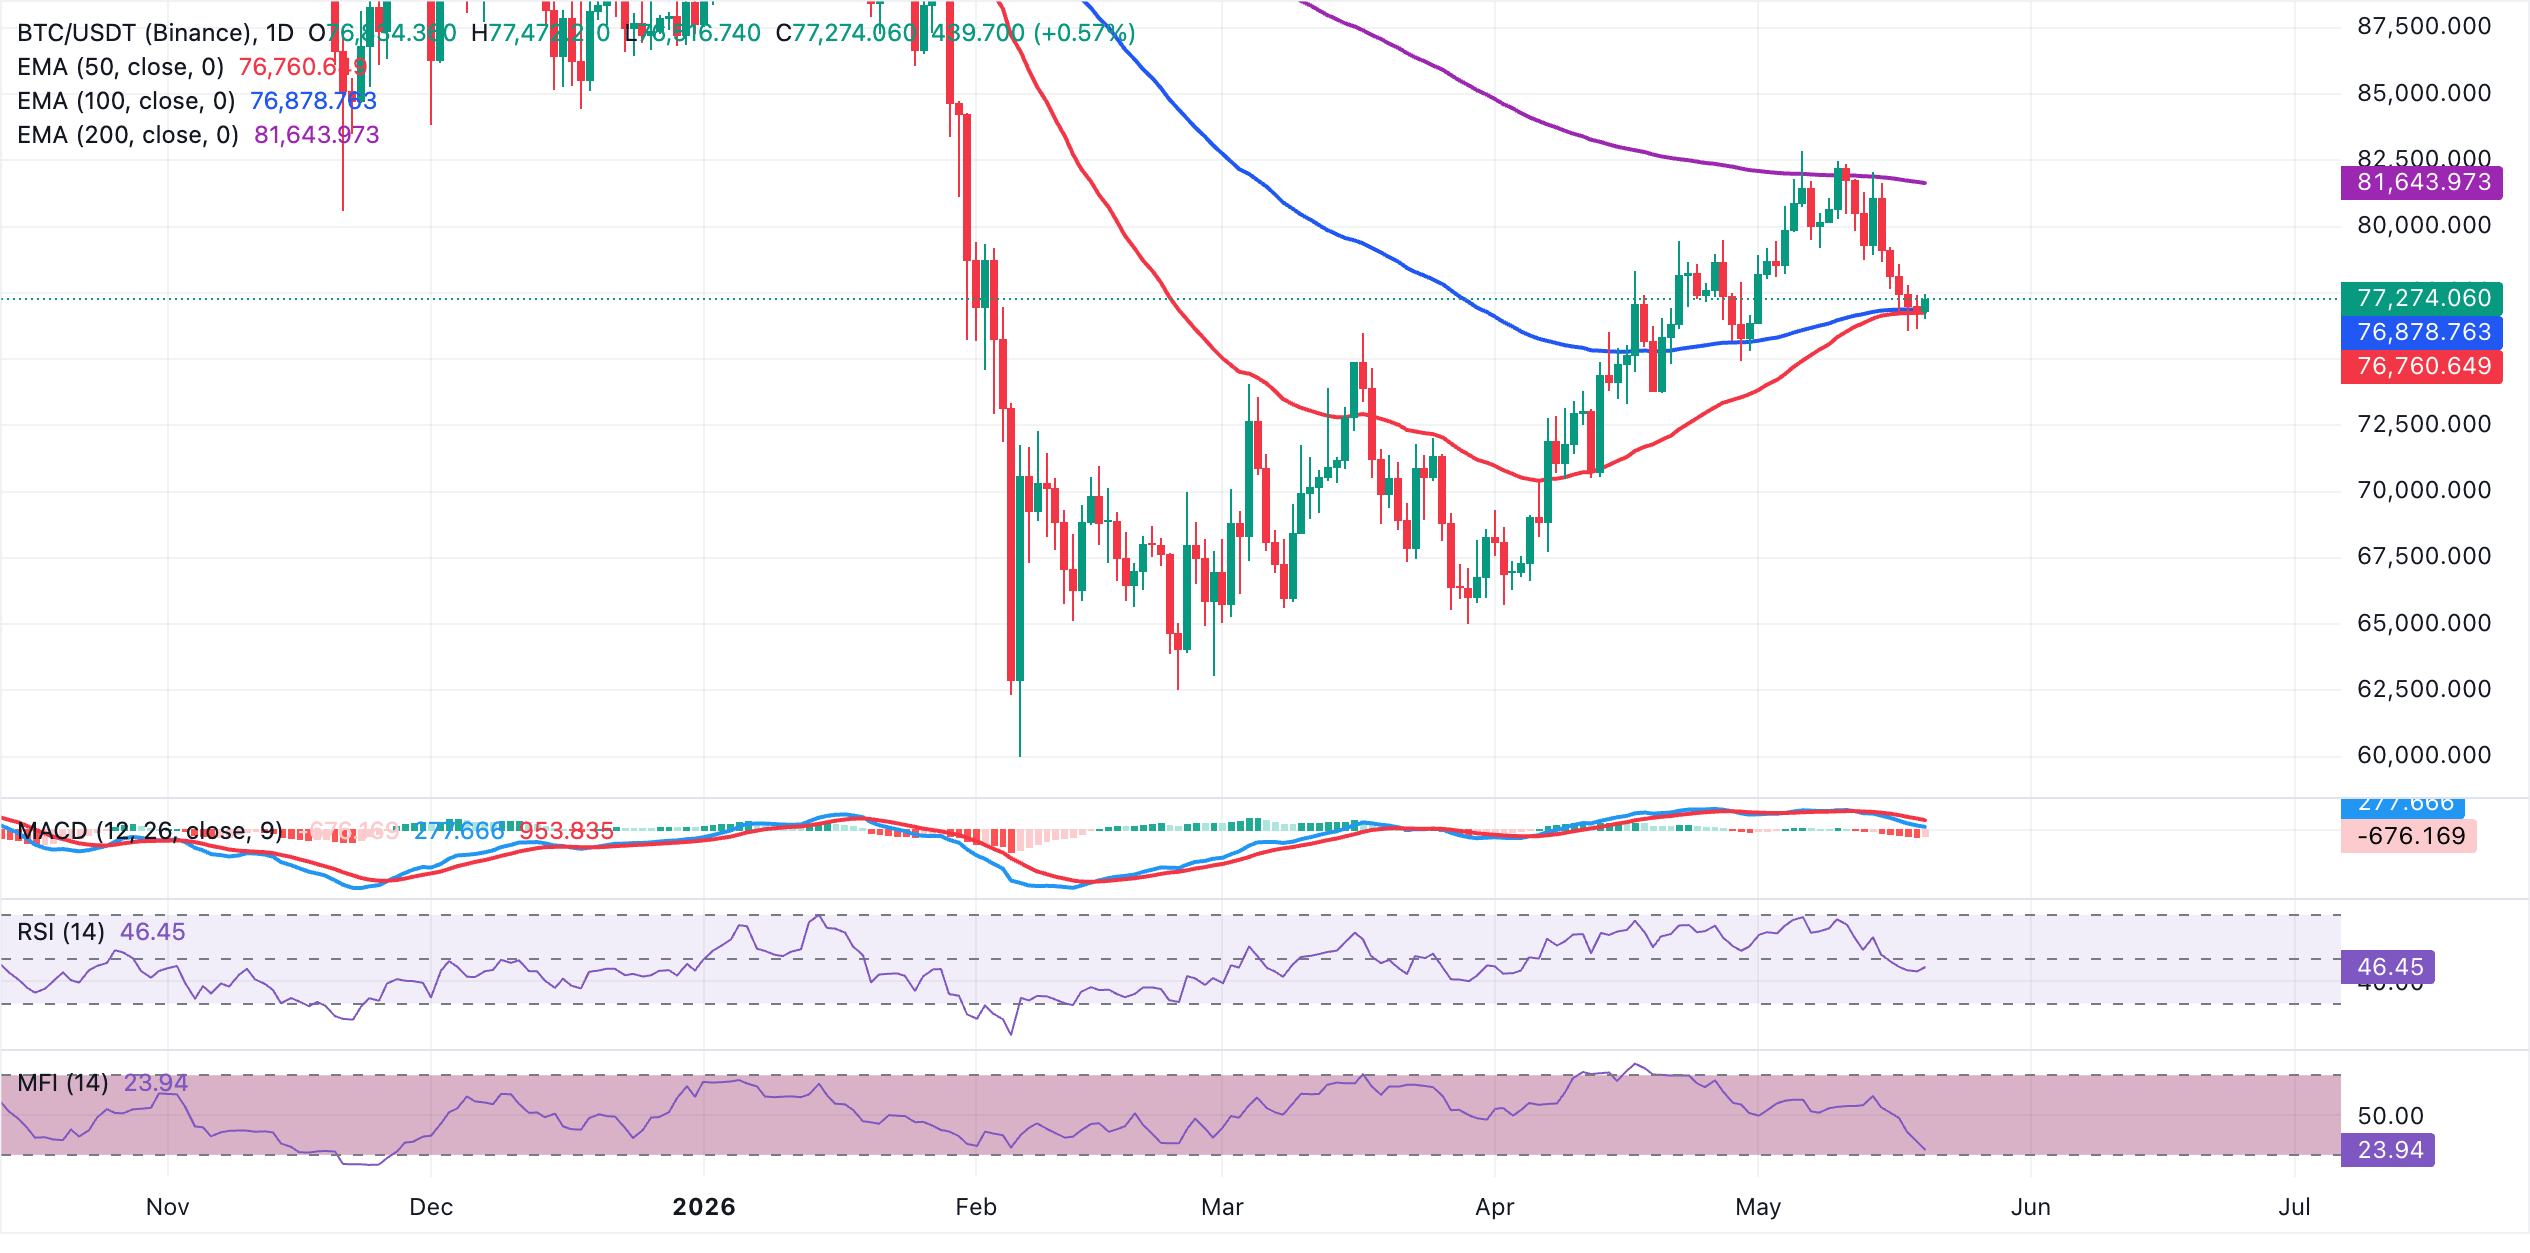
On the topside, the 200-day EMA at $81,644 is the first meaningful resistance that bulls would need to reclaim to revive a sustained uptrend. On the downside, initial support is seen in the $76,900-$76,800 area where the 100-day and 50-day EMAs cluster, with the previously identified upward trendline region near $69,896 acting as a deeper structural floor should selling pressure intensify.
Altcoins technical outlook: Ethereum and XRP battle overhead pressure
Ethereum trades at $2,132, extending its pullback below the main Exponential Moving Averages (EMAs) and keeping a bearish near-term bias. Price holds under the 50-day EMA at roughly $2,248, the 100-day EMA near $2,318 and the 200-day EMA around $2,547, suggesting the broader recovery structure is under pressure.
Momentum indicators reinforce this tone, with the MACD histogram deeply negative on the daily chart and below its signal line, while the RSI hovers in the mid-30s and the MFI slips into oversold territory, hinting that downside pressure persists even as short-term exhaustion risks begin to build.
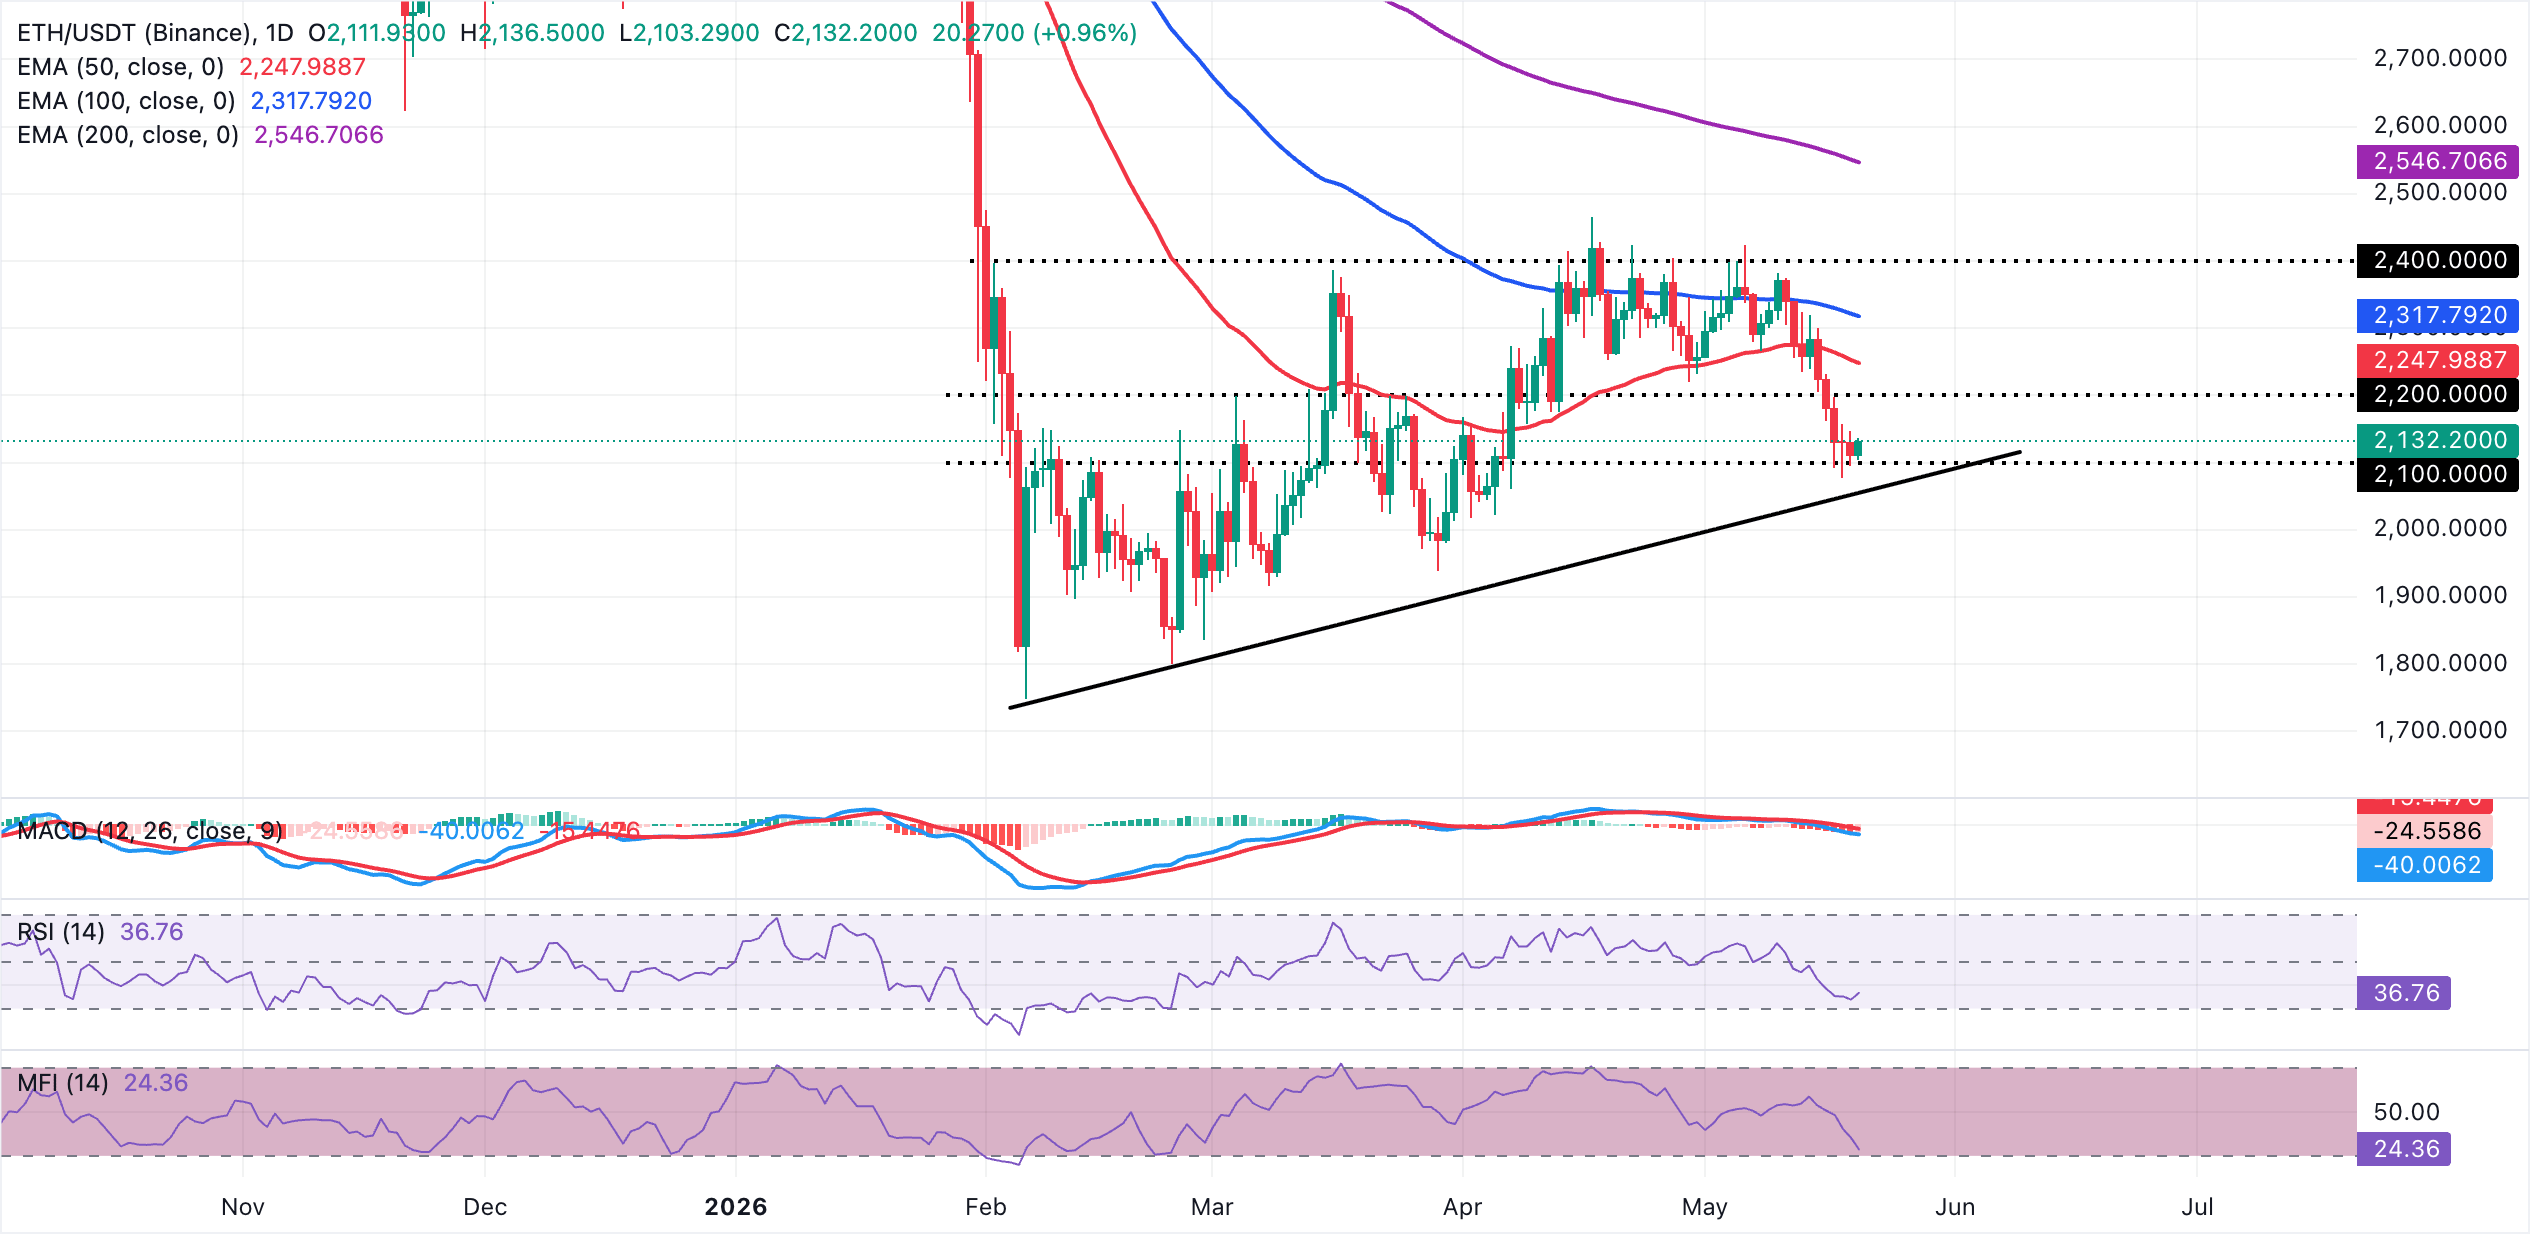
On the topside, initial resistance is seen at the 50-day EMA around $2,248, followed by the 100-day EMA near $2,318 and then the 200-day EMA close to $2,547, levels that would need to be reclaimed to ease the current bearish bias and reopen a more constructive outlook. On the downside, the next notable support aligns with the previously defined rising trendline break area around $2,055.
A sustained drop back toward that zone would expose further weakness, whereas holding above it could allow oversold conditions to stabilize and fuel a corrective bounce within the broader bearish context.
XRP, on the other hand, trades near $1.37. The pair remains under pressure as it holds below the short and medium-term moving averages, with the 50-day EMA at $1.41 converging with the Bollinger middle band, capping the upside and reinforcing a bearish bias.
Momentum conditions align with this stance, as the MACD histogram sits below zero with a negative reading on the daily chart and the RSI hovering in the low 40s, suggesting persistent but not yet exhausted selling pressure.
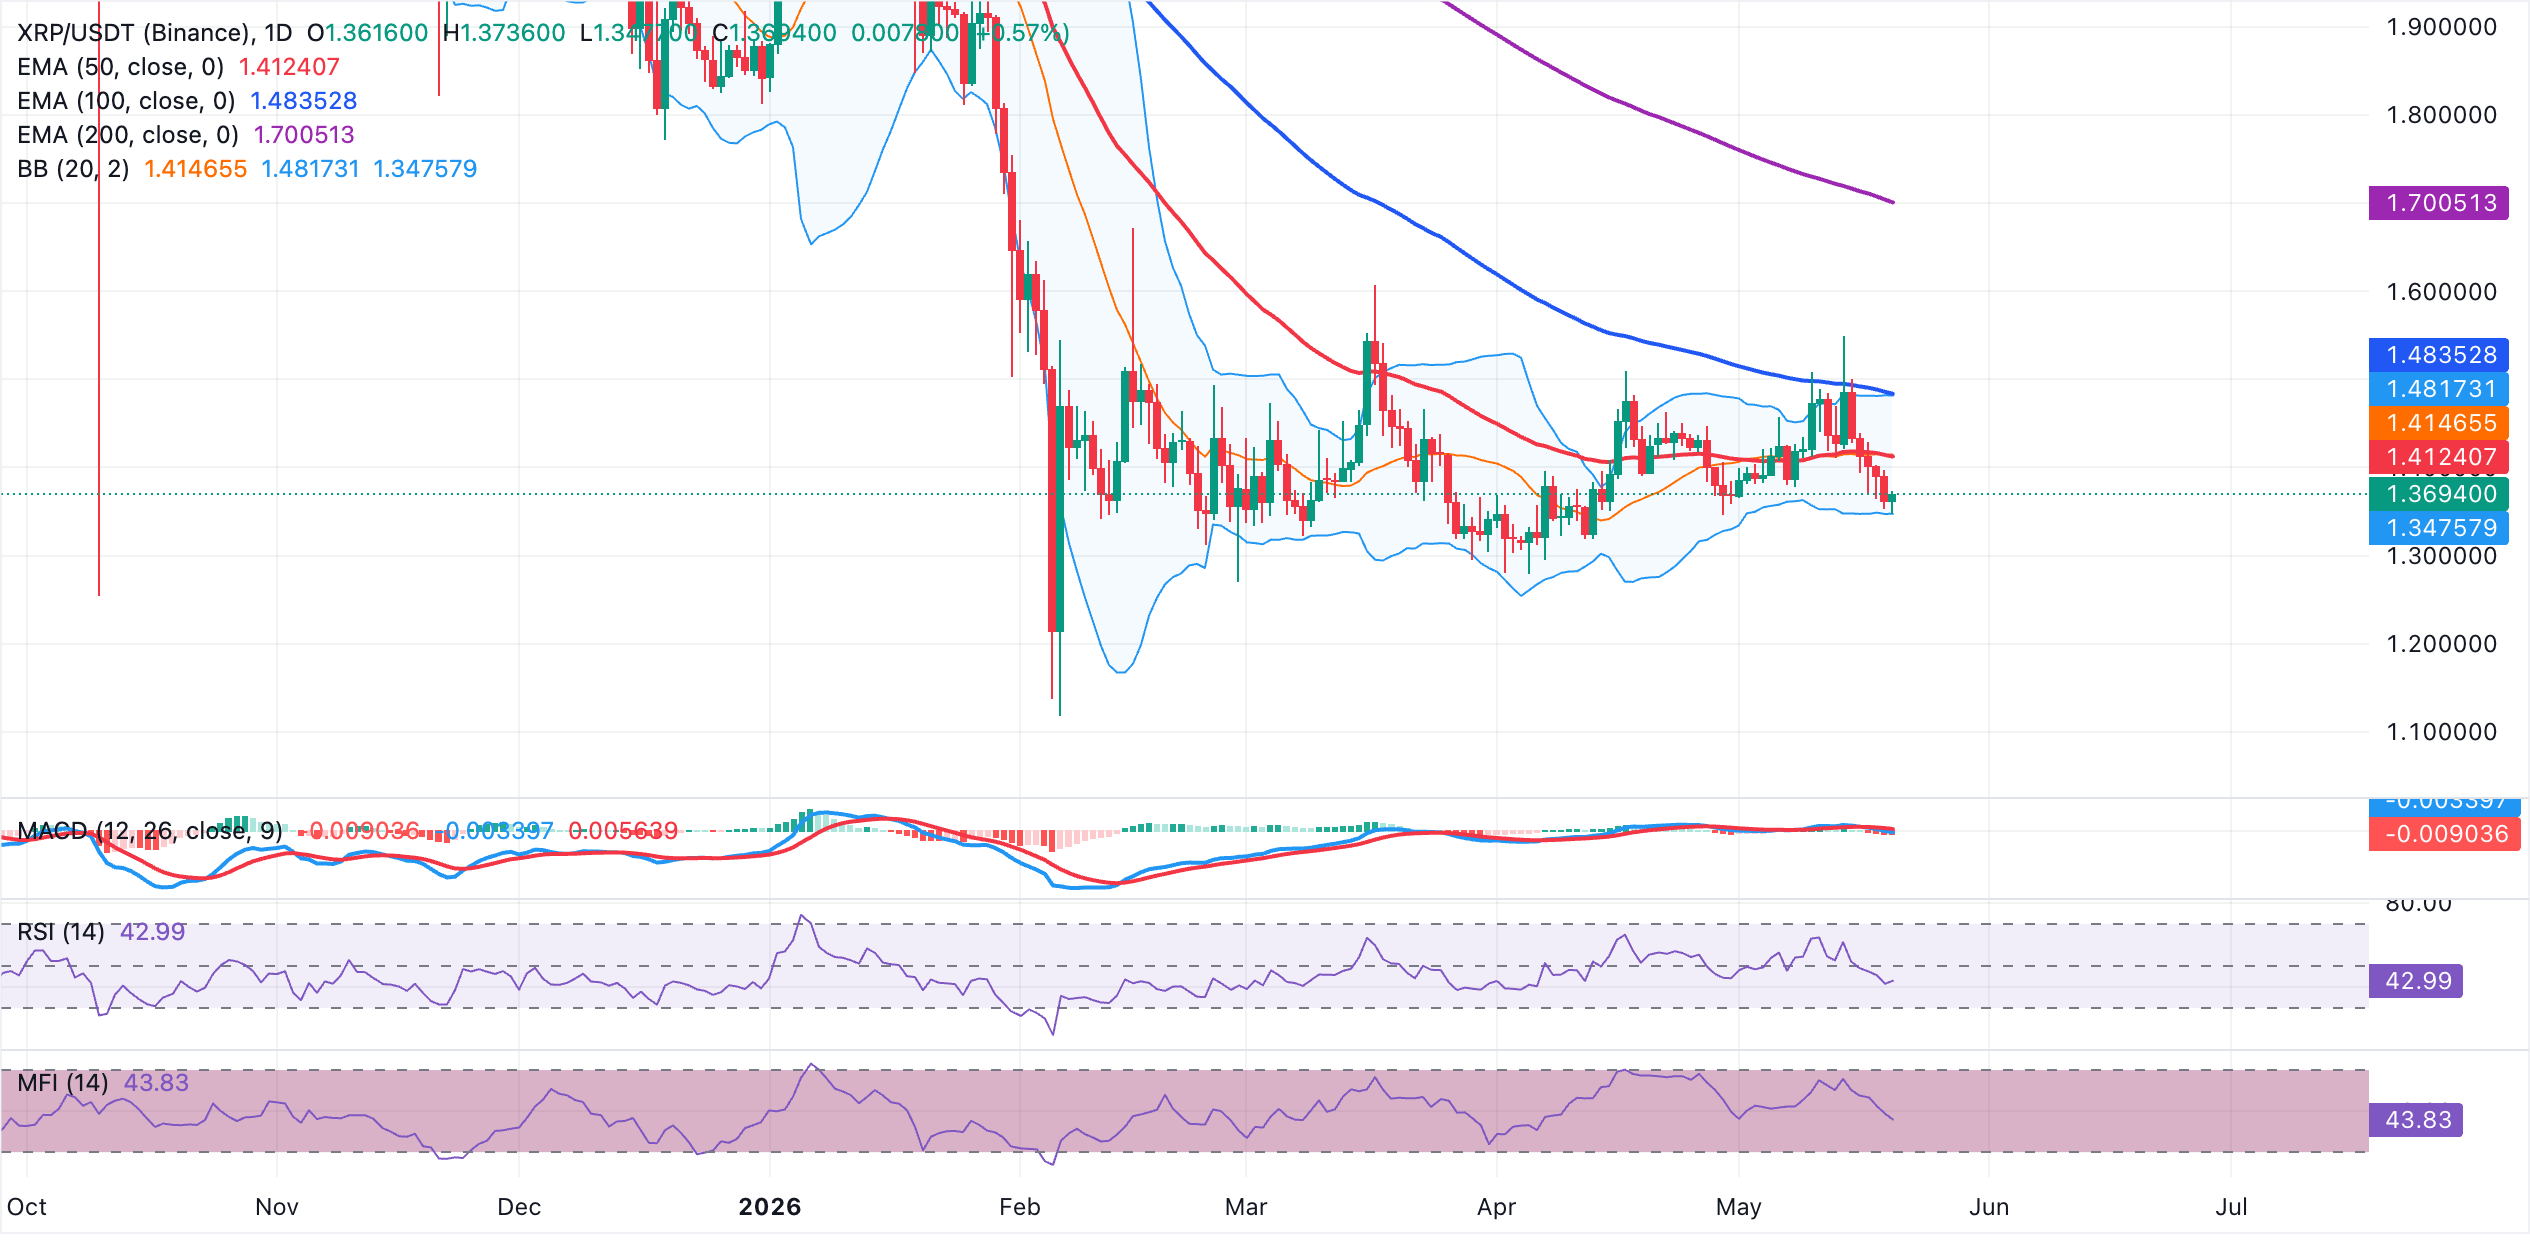
On the topside, initial resistance emerges at the 50-day EMA around $1.41, which coincides with the Bollinger 20-day Simple Moving Average (SMA), forming a nearby supply zone. Further gains would bring the upper Bollinger band at roughly $1.48 into focus, aligning with the 100-day EMA. On the downside, immediate support is provided by the lower Bollinger band near $1.35, where buyers may attempt to stabilize the price, though a clear break below this floor would open the door to a deeper retracement within the broader corrective phase.
(The technical analysis of this story was written with the help of an AI tool.)
Open Interest, funding rate FAQs
Higher Open Interest is associated with higher liquidity and new capital inflow to the market. This is considered the equivalent of increase in efficiency and the ongoing trend continues. When Open Interest decreases, it is considered a sign of liquidation in the market, investors are leaving and the overall demand for an asset is on a decline, fueling a bearish sentiment among investors.
Funding fees bridge the difference between spot prices and prices of futures contracts of an asset by increasing liquidation risks faced by traders. A consistently high and positive funding rate implies there is a bullish sentiment among market participants and there is an expectation of a price hike. A consistently negative funding rate for an asset implies a bearish sentiment, indicating that traders expect the cryptocurrency’s price to fall and a bearish trend reversal is likely to occur.

يعتمد أكثر من مليون مستخدم على FXStreet للحصول على بيانات سوقية لحظية، وأدوات رسوم بيانية، ورؤى خبراء، وأخبار الفوركس. يساعد تقويمهم الاقتصادي الشامل والندوات التعليمية عبر الويب المتداولين على البقاء على اطلاع واتخاذ قرارات محسوبة. لدى FXStreet فريق يضم حوالي 60 محترفًا موزعين بين مقر برشلونة ومناطق عالمية مختلفة.
اقرأ المزيد


