
Crypto Today: Bitcoin, Ethereum, XRP trade under pressure amid mixed retail and technical signals
بواسطة John Isige
تاريخ النشر: 15 Dec 2025 | تاريخ التعديل: 15 Dec 2025


المقالات الشائعة

Bitcoin (BTC) is advancing toward $90,000 at the time of writing on Monday, as the broader cryptocurrency market pushes for recovery following last week’s monetary policy-triggered headwinds.
- Bitcoin rises toward $90,000 initial resistance, backed by a steady increase in futures Open Interest.
- Ethereum reclaims $3,100, but the 50, 100, and 200-day EMAs could continue to limit rebounds.
- XRP is poised to break $2.00 immediate hurdle, supported by a marginal increase in retail demand.
Bitcoin (BTC) is advancing toward $90,000 at the time of writing on Monday, as the broader cryptocurrency market pushes for recovery following last week’s monetary policy-triggered headwinds.
Ethereum (ETH) edges up above $3,100 despite facing shaky retail demand. Meanwhile, XRP is on the cusp of reclaiming its position above $2.00, supported by a marginal increase in the futures Open Interest (OI).
Data spotlight: Bitcoin retail market builds, Ethereum and XRP struggle
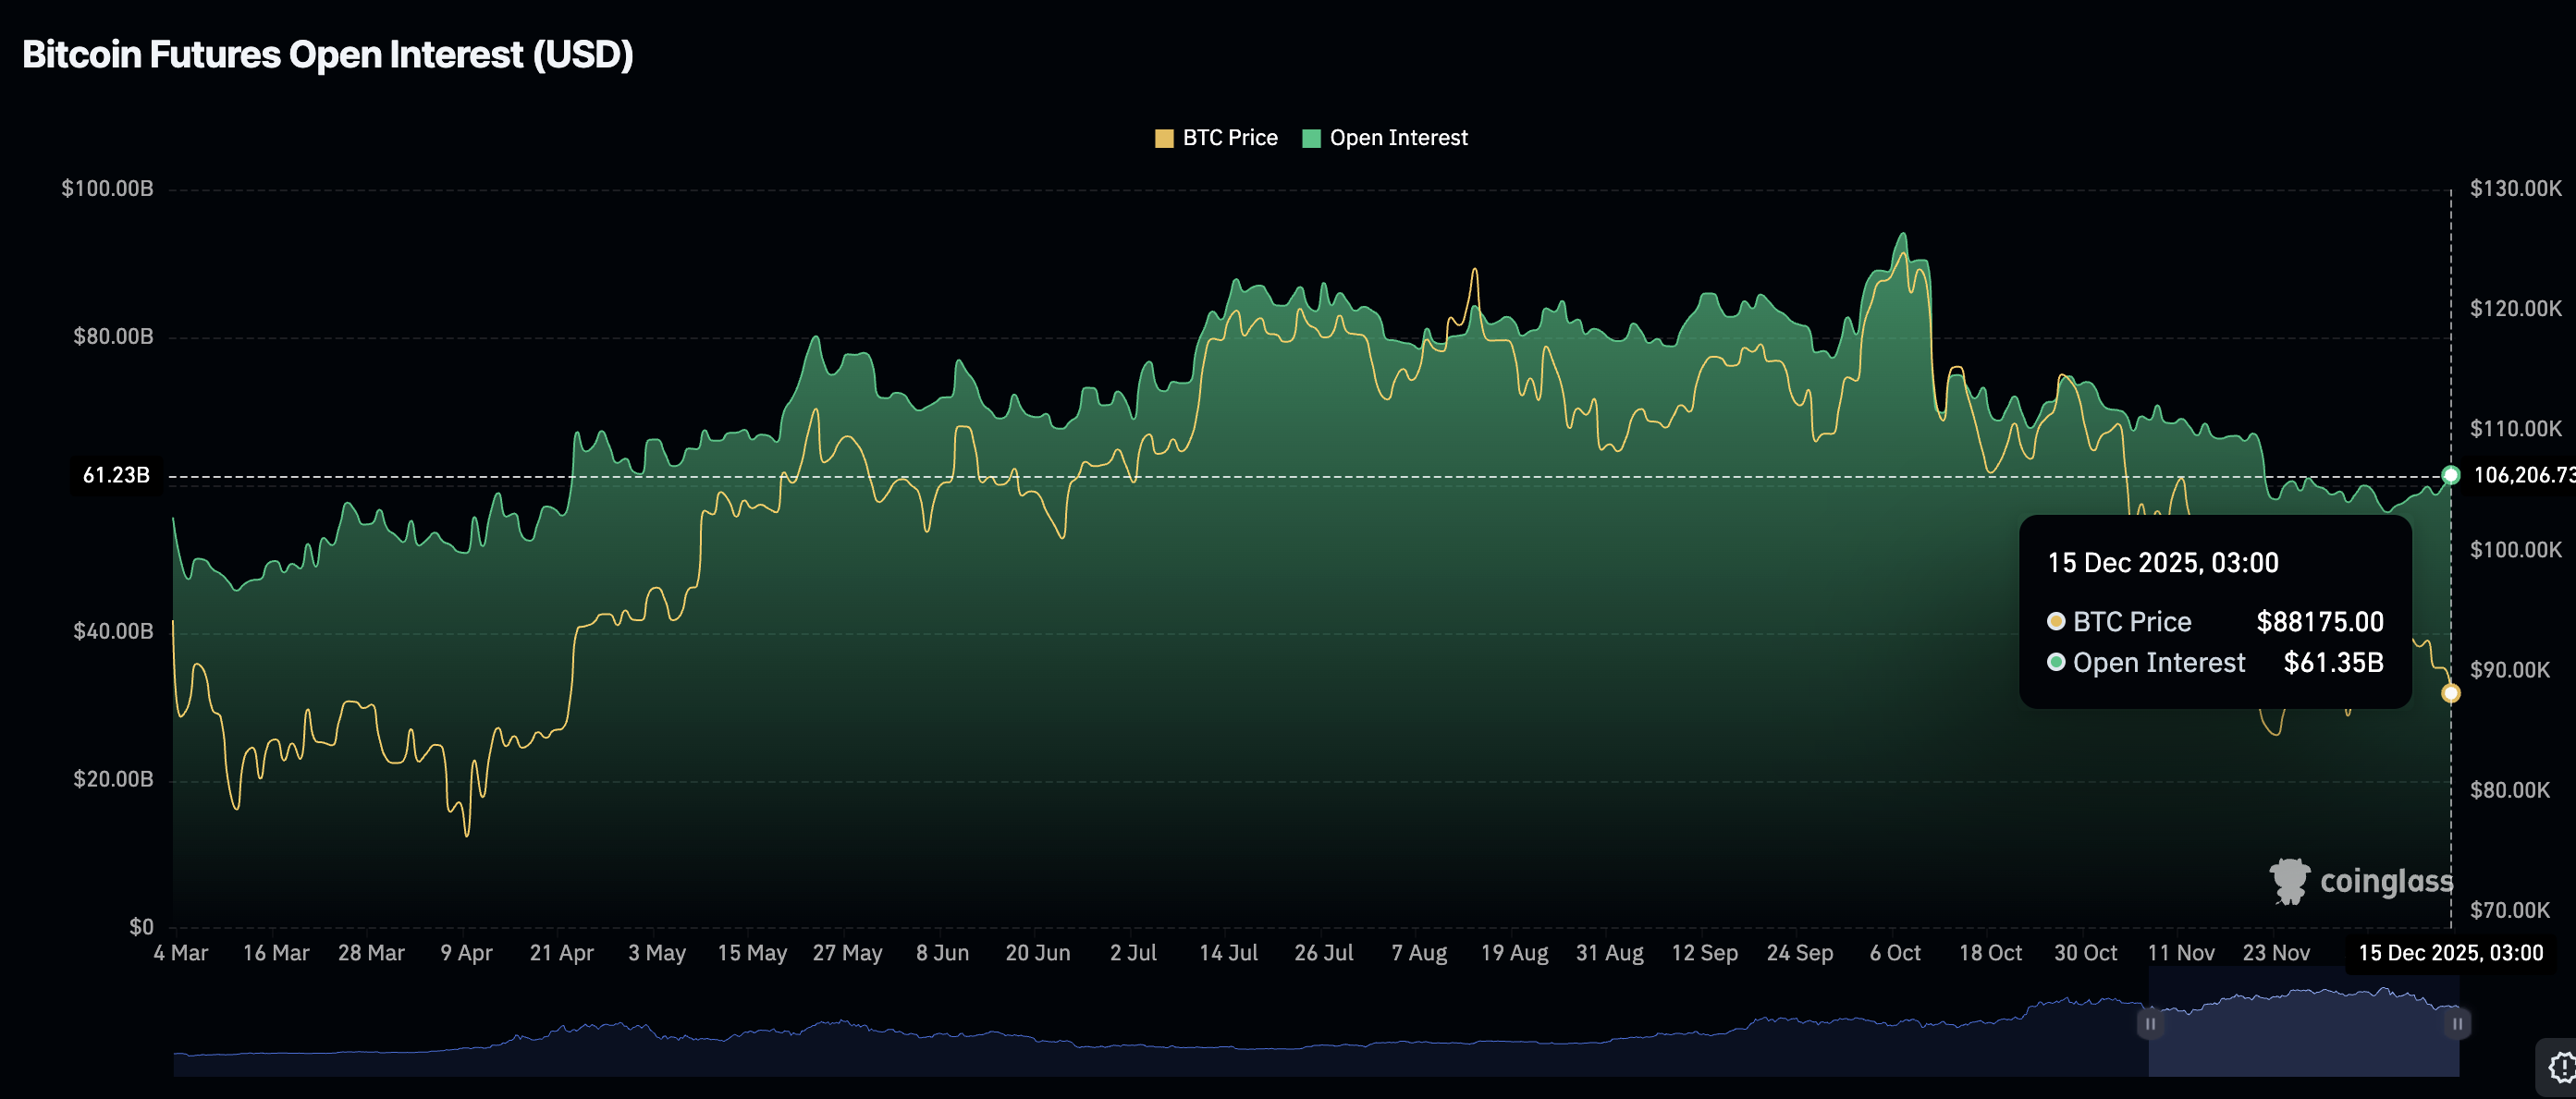
The Bitcoin derivatives market is showing signs of growth as retail interest returns after a long hiatus. CoinGlass data shows futures OI averaging $61.35 billion on Monday, up from $59.8 billion the previous day.
OI, which tracks the notional value of outstanding futures contracts, had declined to a nine-month low of $56.32 billion on December 7. Putting this into perspective, retail demand peaked at an all-time high of $94.12 billion on October 7, before the largest deleveraging event on October $10.
A steady increase in OI suggests that retail traders are confident in Bitcoin’s outlook; hence, their willingness to increase exposure.
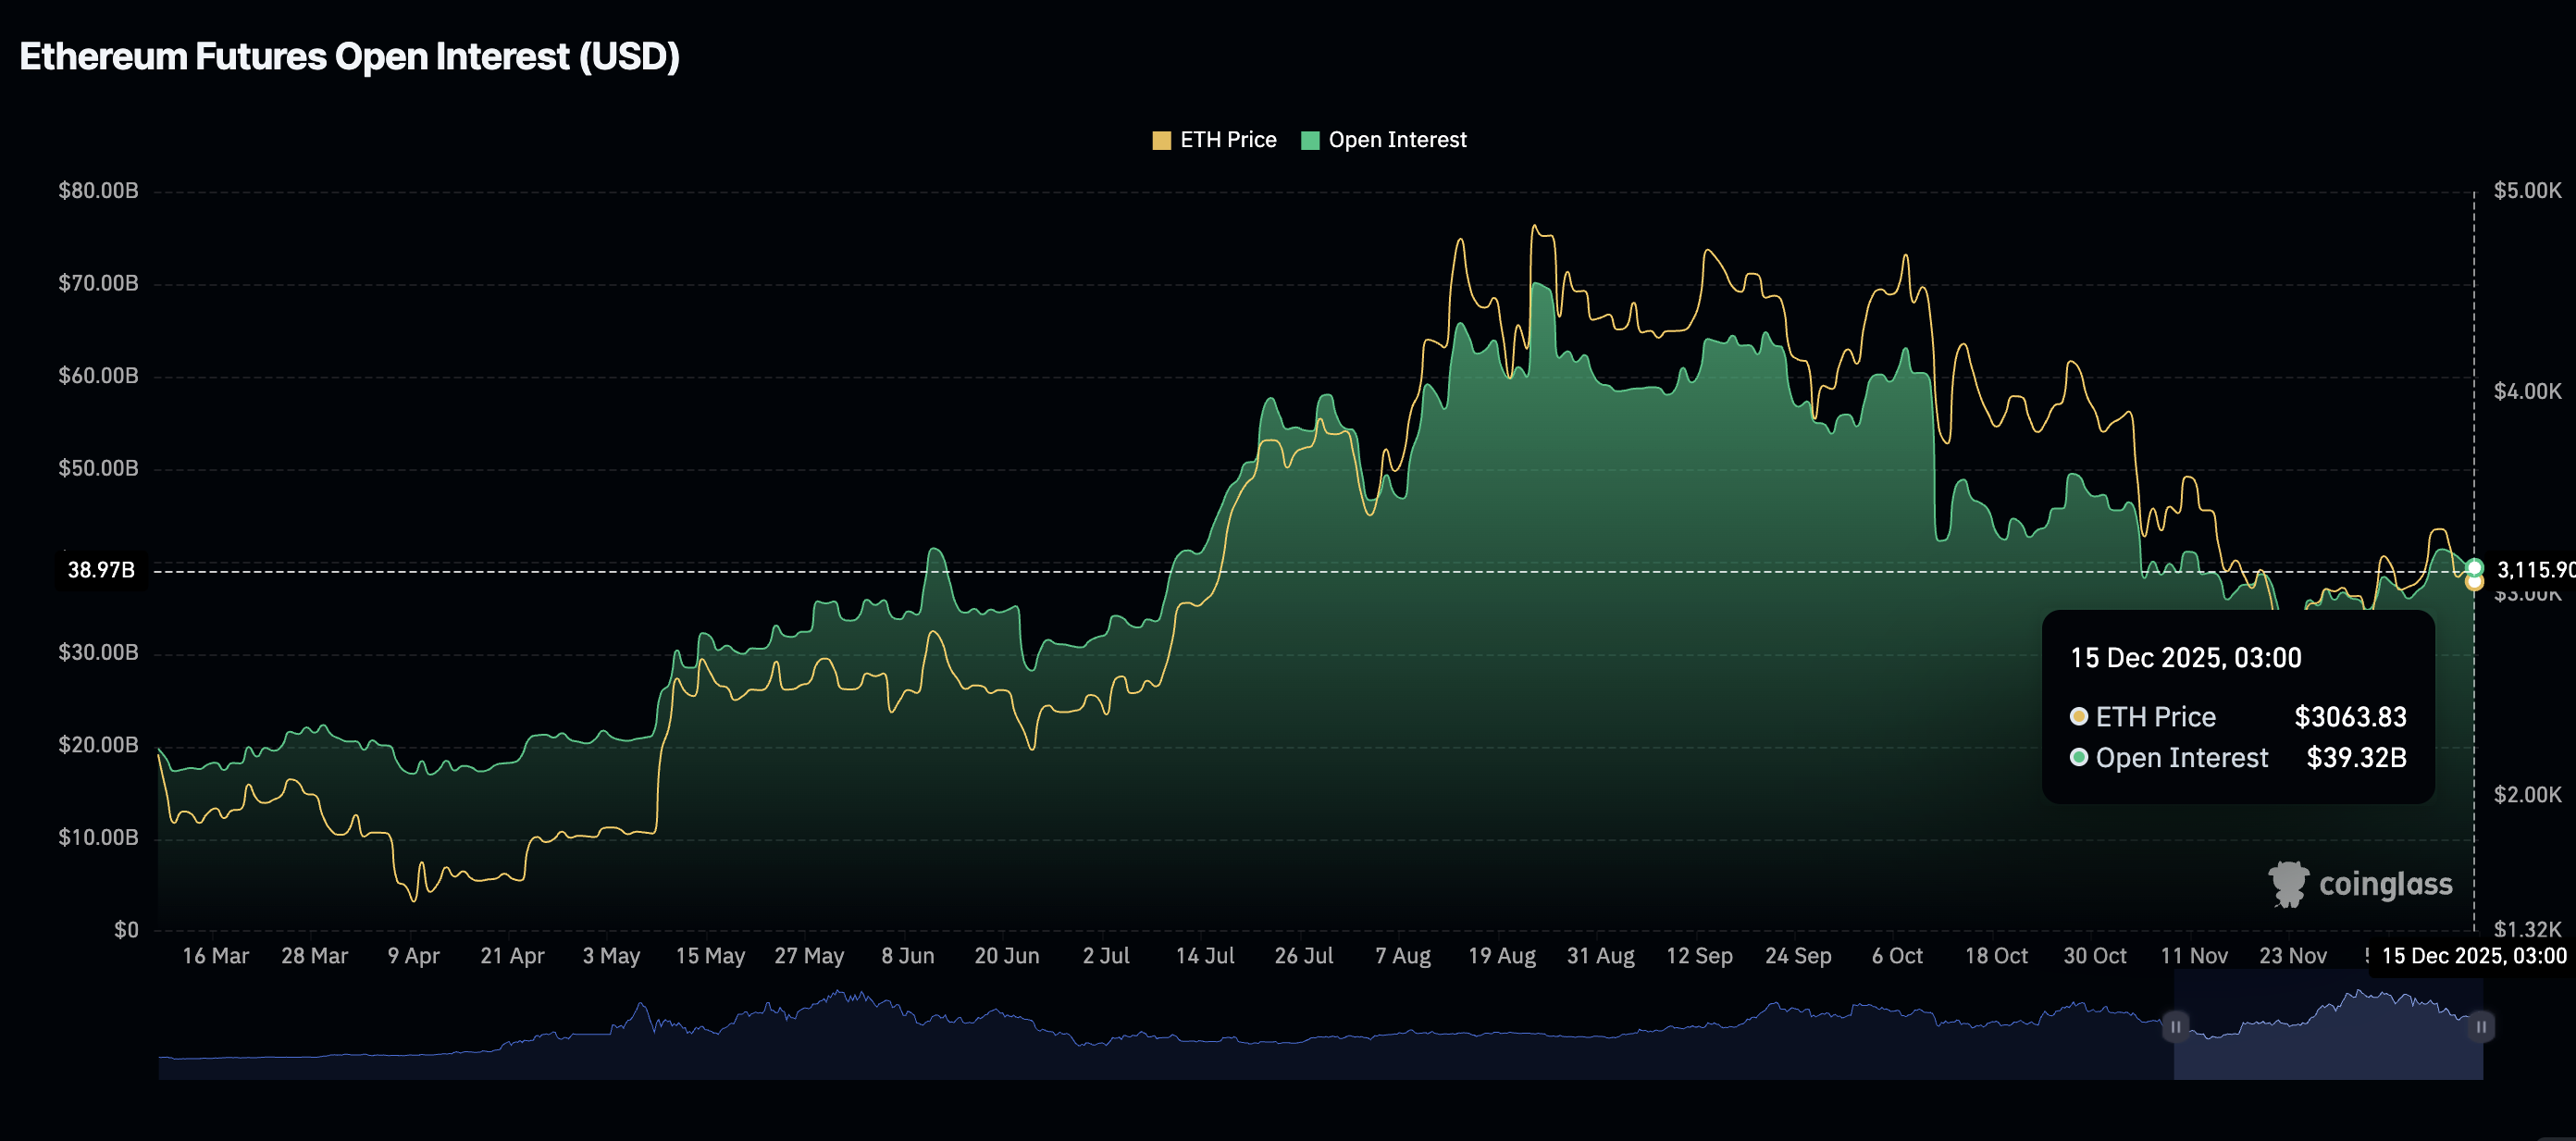
Ethereum is facing headwinds, with retail demand faltering to $39.32 billion from $41.32 billion on Friday. The futures OI reached an all-time high of $70.13 billion on August 23 but declined to a six-month low of $ 32.57 billion on November 22.
Retail interest in XRP remains significantly low despite the futures OI averaging $3.72 billion on Monday, up from $3.57 billion the previous day. In comparison, OI peaked at $10.94 billion on July 22, suggesting FOMO-driven interest in the cross-border remittance token. A sustained recovery in OI is required to support price recovery.
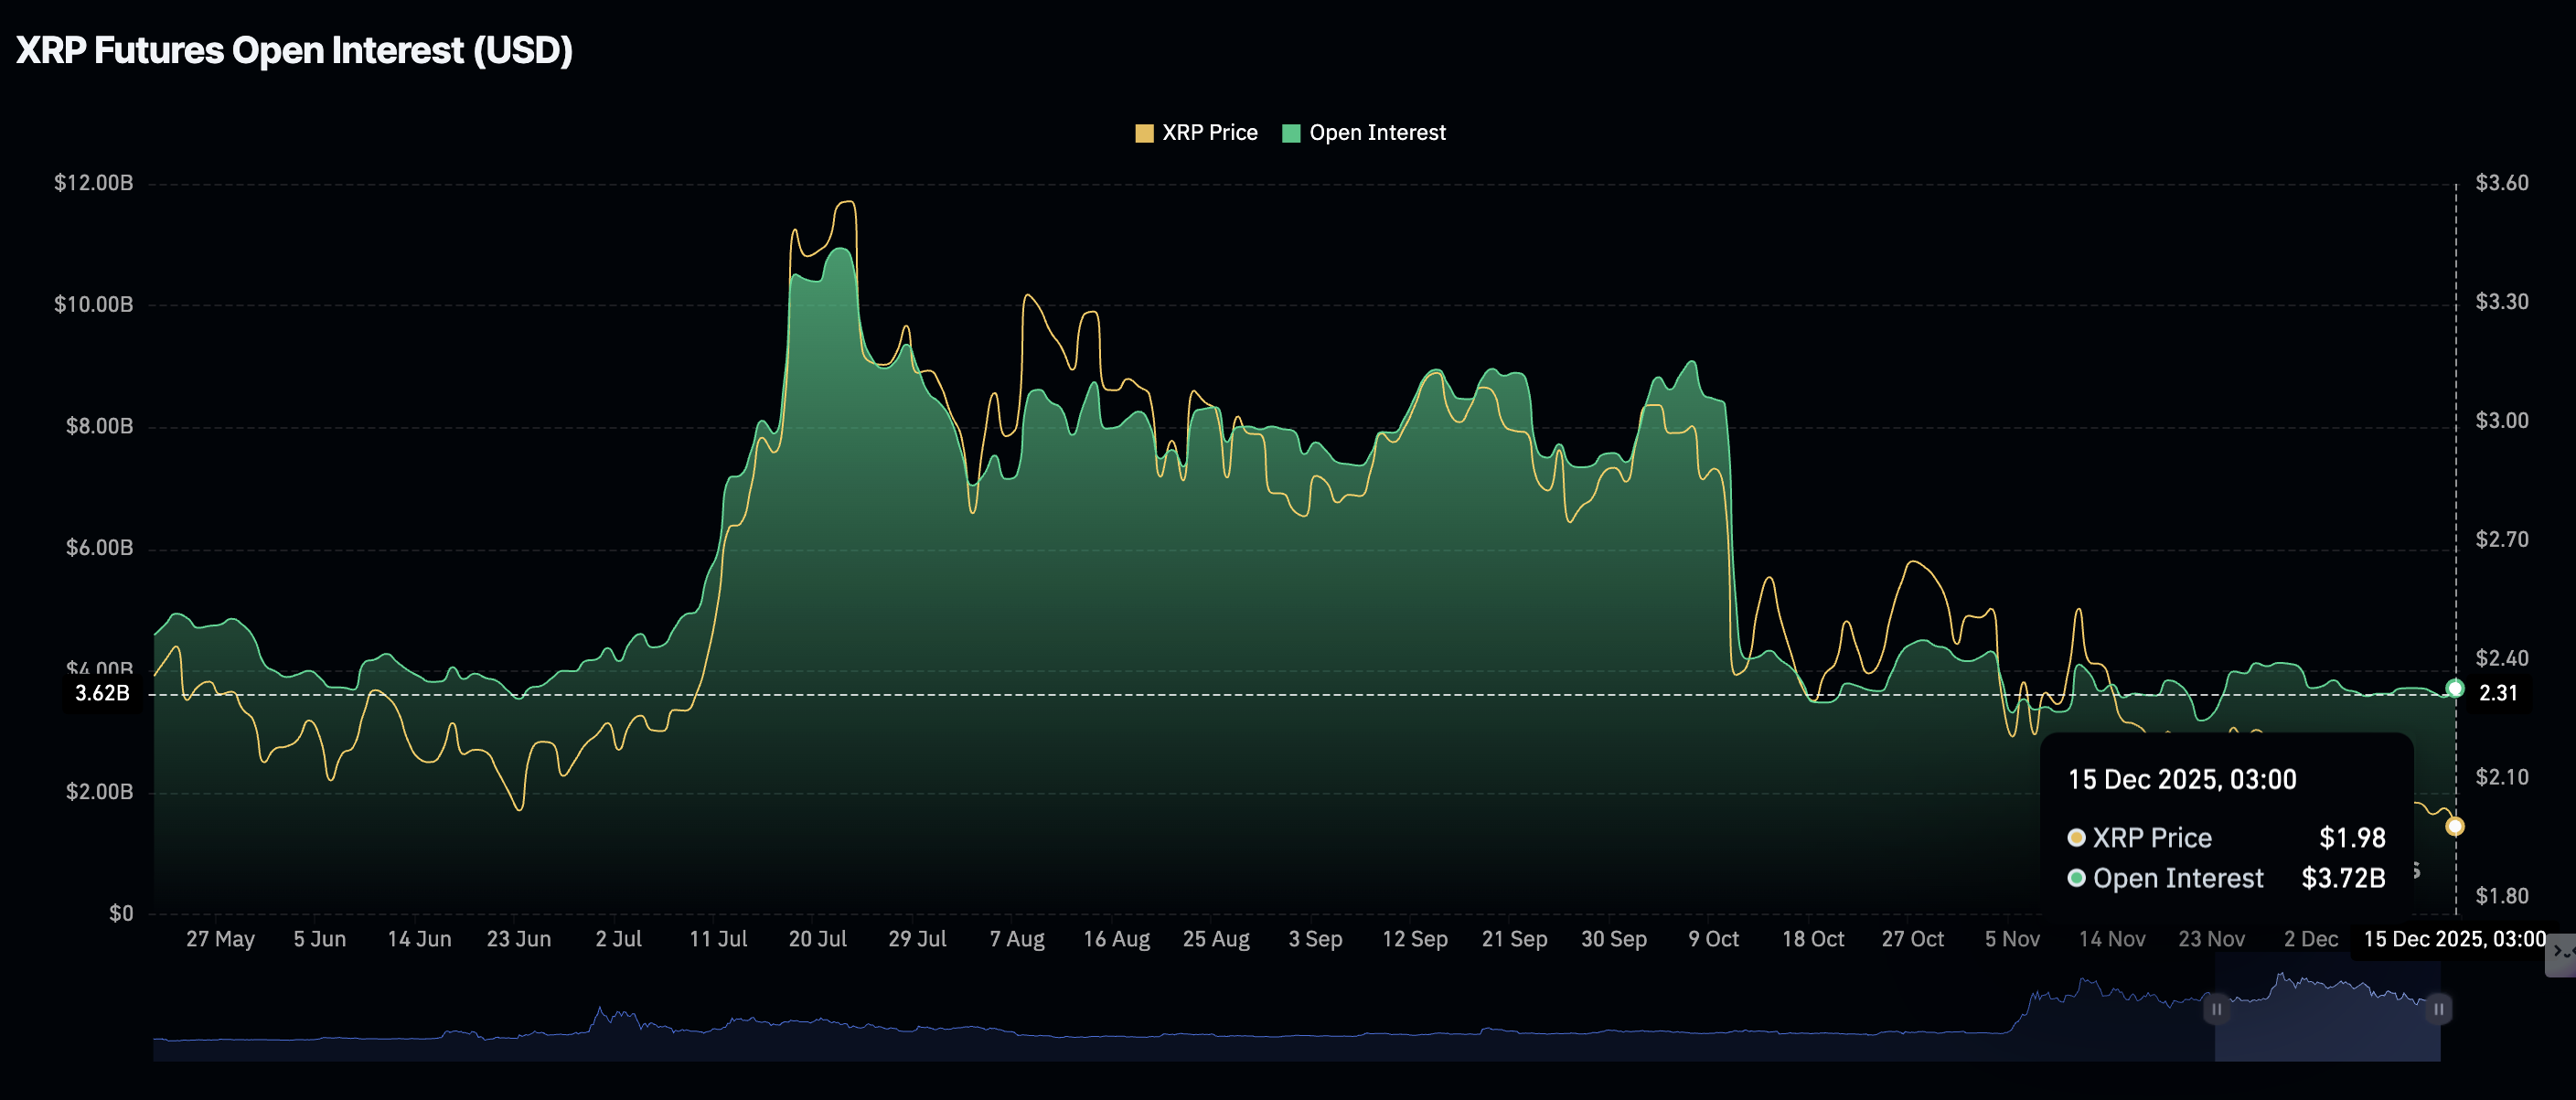
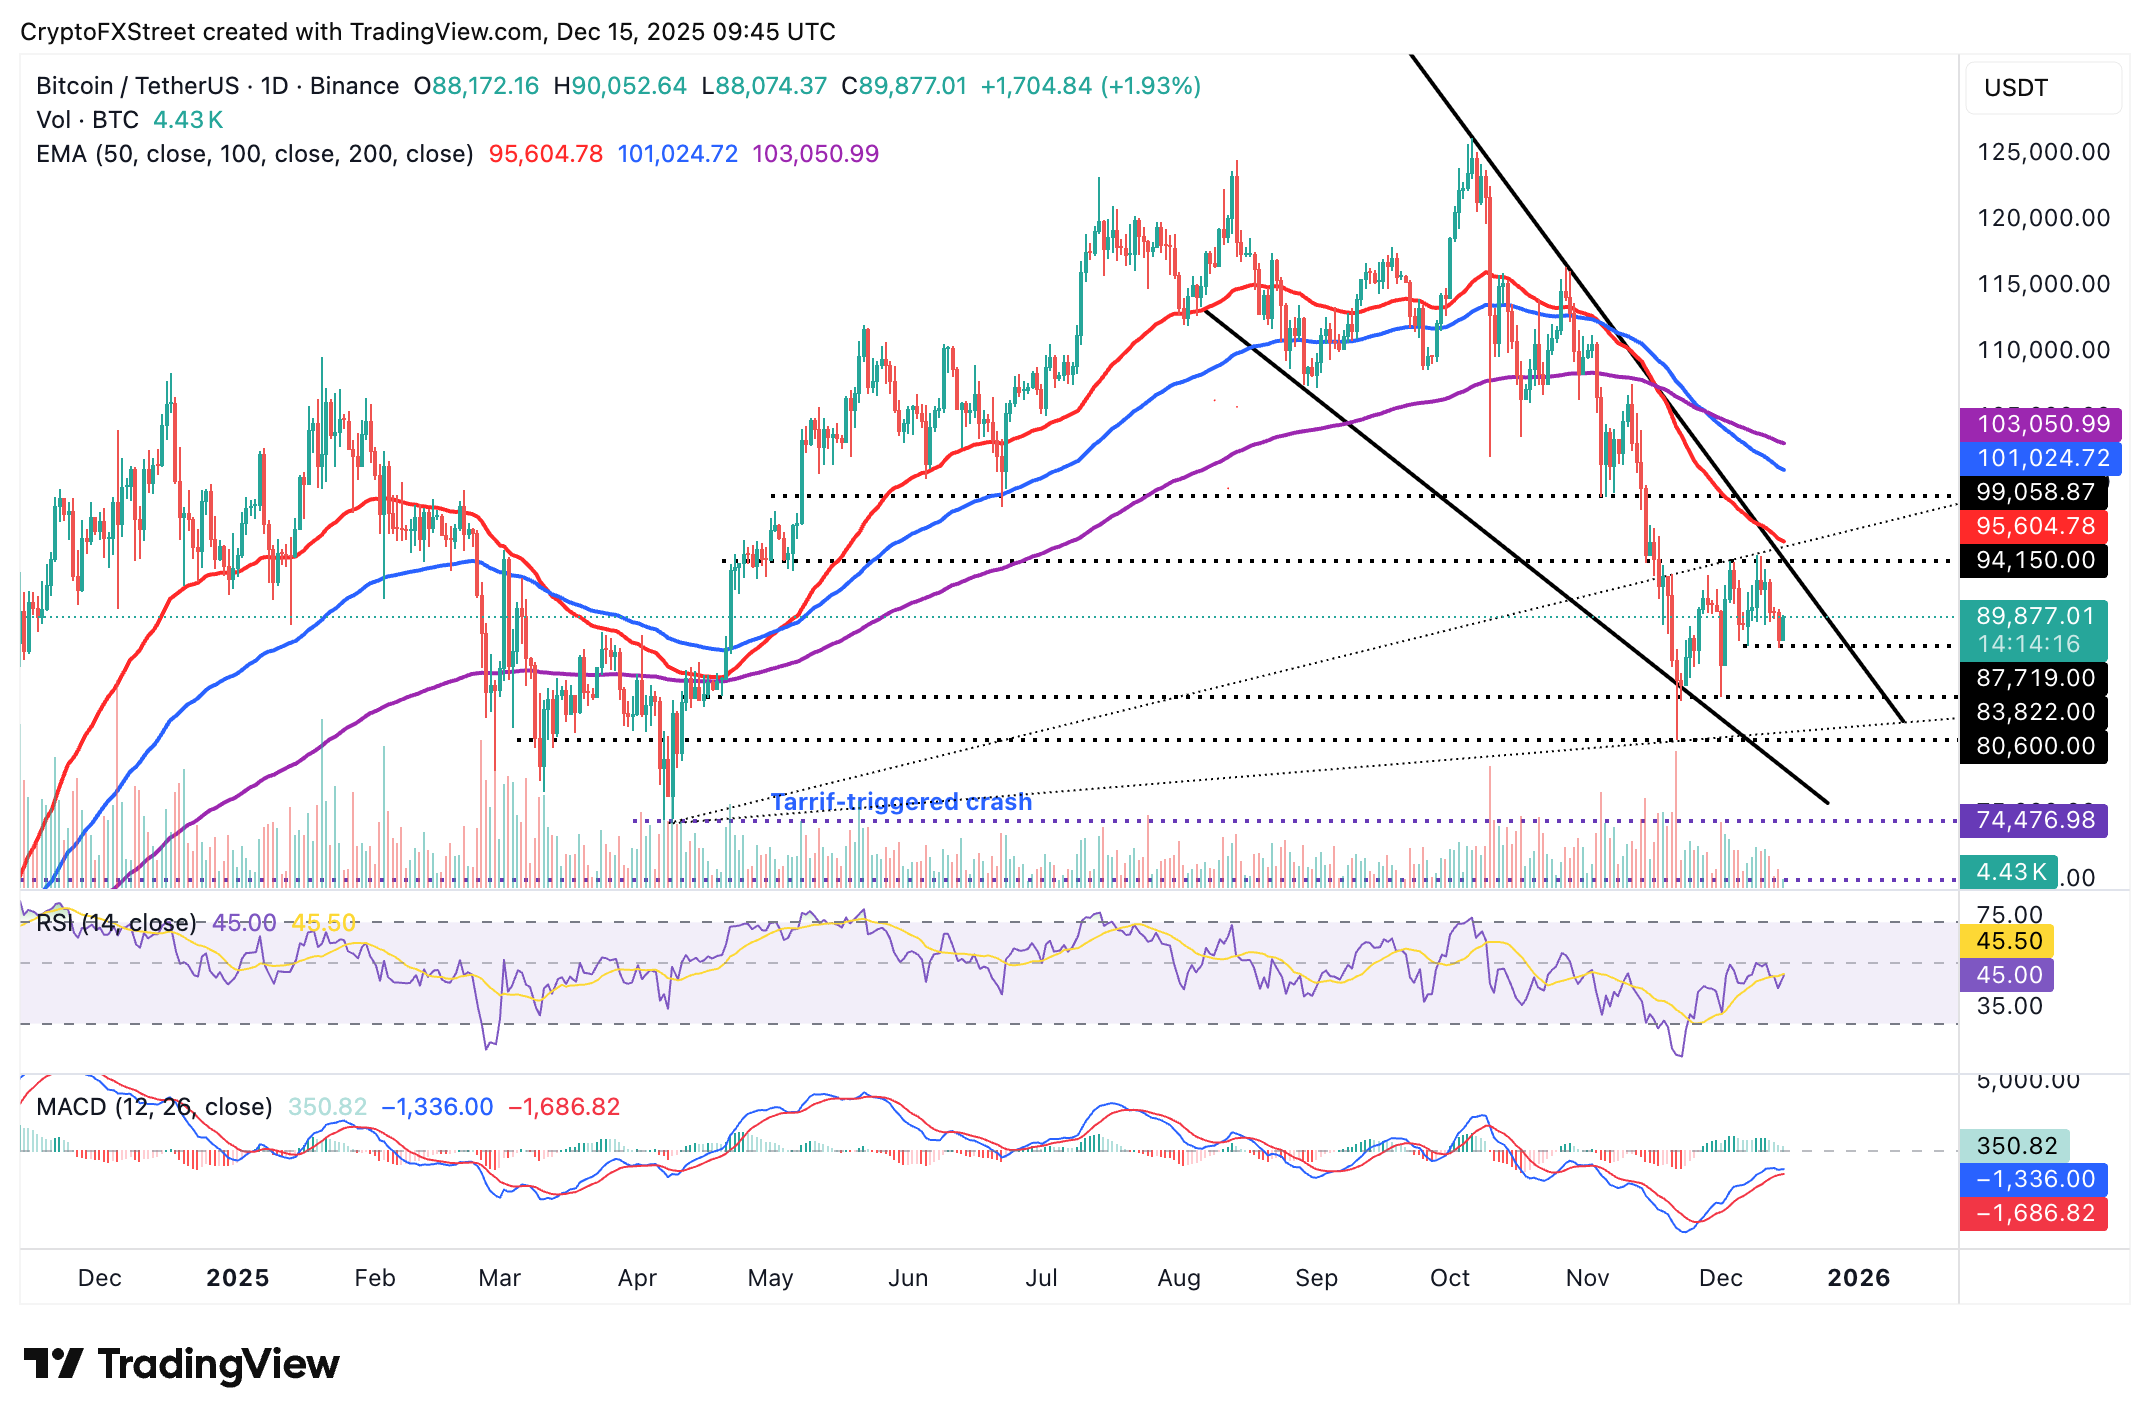
Chart of the day: Bitcoin eyes short-term breakout
Bitcoin is edging up toward $90,000 at the time of writing on Monday, supported by an uptrending Relative Strength Index (RSI) on the daily chart. If the RSI at 44 rises above the midline into the bullish region, momentum will increase, supporting an extended breakout above $90,000.
The Moving Average Convergence Divergence (MACD) indicator on the same daily chart shows a slight positive momentum, with the blue line remaining above the red signal line. Investors will consider increasing their risk exposure if the MACD advances and crosses into the bullish region while green histogram bars expand above the mean line.
Still, the trend remains generally bearish, with the 50-day Exponential Moving Average (EMA) at $95,605, the 100-day EMA at $101,025, and the 200-day EMA at $103,051 extending their declines. Rebounds will likely remain limited unless the 50-day EMA breaks, paving the way for gains above $100,000.
Altcoins update: Ethereum bulls tighten grip as XRP holds below resistance
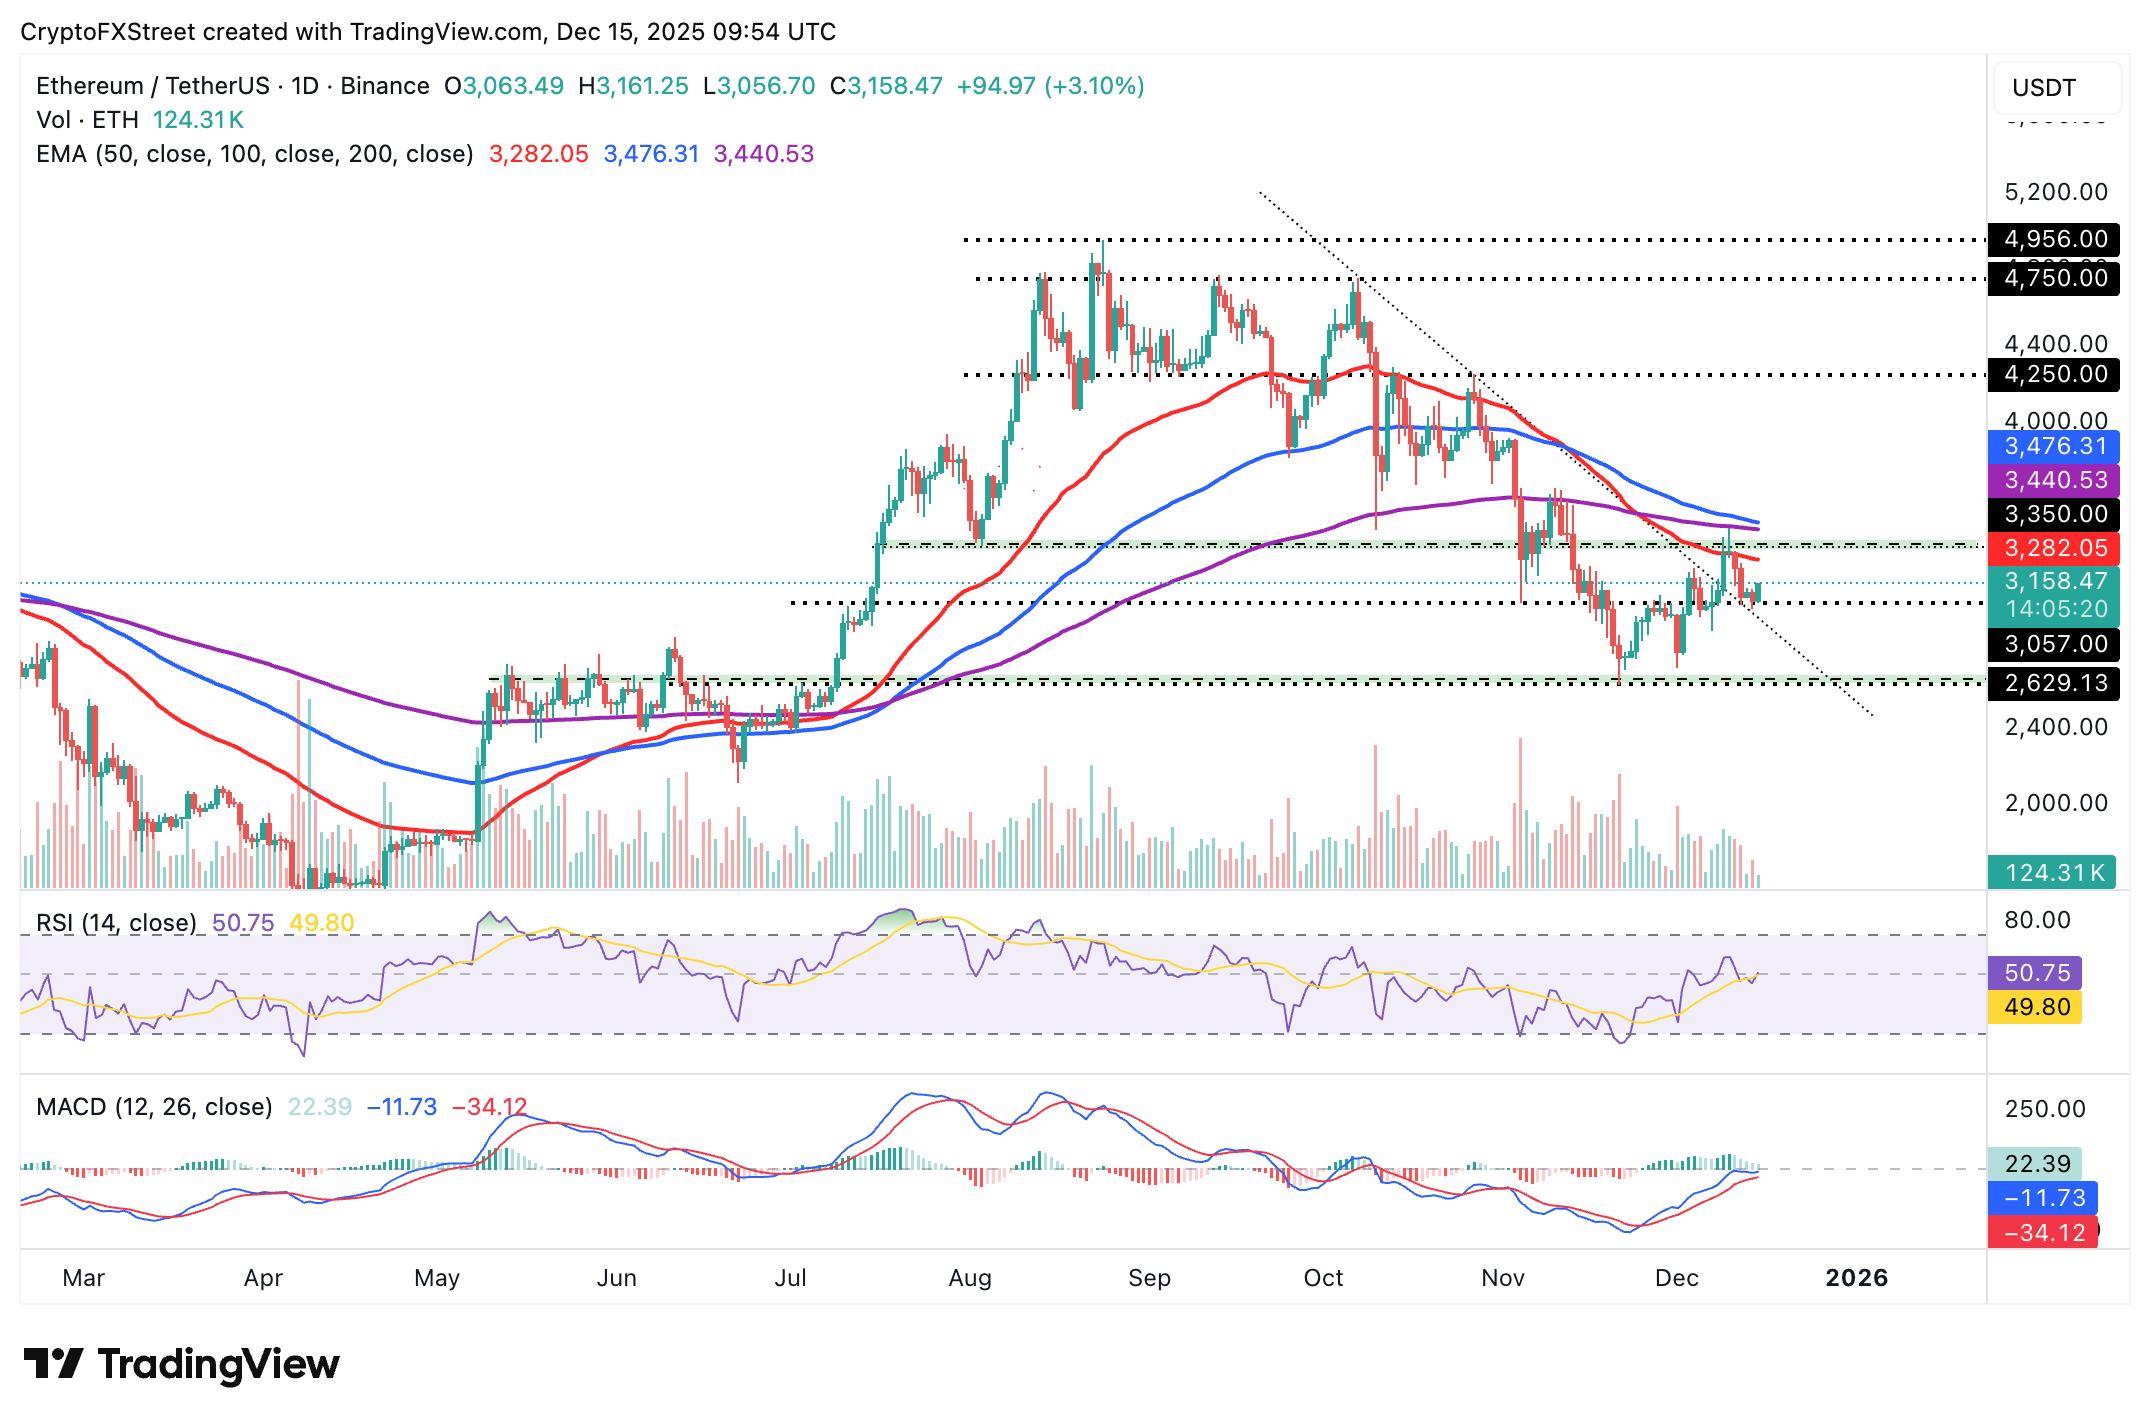
Ethereum is trading above $3,100 at the time of writing on Monday after rebounding from Sunday’s low of $3,024. The RSI has recovered above the 50 midline, signaling increasing bullish momentum.
The MACD indicator has maintained a buy signal since November 26 and is poised to break into the bullish territory. If green histogram bars expand above the mean line, investors will be prompted to increase their risk exposure to boost momentum.
The 50-day EMA at $3,282 may cap rebounds, but if breached, Ethereum could extend its leg above the 200-day EMA at $3,440 and the 100-day EMA at $3,476. Failure to break the 50-day EMA may limit ETH’s upside and increase the chances of a correction extending below $3,000.
XRP is trading slightly below the initial $2.00 resistance after regaining momentum from Sunday’s low of $1.95. A slight uptick in the RSI suggests bulls could gain an edge over bears. However, its position at 41 in the bearish region suggests that XRP is still deep in the woods.
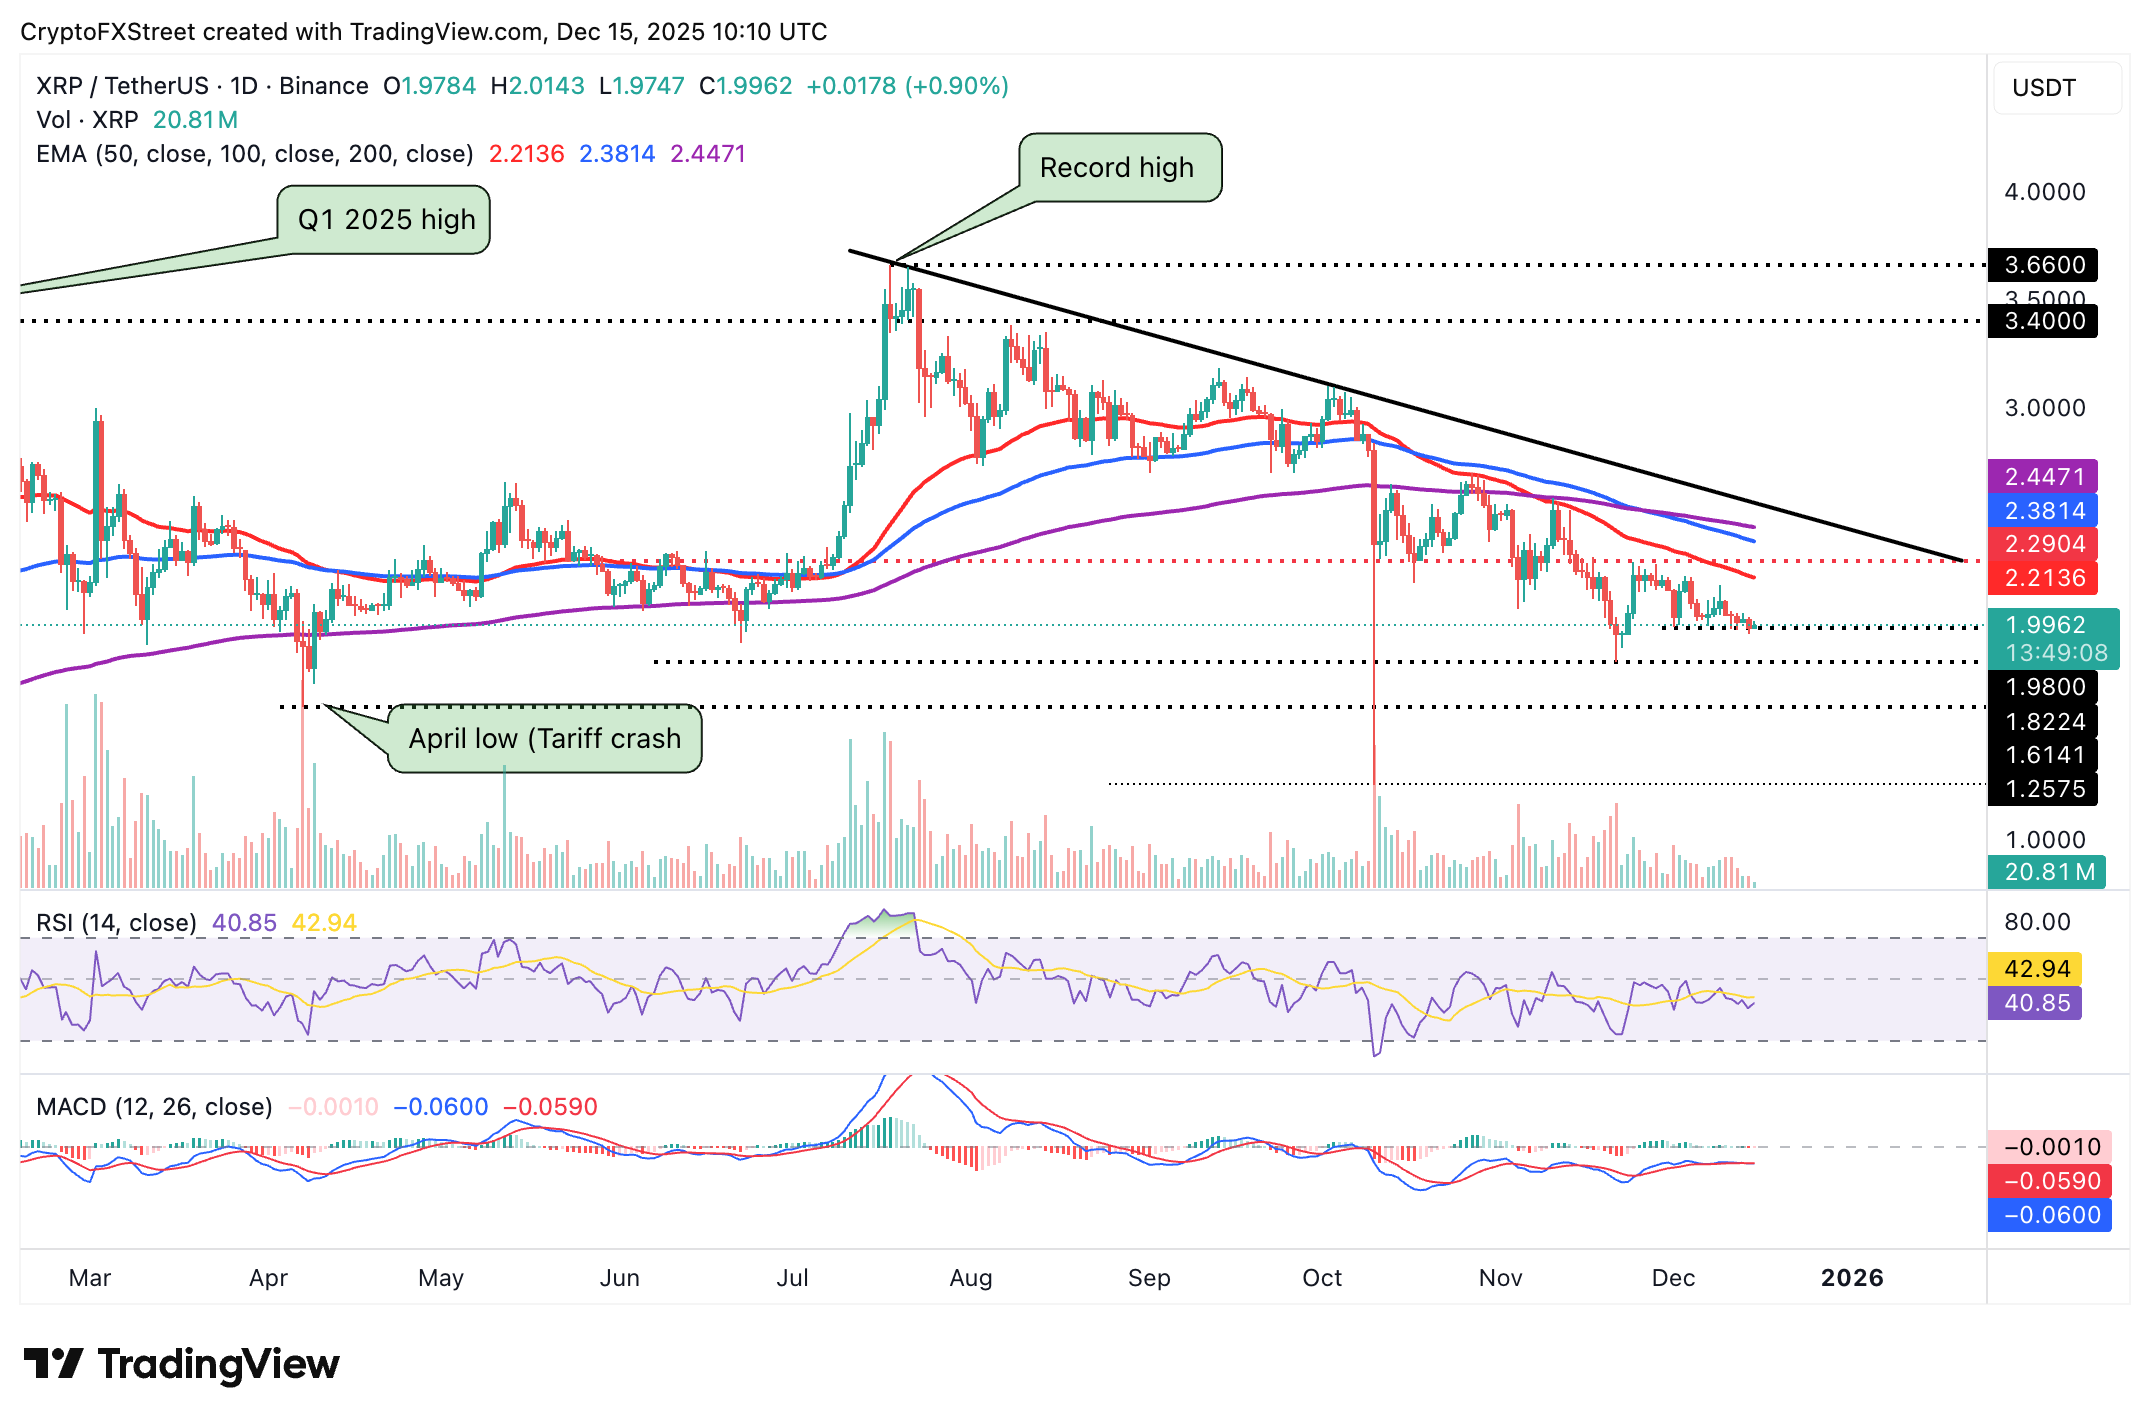
The MACD is extending sideways, with the red signal line below the blue line on the daily chart, supporting a bearish thesis. XRP is also trading below the 50-day EMA at $2.21, the 200-day EMA at $2.38 and the 100-day EMA at $2.45, capping potential recovery. Failure to break the $2.00 initial resistance may push XRP to test the November 21 support at $1.82.
Open Interest, funding rate FAQs
Higher Open Interest is associated with higher liquidity and new capital inflow to the market. This is considered the equivalent of increase in efficiency and the ongoing trend continues. When Open Interest decreases, it is considered a sign of liquidation in the market, investors are leaving and the overall demand for an asset is on a decline, fueling a bearish sentiment among investors.
Funding fees bridge the difference between spot prices and prices of futures contracts of an asset by increasing liquidation risks faced by traders. A consistently high and positive funding rate implies there is a bullish sentiment among market participants and there is an expectation of a price hike. A consistently negative funding rate for an asset implies a bearish sentiment, indicating that traders expect the cryptocurrency’s price to fall and a bearish trend reversal is likely to occur.

يعتمد أكثر من مليون مستخدم على FXStreet للحصول على بيانات سوقية لحظية، وأدوات رسوم بيانية، ورؤى خبراء، وأخبار الفوركس. يساعد تقويمهم الاقتصادي الشامل والندوات التعليمية عبر الويب المتداولين على البقاء على اطلاع واتخاذ قرارات محسوبة. لدى FXStreet فريق يضم حوالي 60 محترفًا موزعين بين مقر برشلونة ومناطق عالمية مختلفة.
اقرأ المزيد


