
Decred Price Forecast: DCR rallies amid low supply availability
بواسطة Vishal Dixit
تاريخ النشر: 6 Feb 2026 | تاريخ التعديل: 6 Feb 2026


المقالات الشائعة

Decred (DCR) rallies nearly 25% at press time on Friday, extending gains after bouncing off a rising trendline. An 11% rise in DCR mining hashrate over the last 30 days, coupled with over 10 million tokens staked, limits the available selling pressure.
- Decred is up nearly 25% so far on Friday, bouncing off a short-term support trendline.
- DCR mining hashrate has increased over 10% in the last 30 days, while more than 60% of the circulation supply is staked.
- The technical outlook for DCR remains bullish with the MACD indicator flashing a buy signal.
Decred (DCR) rallies nearly 25% at press time on Friday, extending gains after bouncing off a rising trendline. An 11% rise in DCR mining hashrate over the last 30 days, coupled with over 10 million tokens staked, limits the available selling pressure. Technically, the rebound in DCR could sustain momentum as the Moving Average Convergence Divergence (MACD) indicator signals a bullish crossover.
Rising mining hashrate and staking add tailwinds to the DCR rally
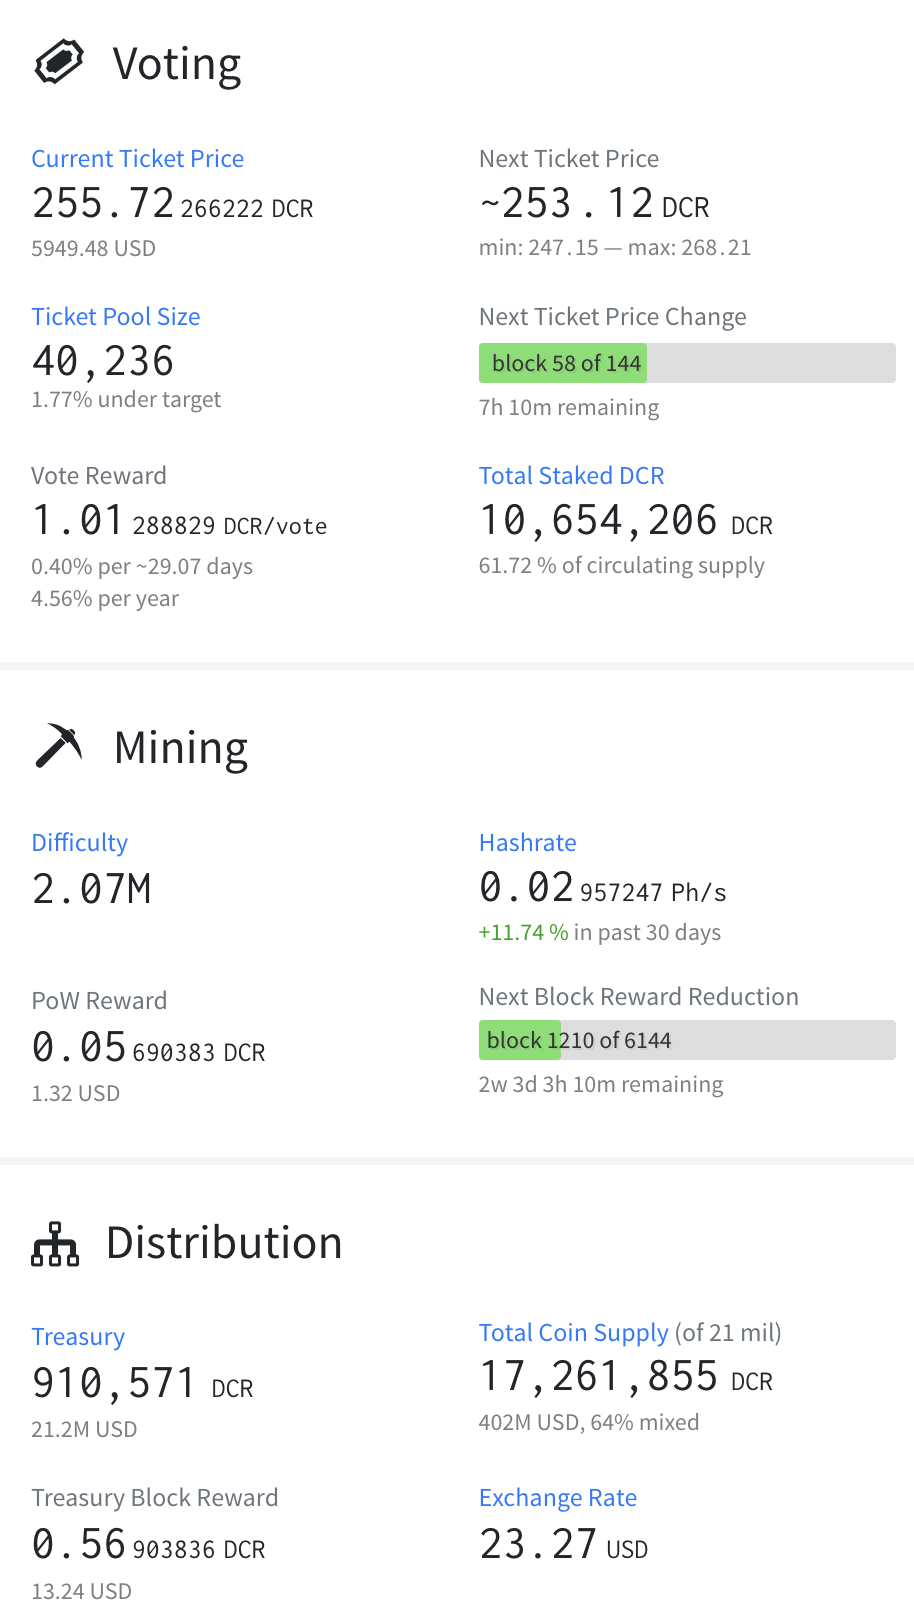
Data shows that the Decred mining hashrate – difficulty or computation power required to produce a new block – has increased by 11.74% in the last 30 days. Typically, an increase in hashrate reflects heightened miner interest, boosting network participation and making it difficult for new token issuance.
At the same time, the total staked DCR amounts to 10.65 million tokens, temporarily sidelining 61.72% of the circulating supply (17.26 million) from supply pressure and indicating high confidence among holders. Additionally, the treasury holds 910,571 DCR valued at over $21 million, further restricting the supply.
Technical outlook: Will DCR extend gains above $30?
Decred approaches the $25 mark with roughly 25% gains so far on Friday, closing towards a bullish weekend. The privacy coin remains above the 50-day and 200-day Exponential Moving Averages (EMAs), maintaining a bullish bias.
The Moving Average Convergence Divergence (MACD) line crosses above the signal line on the daily chart, showing a bullish crossover. The MACD histogram rises above the zero line, suggesting a renewed bullish momentum.
The Relative Strength Index (RSI) is at 68 on the same timeframe, indicating a move toward the overbought zone and firm buying pressure. However, a steep rise into the overbought zone could attract short-term sellers.
The DCR rally approaches the 38.2% Fibonacci retracement level, drawn from the November 4 high of $70 to the December 23 low of $14.21, at $26.12, which serves as immediate resistance. A daily close above it would open the path toward the 50% Fibonacci retracement at $31.53.
In the event of a pullback, the 23.6% Fibonacci retracement level at $20.70, followed by the rising trendline connecting the December 23 and January 11 lows near $17.50, could provide support.
(The technical analysis of this story was written with the help of an AI tool.)

يعتمد أكثر من مليون مستخدم على FXStreet للحصول على بيانات سوقية لحظية، وأدوات رسوم بيانية، ورؤى خبراء، وأخبار الفوركس. يساعد تقويمهم الاقتصادي الشامل والندوات التعليمية عبر الويب المتداولين على البقاء على اطلاع واتخاذ قرارات محسوبة. لدى FXStreet فريق يضم حوالي 60 محترفًا موزعين بين مقر برشلونة ومناطق عالمية مختلفة.
اقرأ المزيد


