
Derive Price Forecast: Rising derivatives demand positions DRV for further gains
بواسطة Vishal Dixit
تم التحديث: 29 Jun 2026


المقالات الشائعة

Derive (DRV) edges higher on Monday, extending its third consecutive day of recovery above $0.1000. The increasing volume and fees collected through Perpetuals and Options contracts suggest that Derive’s market share in crypto derivatives is growing.
- Derive holds above the $0.1000 psychological level on Monday, following a 16% gain the previous day.
- Rising Perpetual and Options volumes and fees position Derive as an emerging derivatives trading platform in the crypto market.
- The technical outlook for DRV is mildly bullish, with price approaching key resistance, setting up a potential breakout rally.
Derive (DRV) edges higher on Monday, extending its third consecutive day of recovery above $0.1000. The increasing volume and fees collected through Perpetuals and Options contracts suggest that Derive’s market share in crypto derivatives is growing. The technical outlook is optimistically bullish for DRV, as a steady recovery run approaches a key resistance level near $0.1100, with a potential breakout rally in sight.
Renewed derivatives demand on Derive
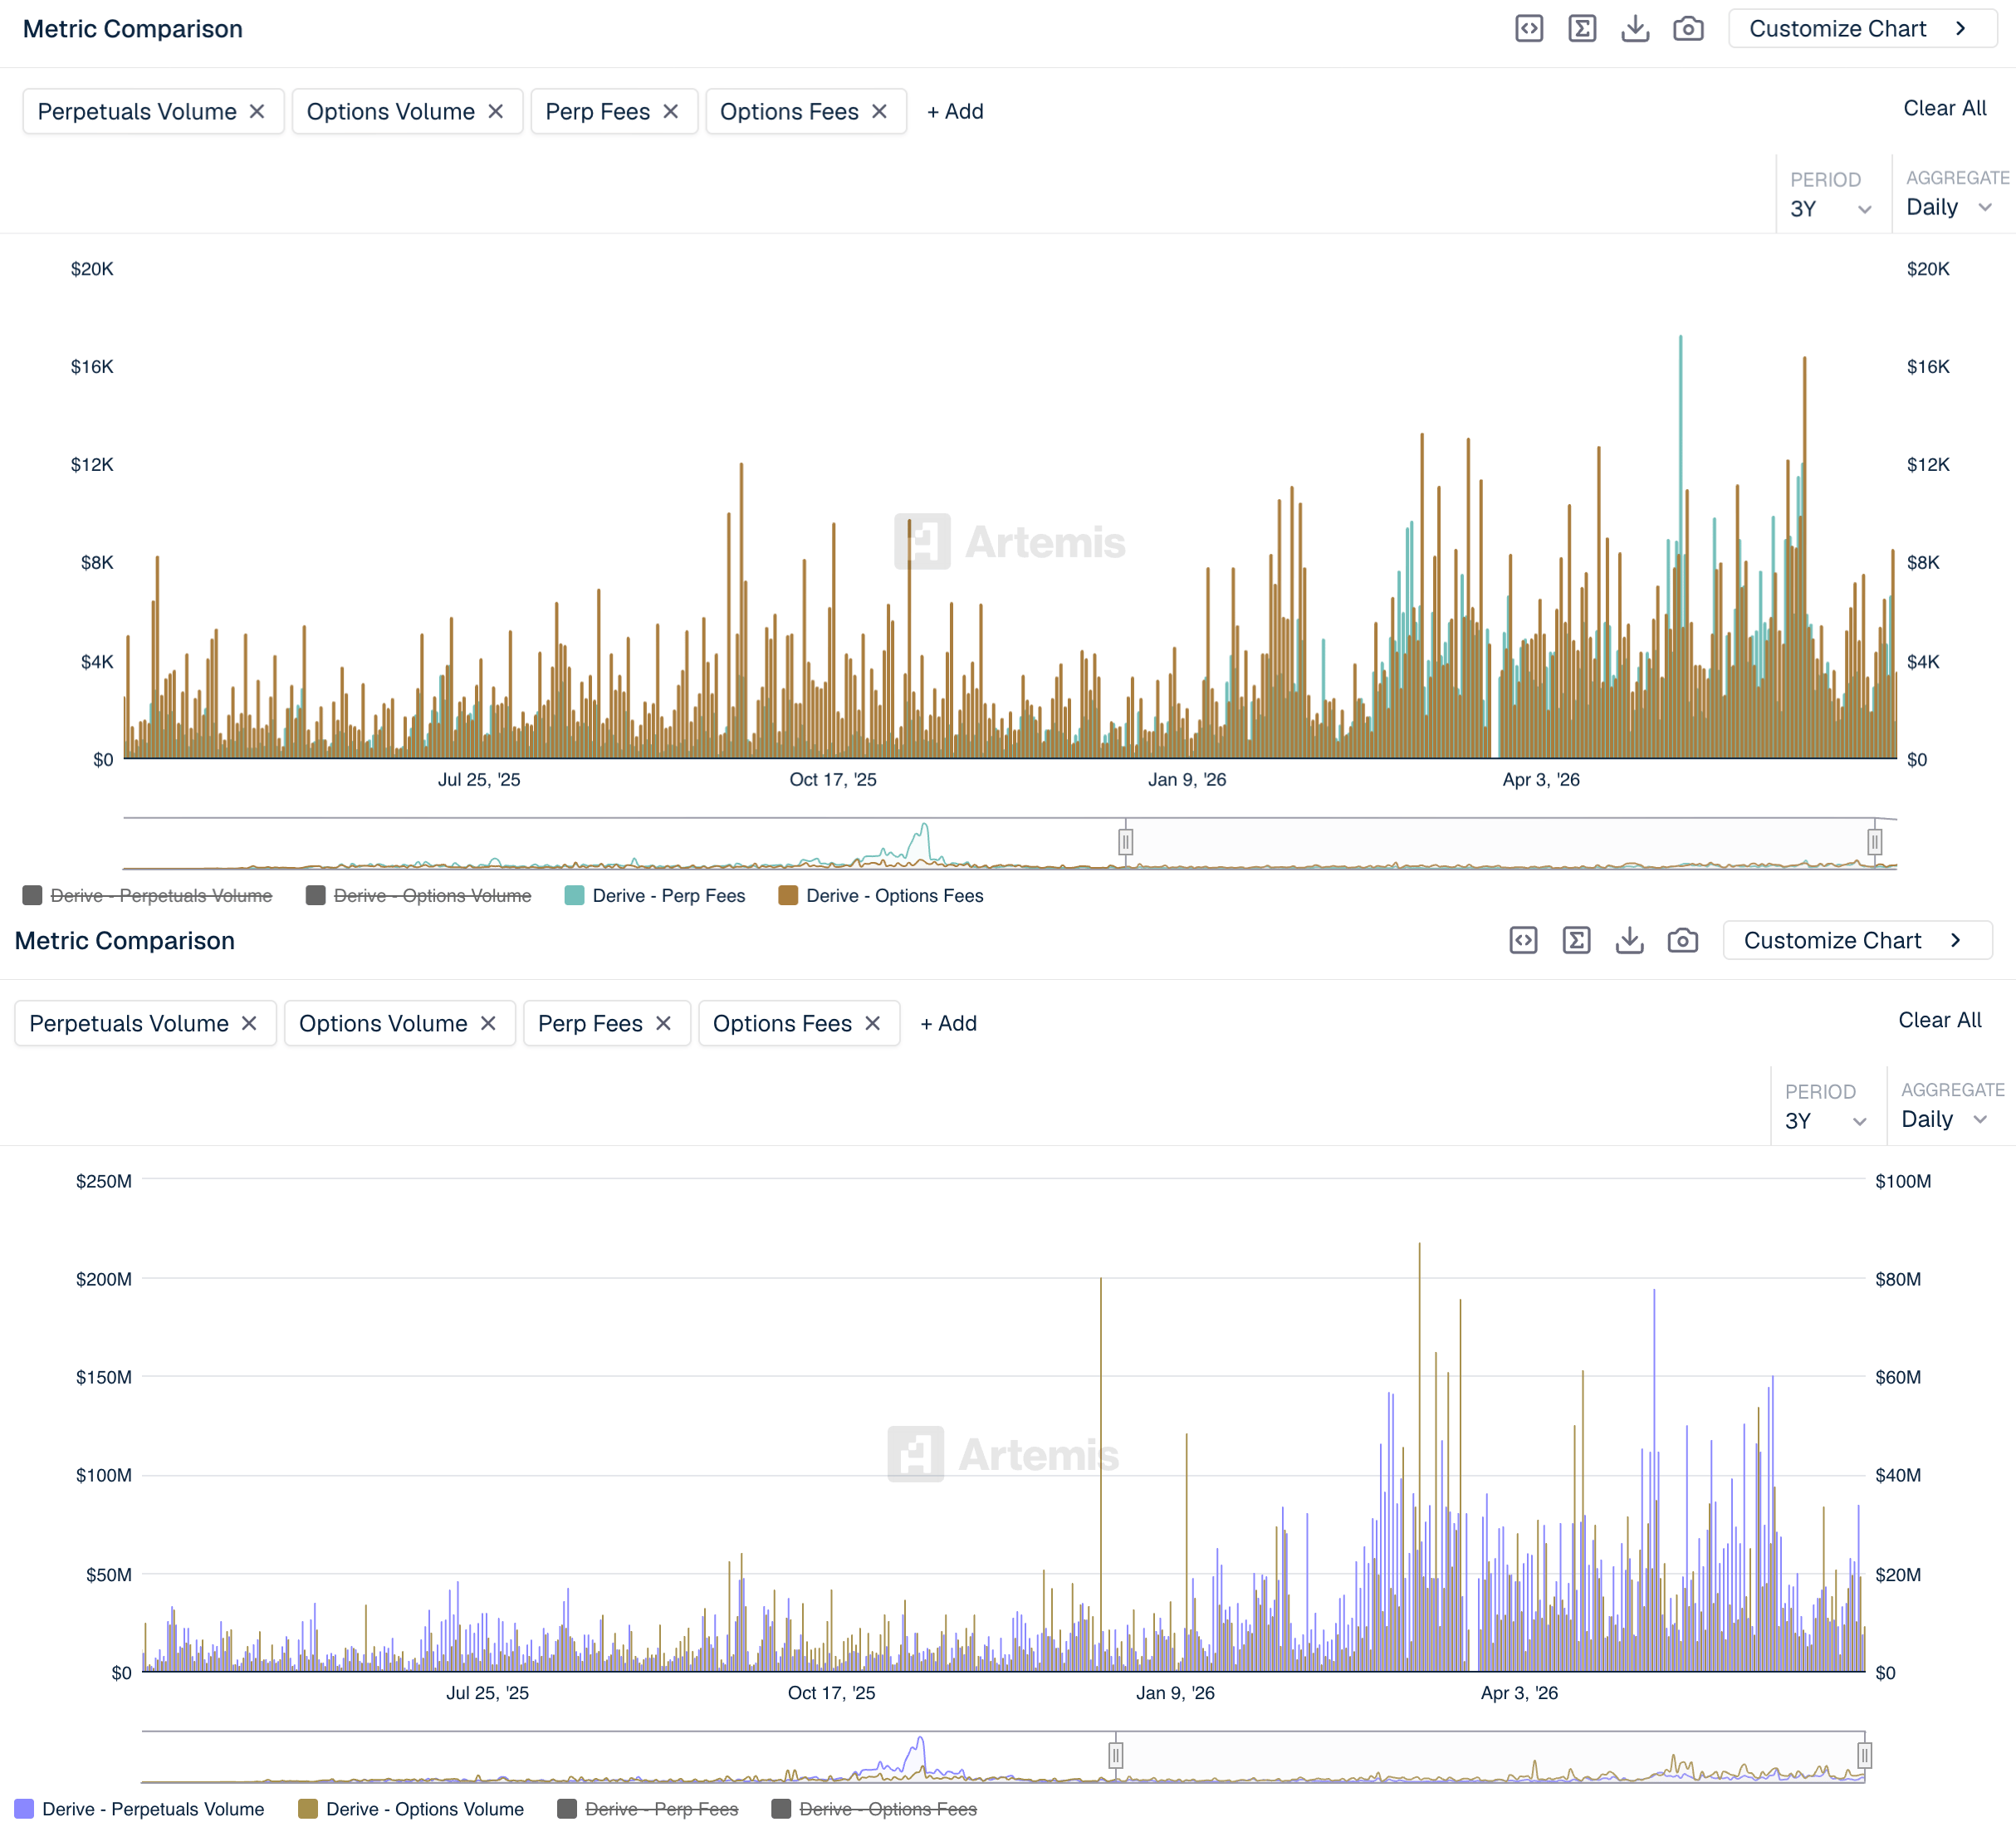
Derive, an emerging self-custodial derivatives platform, is gaining momentum and market share despite a broader market risk-off sentiment. Artemis data show a fresh spike in daily Perpetuals and Options volume on Derive, stabilizing around $20 million in June, with peaks of around $80 million in March, following muted demand in late 2025. In addition, fees collected through Perpetuals and Options follow a similar trend, averaging around $8,000 in June.
Technical outlook: Will the DRV price hit $0.15?
Derive edges above $0.1000 on Monday, maintaining a bullish near-term bias as price remains above the 50- and 200-day Exponential Moving Averages (EMAs) at $0.0914 and $0.0752, respectively. DRV maintains a broadly upward trend, supported by a rising trendline near $0.0850.
From a technical perspective, the 78.6% Fibonacci retracement level at $0.1101, measured from the $0.0354 to $0.1500 upswing, serves as immediate resistance. A decisive close above $0.1101 could result in an extended recovery toward the May 21 high of $0.1500, followed by the 127.2% Fibonacci extension level at $0.2220.
That said, the Moving Average Convergence Divergence (MACD) rises above its signal line with an uptick, indicating renewed bullish momentum. At the same time, the Relative Strength Index (RSI) around 58 reinforces the improving upside momentum thesis rather than exhaustion.
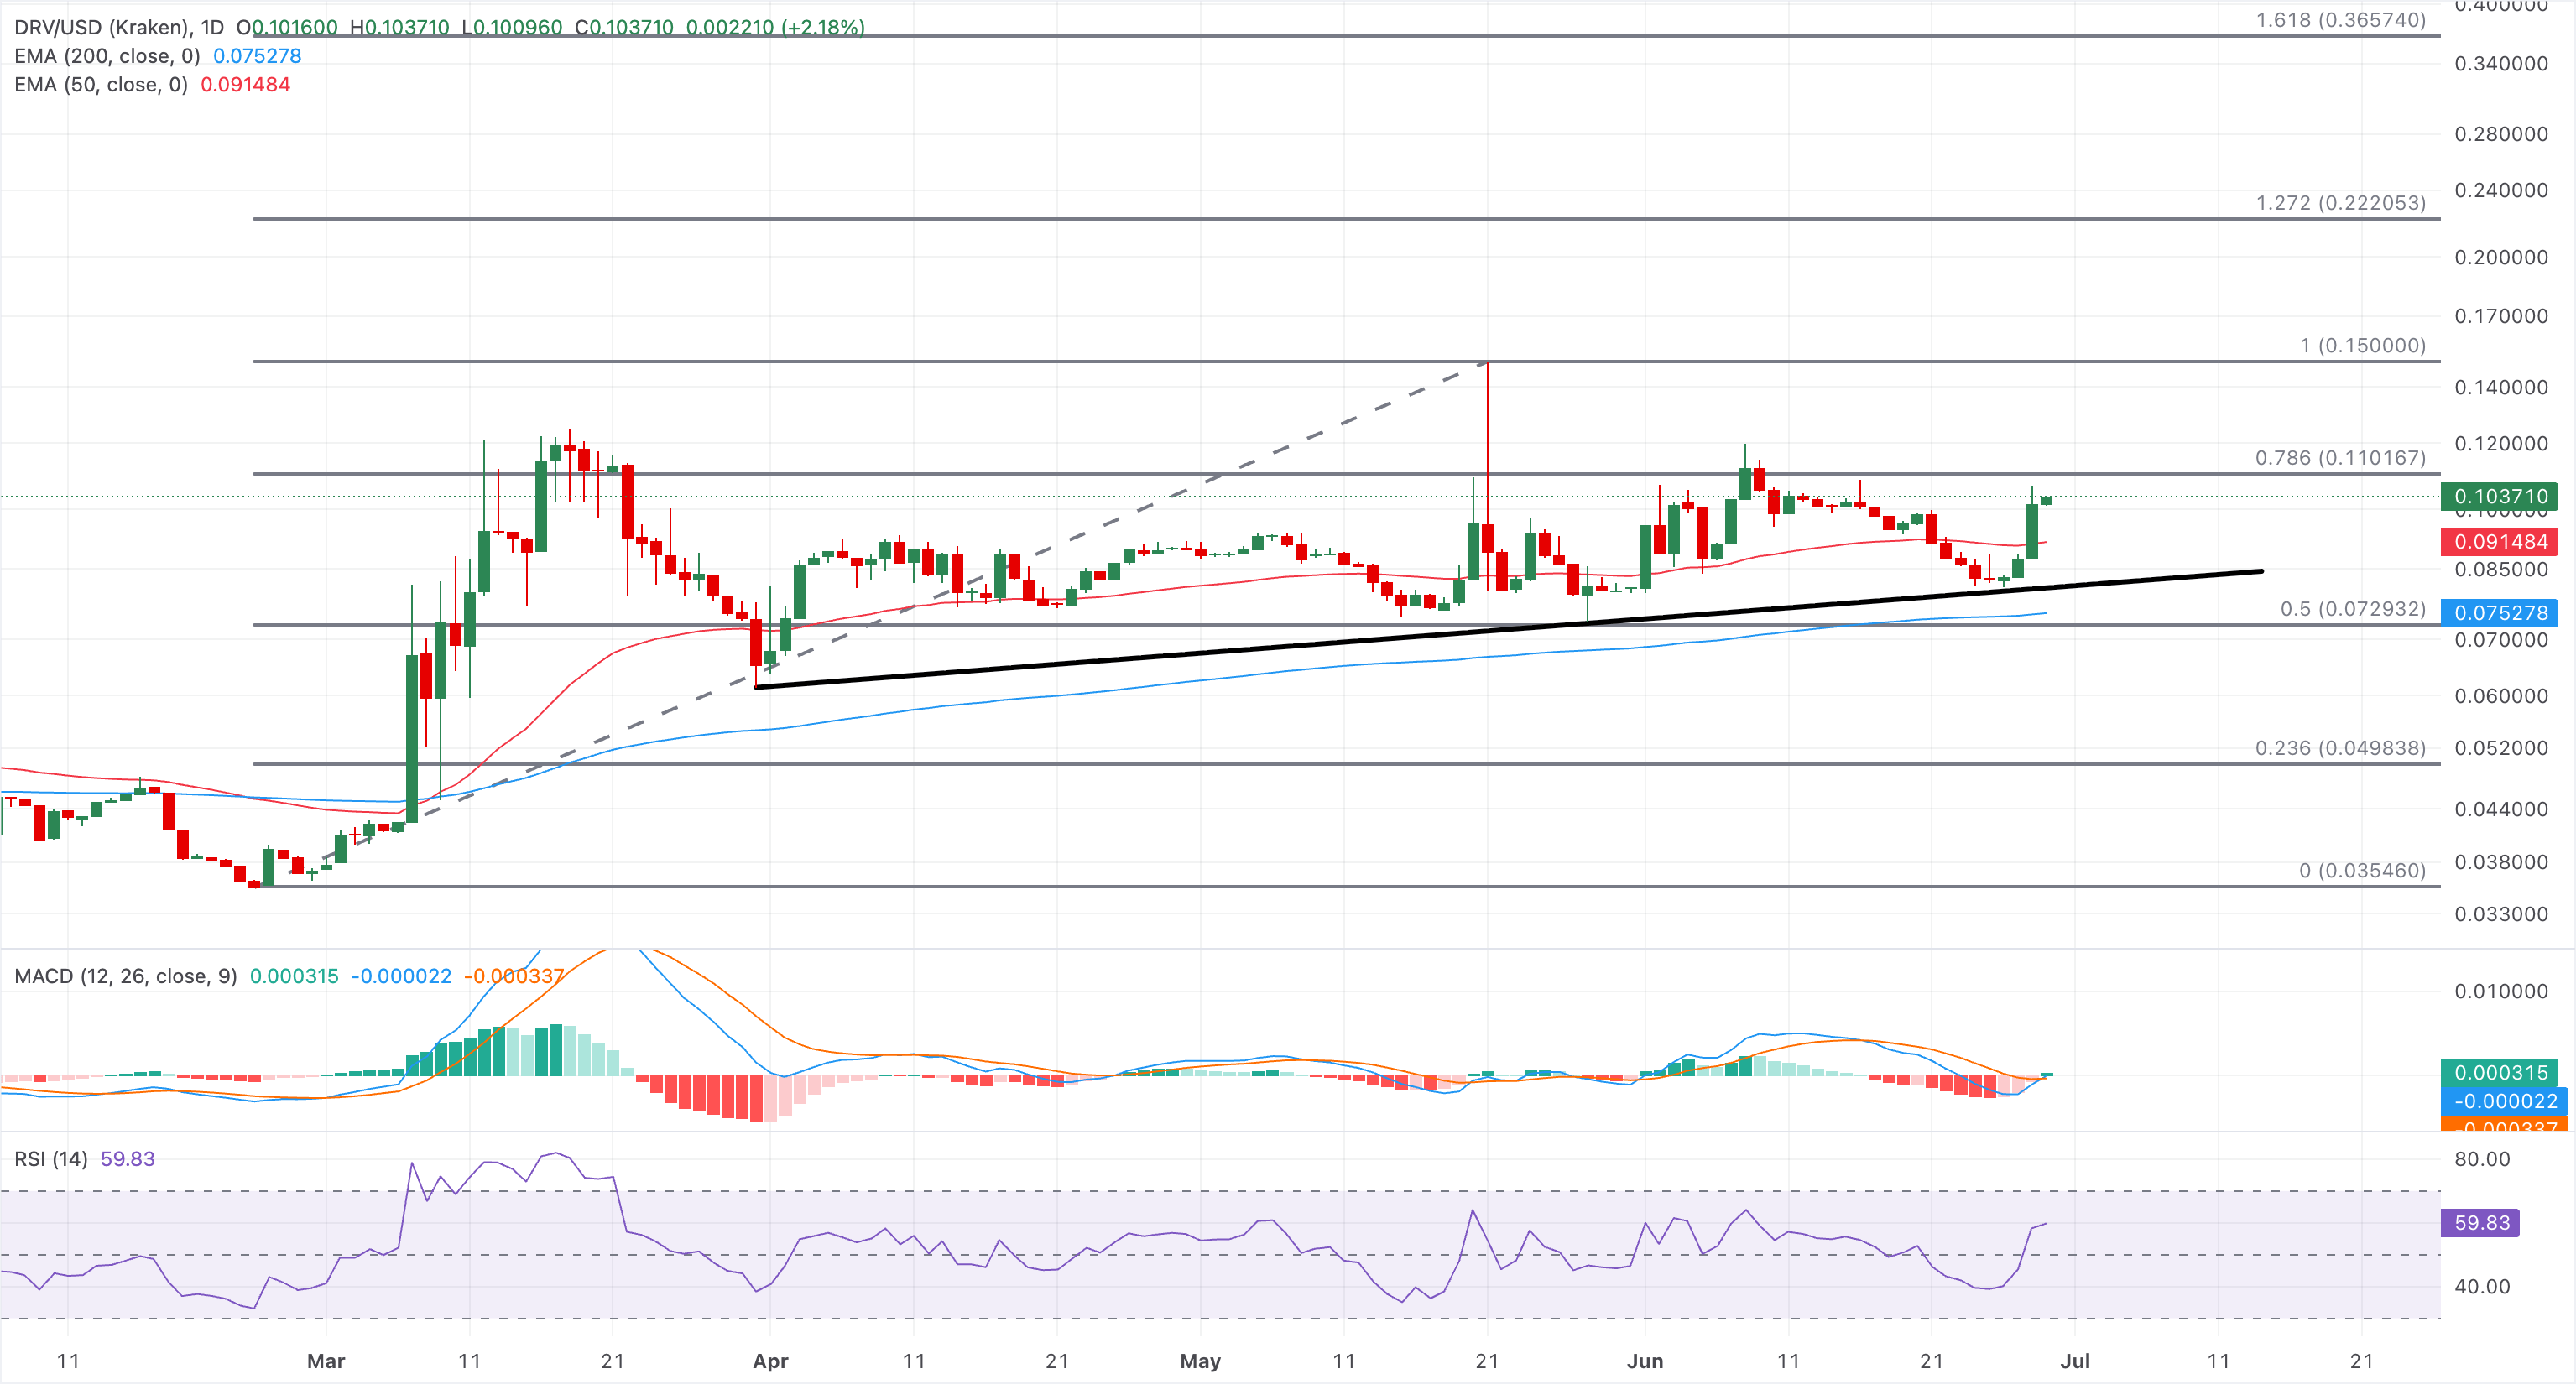
On the downside, immediate support is located at the 50-day EMA at $0.0914, followed by the rising support trendline near $0.8500. Further reinforcing downside resilience, the 200-day EMA is around $0.0752, close to the 50% retracement level of $0.0927, underscoring the broader bullish structure.
(The technical analysis of this story was written with the help of an AI tool.)

يعتمد أكثر من مليون مستخدم على FXStreet للحصول على بيانات سوقية لحظية، وأدوات رسوم بيانية، ورؤى خبراء، وأخبار الفوركس. يساعد تقويمهم الاقتصادي الشامل والندوات التعليمية عبر الويب المتداولين على البقاء على اطلاع واتخاذ قرارات محسوبة. لدى FXStreet فريق يضم حوالي 60 محترفًا موزعين بين مقر برشلونة ومناطق عالمية مختلفة.
اقرأ المزيد


