
Dogecoin Price Forecast: DOGE builds momentum for a breakout
بواسطة John Isige
تم التحديث: 14 May 2026


المقالات الشائعة

Dogecoin (DOGE) gains momentum above $0.1100, rising alongside crypto majors on Thursday. The meme coin signals strong recovery potential, as momentum indicators align with growing retail demand.
- Dogecoin rebounds alongside the broader crypto market, building on the demand at $0.1100.
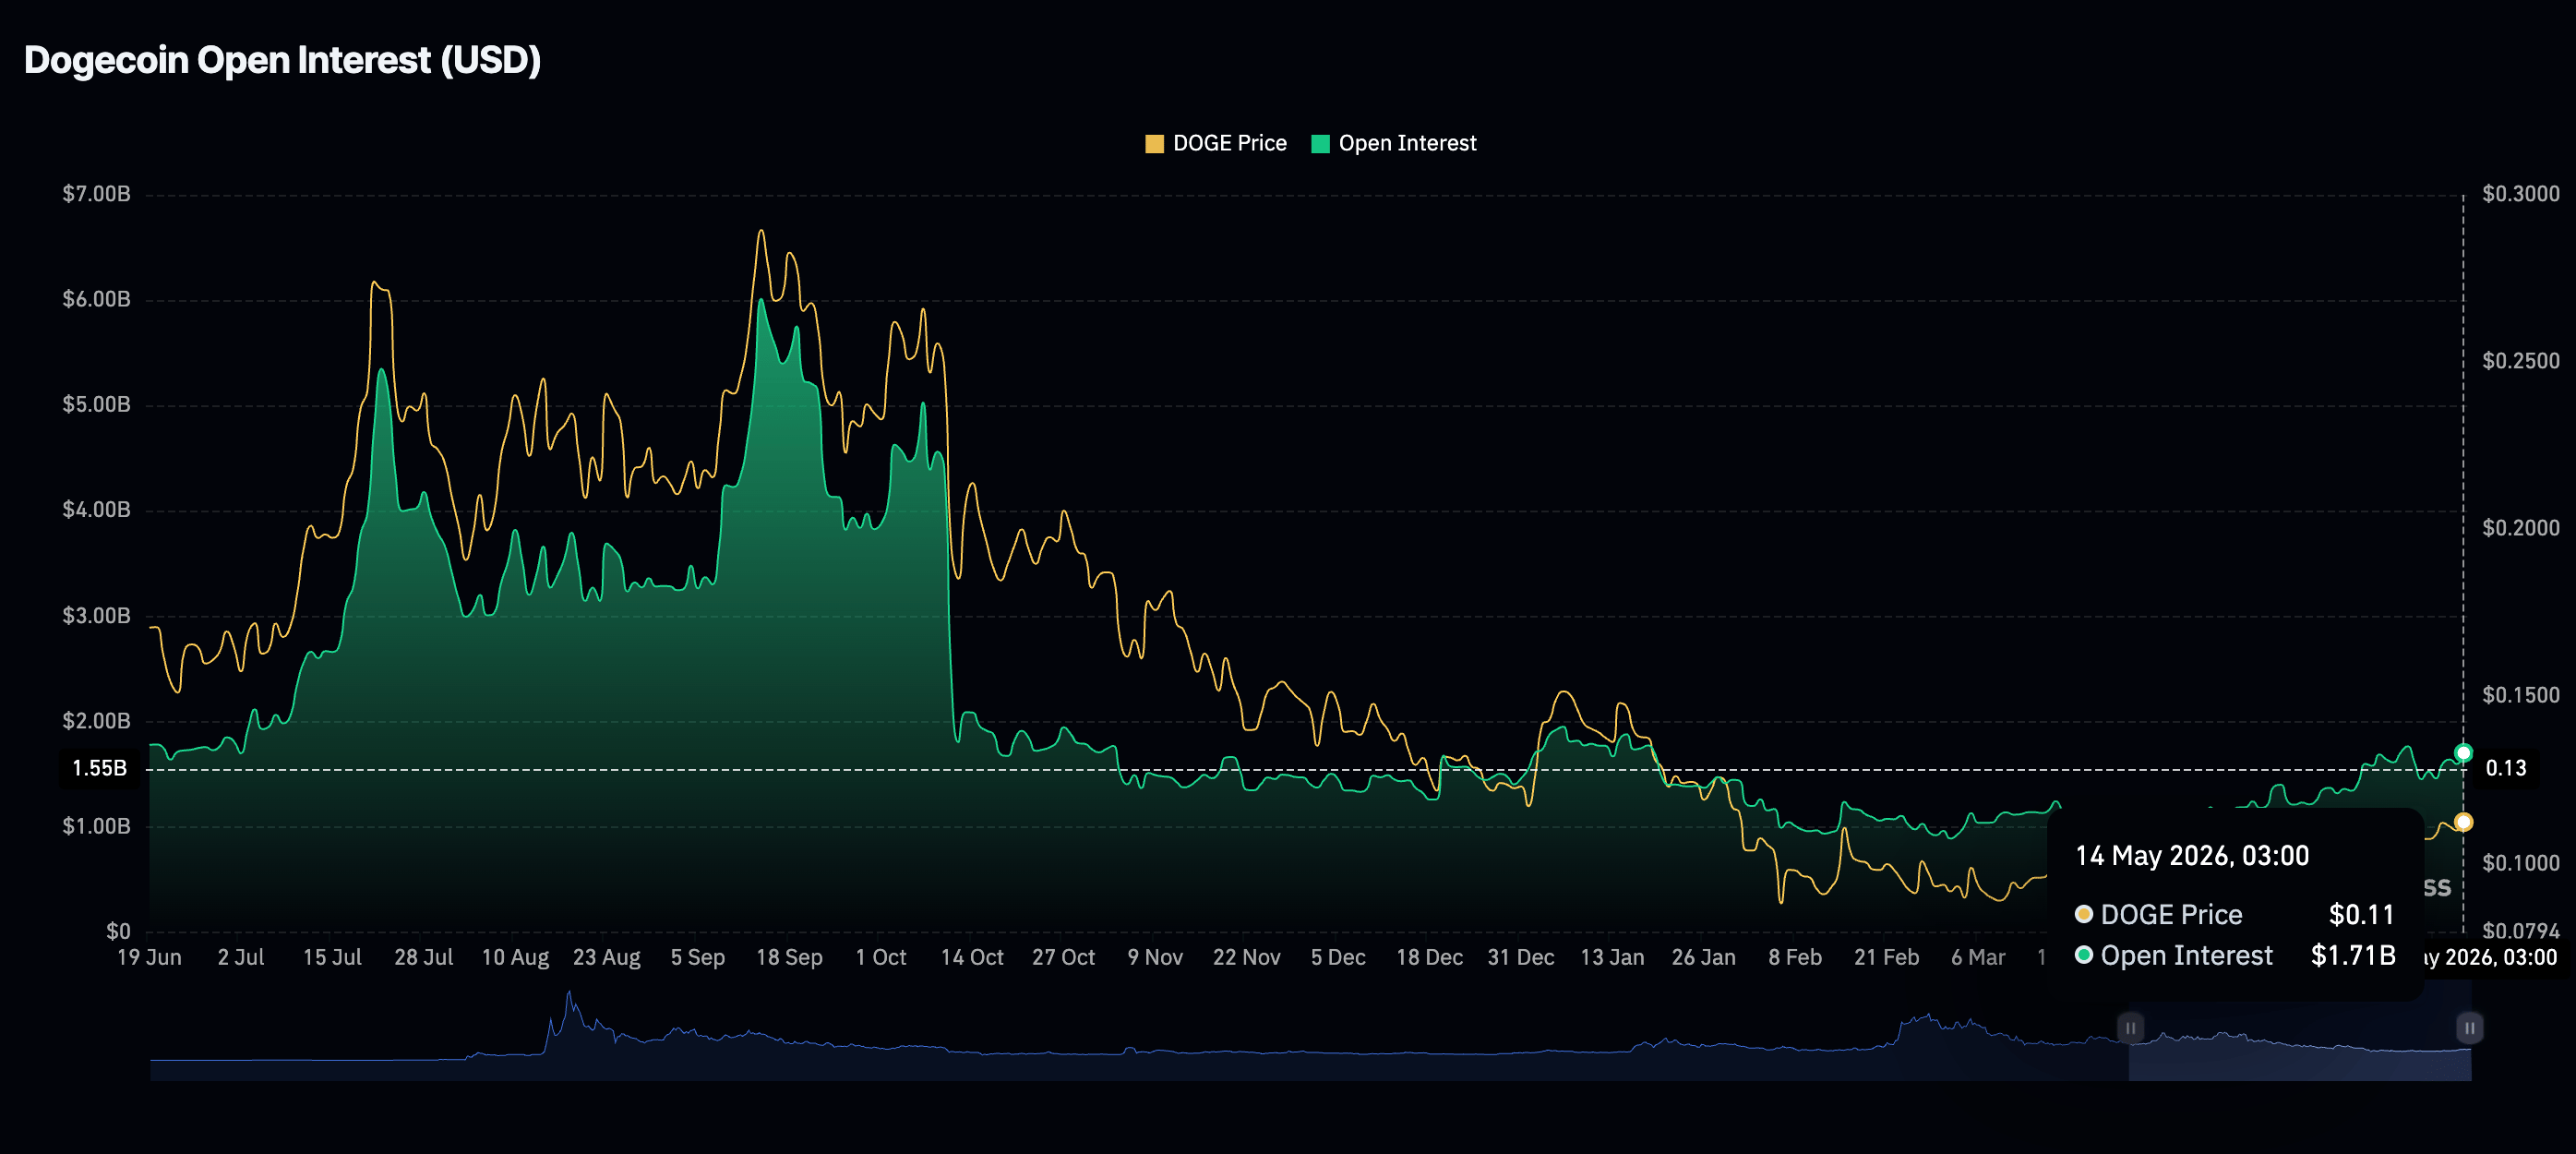
- Dogecoin sees improvement in retail demand as perpetual futures Open Interest rises to $1.71 billion.
- The uptrend in the 50-day and 100-day EMAs backs DOGE’s short to medium-term recovery outlook.
Dogecoin (DOGE) gains momentum above $0.1100, rising alongside crypto majors on Thursday. The meme coin signals strong recovery potential, as momentum indicators align with growing retail demand.
Retail interest steadies as Dogecoin rises
Dogecoin has demonstrated strong retail participation, as evidenced by the continued expansion in perpetual futures Open Interest (OI). Data from CoinGlass shows OI climbed to $1.71 billion on Thursday, a notable increase from $1.60 billion the day before.
While OI briefly pulled back from its May high of $1.77 billion to a local low of $1.46 billion, the metric has steadily trended higher since hitting its yearly low of $894 million in March.
Dogecoin’s price action remains closely correlated with growth in the derivatives market, underscoring how retail-driven demand remains a key catalyst for upward momentum.
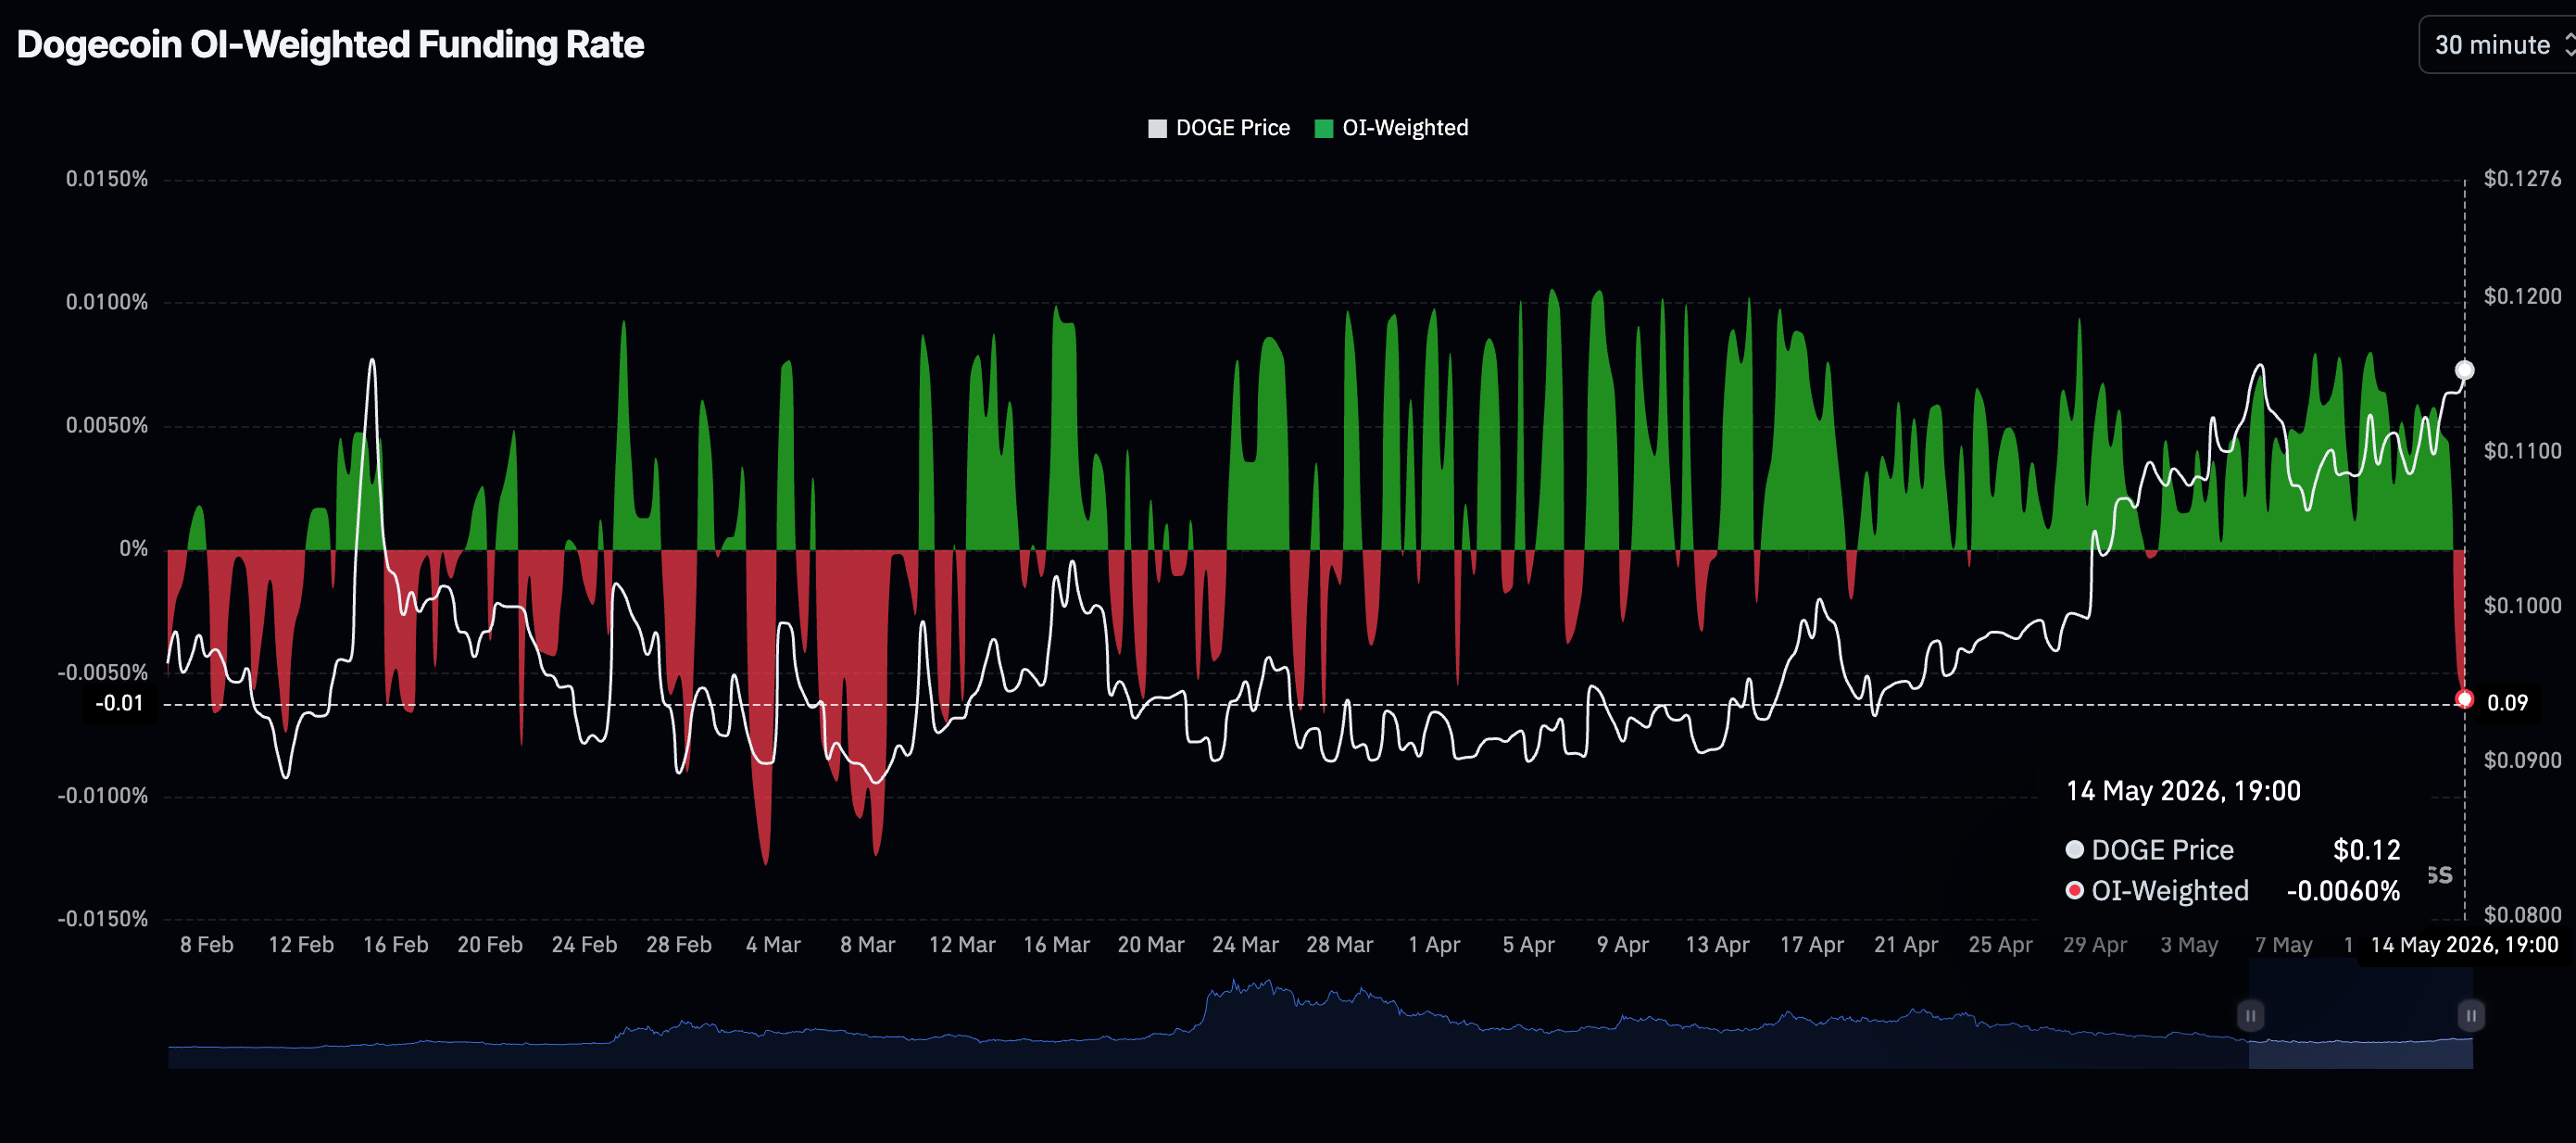
However, investors should remain cautiously optimistic, given that the OI-Weighted Funding Rate has retreated to -0.0060%, in negative territory. This indicates that market participants are incurring higher costs to maintain their short positions.
Should Dogecoin struggle to surpass key resistance levels, an uptick in liquidations could trigger a sharp downside move.
Price analysis: Dogecoin poised to extend recovery
Dogecoin trades at $0.1145, maintaining a bullish near-term bias as price holds above the 50-day and 100-day Exponential Moving Averages (EMAs), which are clustered between roughly $0.1030 and $0.1060.
The Parabolic SAR at $0.1056 sits below the spot and reinforces underlying trend support, while the Relative Strength Index (RSI) near 66 on the daily chart hints at firm but approaching overbought momentum. This outlook suggests upside pressure persists but may soon encounter more meaningful supply toward the 200-day EMA at $0.1231.
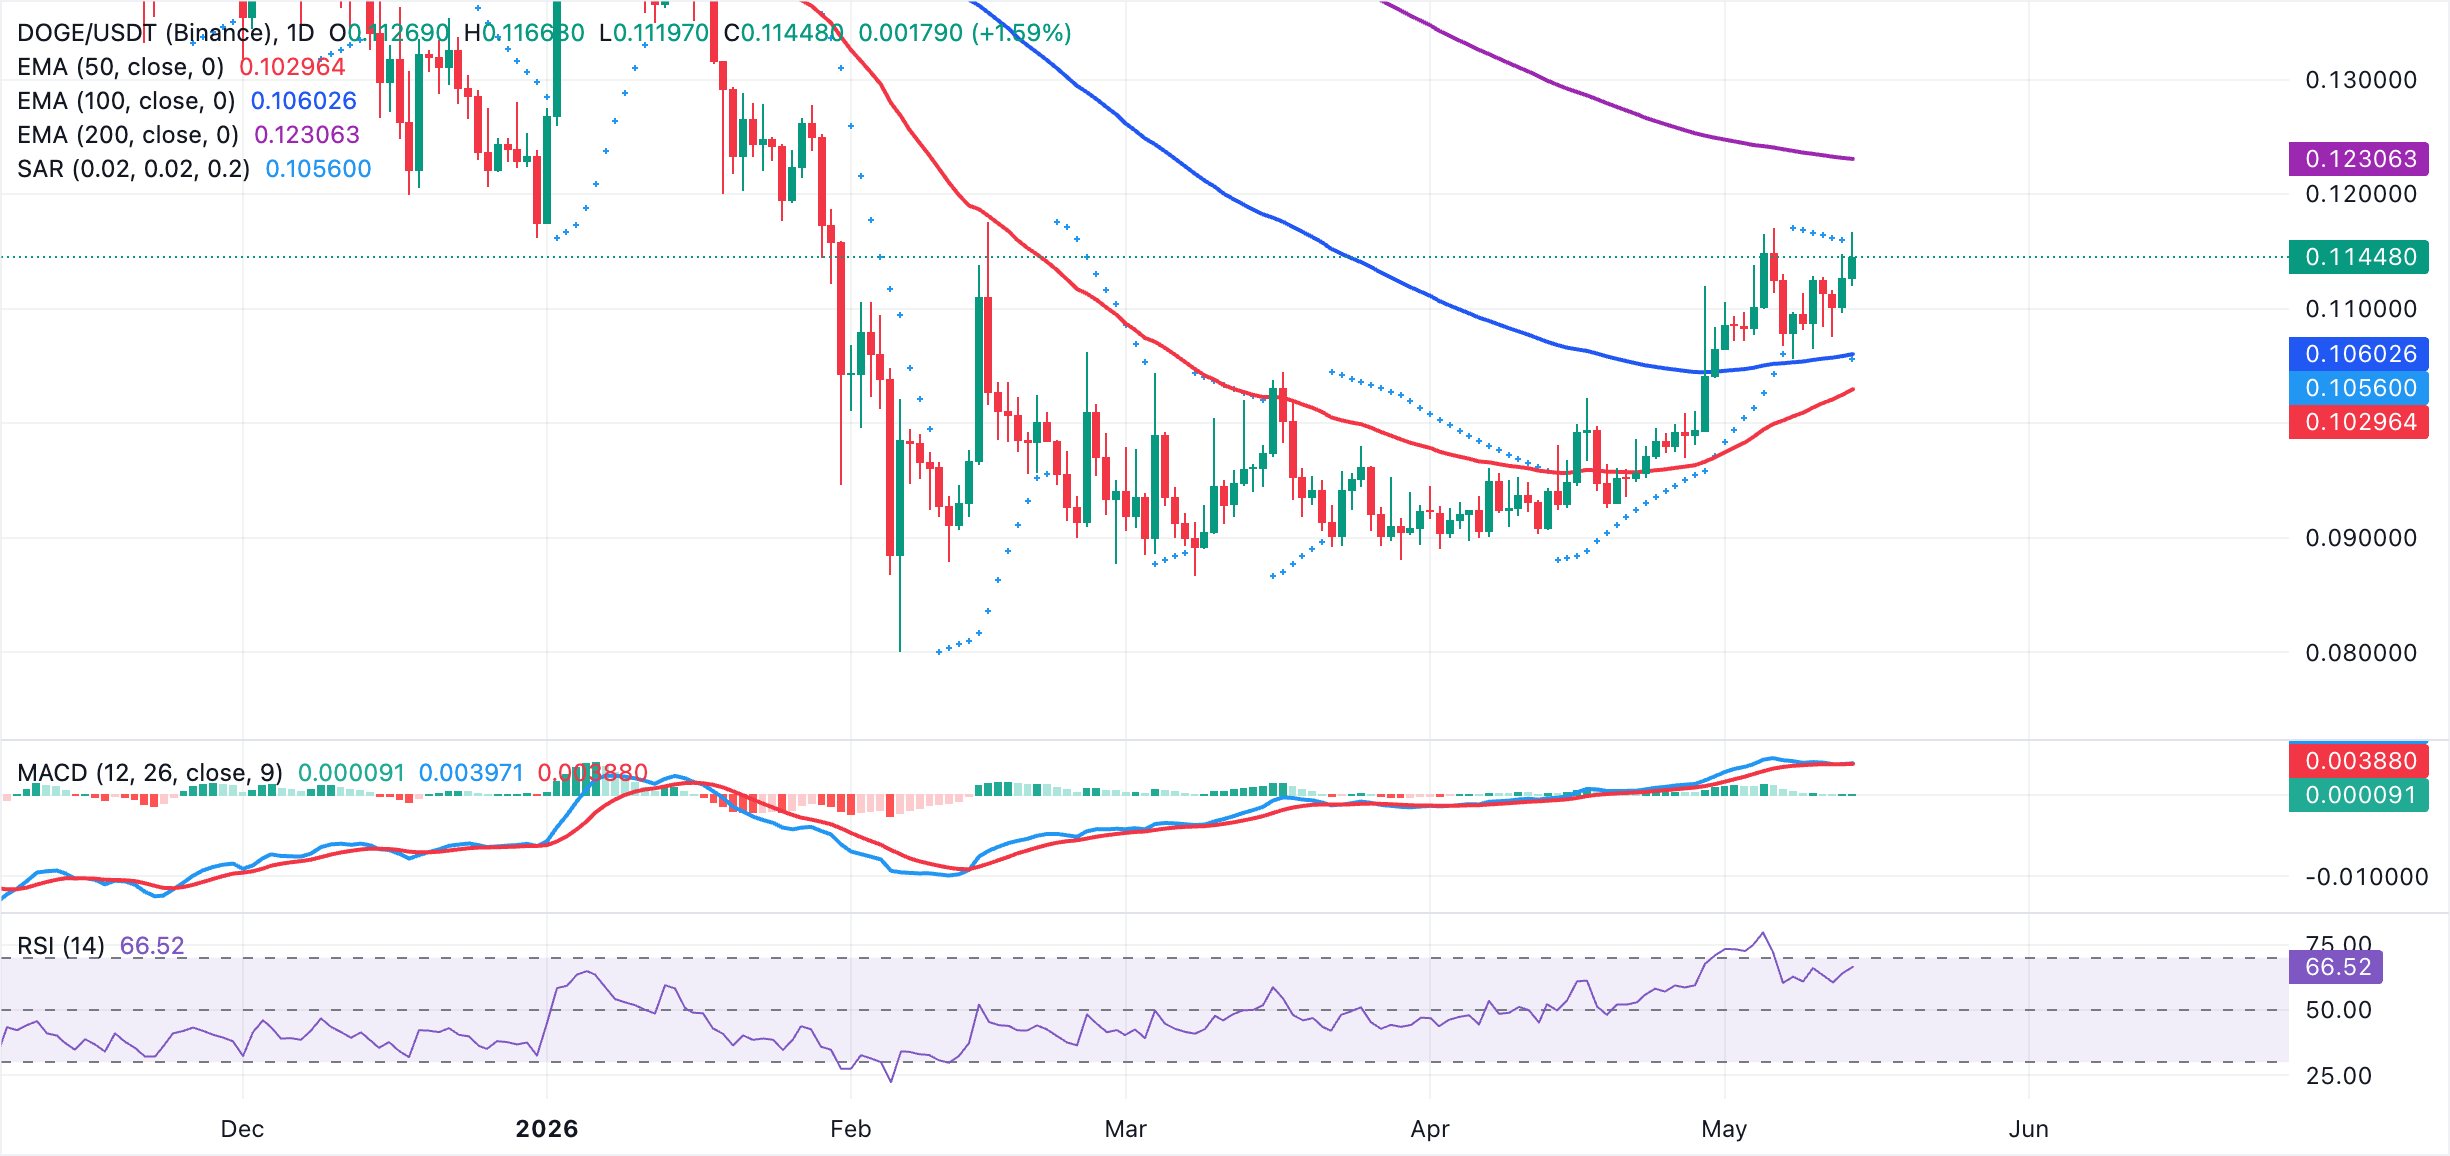
On the topside, the 200-day EMA around $0.1231 is the next key resistance that bulls would need to reclaim to extend the advance toward higher levels. On the downside, initial support is seen near the current pivot around $0.1145, ahead of a dense demand band formed by the 100-day EMA at $0.1060, the Parabolic SAR at $0.1056 and the 50-day EMA at $0.1030. A pullback below these demand zones would be expected to attract dip-buying interest while the broader bullish structure remains intact.
(The technical analysis of this story was written with the help of an AI tool.)
Open Interest, funding rate FAQs
Higher Open Interest is associated with higher liquidity and new capital inflow to the market. This is considered the equivalent of increase in efficiency and the ongoing trend continues. When Open Interest decreases, it is considered a sign of liquidation in the market, investors are leaving and the overall demand for an asset is on a decline, fueling a bearish sentiment among investors.
Funding fees bridge the difference between spot prices and prices of futures contracts of an asset by increasing liquidation risks faced by traders. A consistently high and positive funding rate implies there is a bullish sentiment among market participants and there is an expectation of a price hike. A consistently negative funding rate for an asset implies a bearish sentiment, indicating that traders expect the cryptocurrency’s price to fall and a bearish trend reversal is likely to occur.

يعتمد أكثر من مليون مستخدم على FXStreet للحصول على بيانات سوقية لحظية، وأدوات رسوم بيانية، ورؤى خبراء، وأخبار الفوركس. يساعد تقويمهم الاقتصادي الشامل والندوات التعليمية عبر الويب المتداولين على البقاء على اطلاع واتخاذ قرارات محسوبة. لدى FXStreet فريق يضم حوالي 60 محترفًا موزعين بين مقر برشلونة ومناطق عالمية مختلفة.
اقرأ المزيد


