
Dogecoin Price Forecast: DOGE holds a neutral tone with emerging downside risks
بواسطة Manish Chhetri
تم التحديث: 7 Apr 2026


المقالات الشائعة

Dogecoin (DOGE) continues to trade below $0.091 on Tuesday as it started the week with mild selling, falling to break above key resistance. The price action remains largely range-bound, and underlying metrics are beginning to tilt bearish.
- Dogecoin trades in the red on Tuesday after being rejected at the key resistance level the previous day.
- On-chain and derivatives data back bearish sentiment with declining social dominance, negative funding rates and rising short bets.
- The technical outlook suggests a neutral stance with a slight bearish tilt, as momentum indicators signal weakening strength.
Dogecoin (DOGE) continues to trade below $0.091 on Tuesday as it started the week with mild selling, falling to break above key resistance. The price action remains largely range-bound, and underlying metrics are beginning to tilt bearish. Weakening social interest and negative derivatives data signals fading momentum, leaving meme coin with a neutral outlook but increasing downside risks in the near term.
On-chain and derivatives metrics show bearish bias
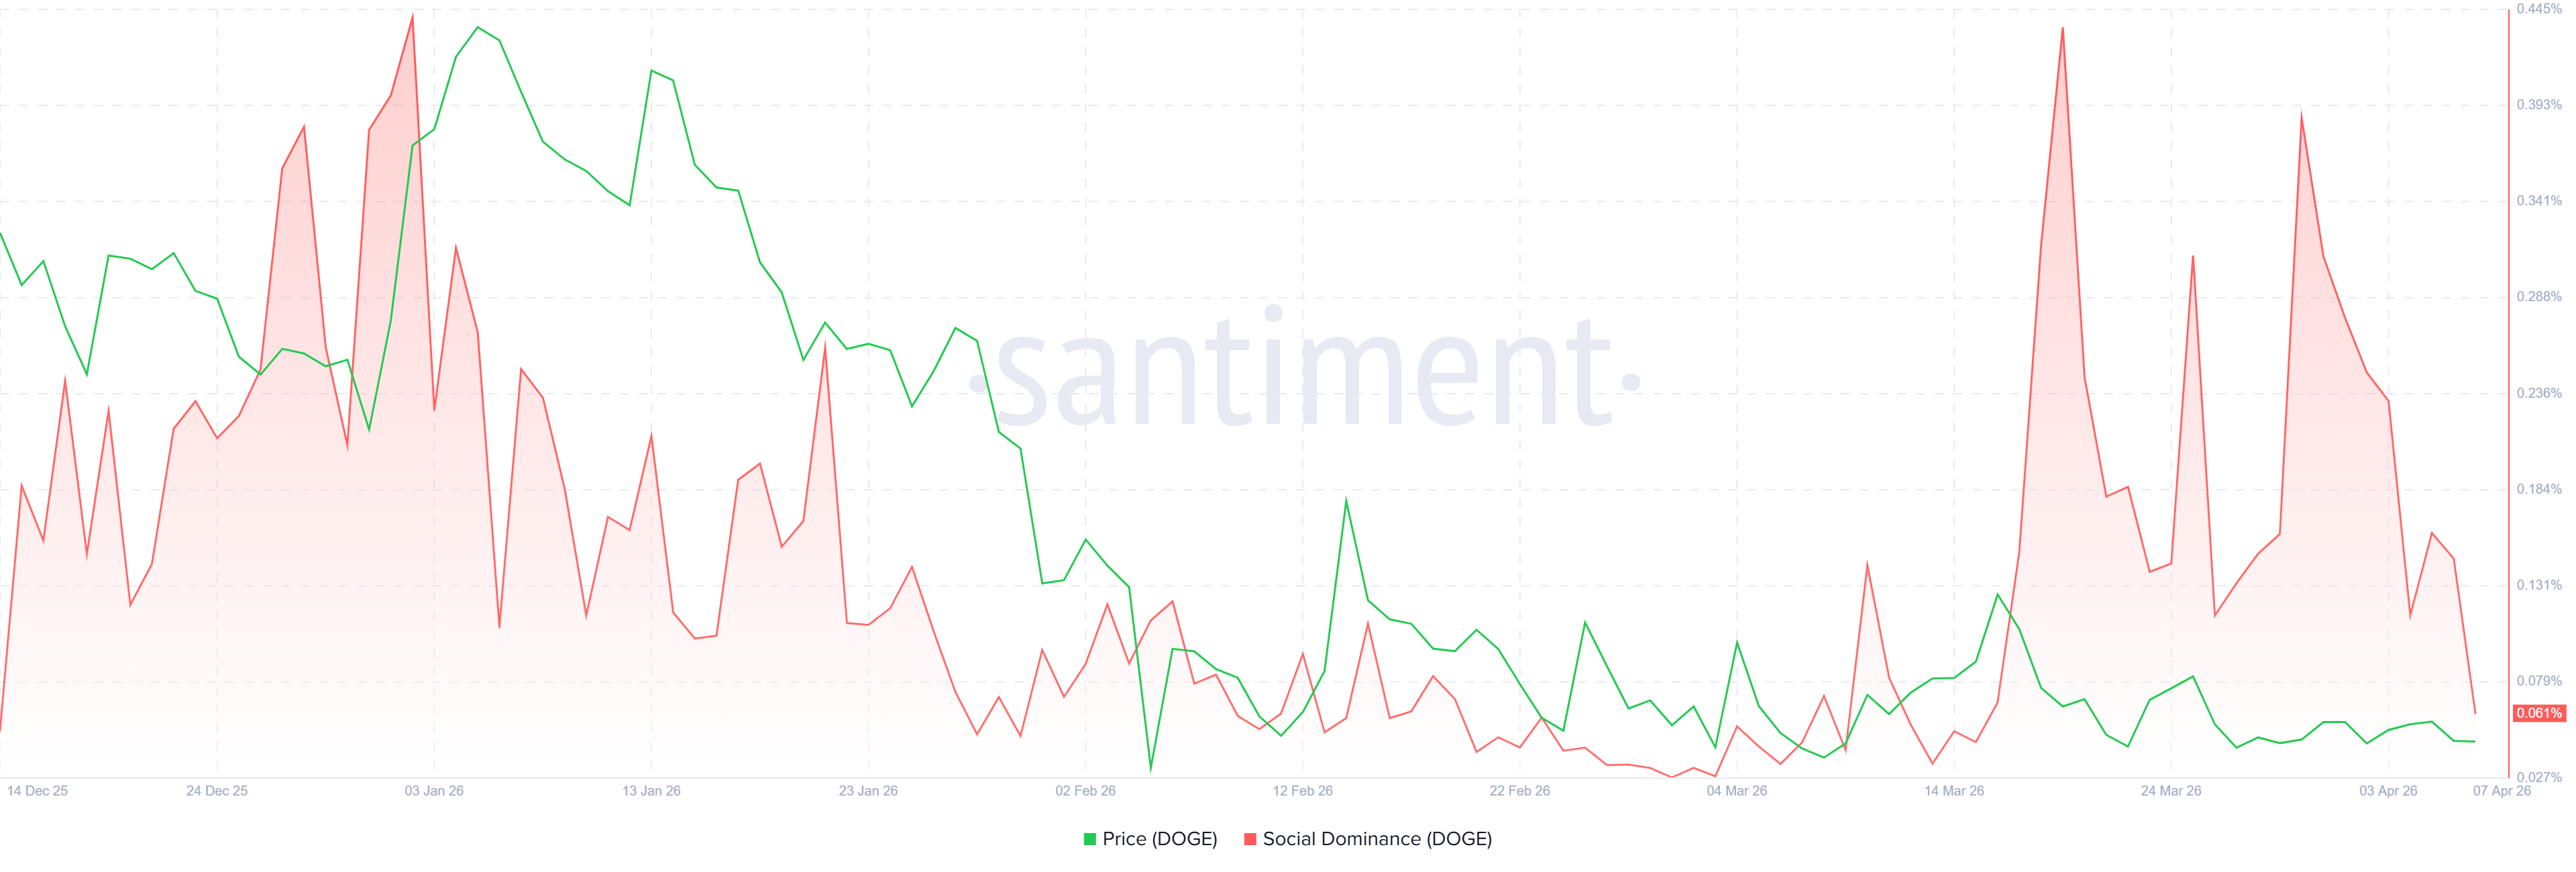
Santiment’s Social Dominance metric for Dogecoin supports a bearish outlook. The index measures the share of DOGE-related discussions across the cryptocurrency media. It has been in a downtrend since the end of March, trading at 0.061% on Tuesday, near March lows. This fall indicates fading market interest and sentiment among DOGE investors.
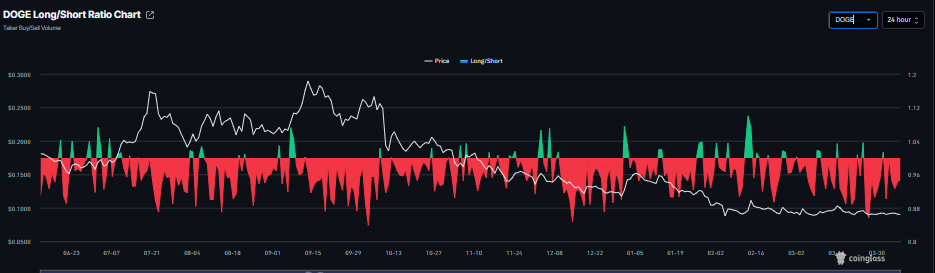
On the derivatives side, CoinGlass’s Dogecoin long-to-short ratio is currently at 0.94 on Tuesday, nearing its lowest level over a month. This ratio is still below 1, reflecting bearish sentiment in the markets, as more traders are betting the asset’s price will fall.
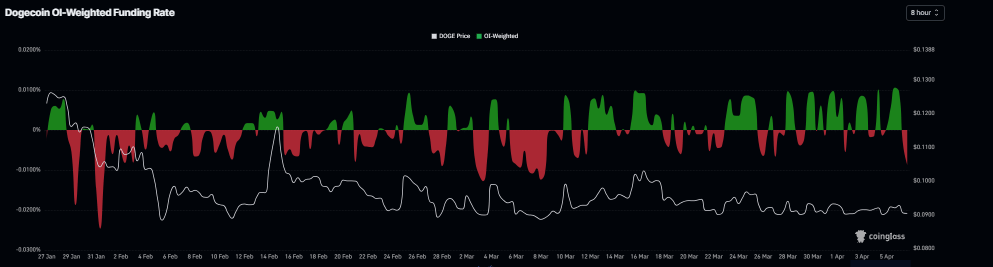
In addition, funding rate data also point to a bearish outlook for Dogecoin. The metric flipped to a negative rate on Monday, reading -0.0087% on Tuesday, indicating shorts are paying longs and suggesting bearish sentiment toward DOGE.
Dogecoin Price Forecast: DOGE shows a slight bearish tilt
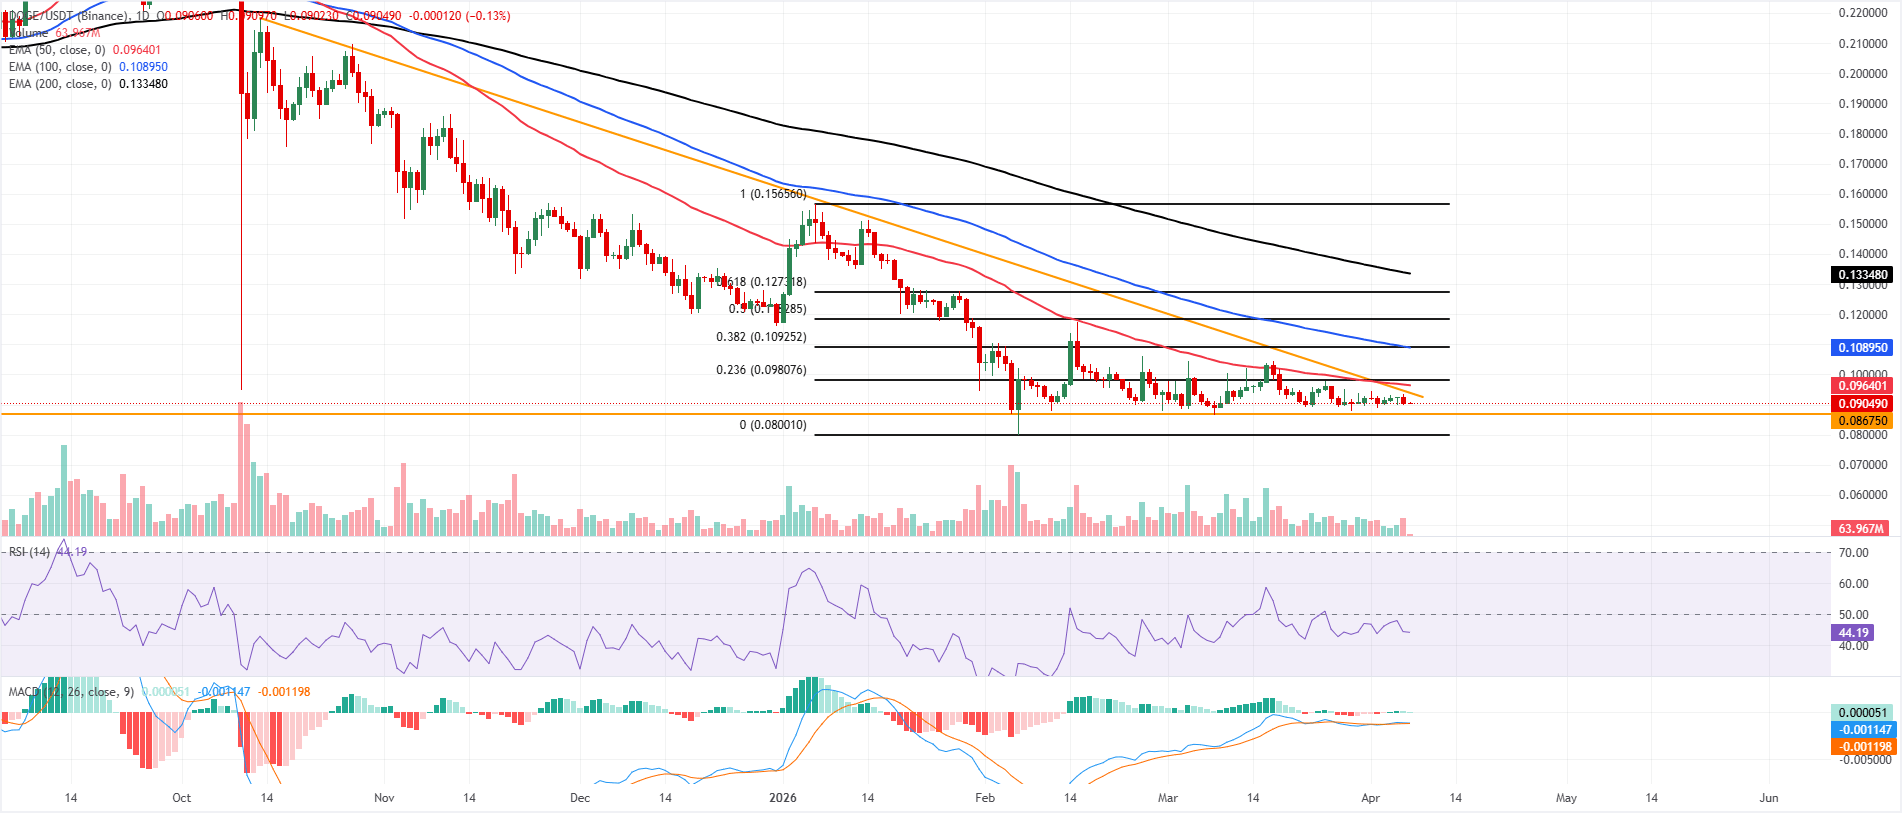
Dogecoin price is trading at $0.090 on Tuesday after falling nearly 2% the previous day. The near-term bias is neutral, with a slight bearish tilt, as price drifts below the 50-day Exponential Moving Average around $0.096 and remains capped well below the declining 100-day and 200-day EMAs near $0.110 and $0.130, respectively.
The downward trendline around $0.094 now acts as an overhead barrier, with momentum indicators lacking conviction: the Relative Strength Index (RSI) on the daily chart at 44 stays below the 50 midline, while the Moving Average Convergence Divergence (MACD) tracks flat just above zero, hinting at waning upside pressure rather than a clear reversal.
Immediate resistance is clustered at the trendline near $0.094, ahead of the 23.6% Fibonacci retracement from the $0.080 low to the $0.156 high at $0.098, where the 50-day average also converges to form a heavier cap. A sustained break above that zone would expose the 38.2% retracement at $0.109 and the 100-day average, reinforcing a broader recovery.
On the downside, initial support is seen at the recent lows around $0.089, followed by the horizontal line at $0.086; a close below there would open the way toward the $0.080 region and undermine any emerging basing pattern.
(The technical analysis of this story was written with the help of an AI tool.)

يعتمد أكثر من مليون مستخدم على FXStreet للحصول على بيانات سوقية لحظية، وأدوات رسوم بيانية، ورؤى خبراء، وأخبار الفوركس. يساعد تقويمهم الاقتصادي الشامل والندوات التعليمية عبر الويب المتداولين على البقاء على اطلاع واتخاذ قرارات محسوبة. لدى FXStreet فريق يضم حوالي 60 محترفًا موزعين بين مقر برشلونة ومناطق عالمية مختلفة.
اقرأ المزيد


