
Dogecoin Price Forecast: DOGE rebounds as whale wallets buy recent dips
بواسطة Manish Chhetri
تم التحديث: 22 May 2026


المقالات الشائعة

Dogecoin (DOGE) extends its rebound, trading above $0.105 on Friday after finding support around key support zones earlier this week. On-chain data shows that certain whale wallets have accumulated DOGE tokens during the recent price correction.
- Dogecoin price extends its recovery on Friday after finding support around key levels earlier this week.
- Santiment data shows that certain whale wallets bought DOGE during recent price dips.
- Traders should be cautious as mixed sentiment among derivatives markets keeps a lid on the rebound.
Dogecoin (DOGE) extends its rebound, trading above $0.105 on Friday after finding support around key support zones earlier this week. On-chain data shows that certain whale wallets have accumulated DOGE tokens during the recent price correction. Despite this recent recovery, traders should be cautious, as derivatives metrics indicate mixed sentiment, capping the meme coin’s comeback.
Whale buys price dips
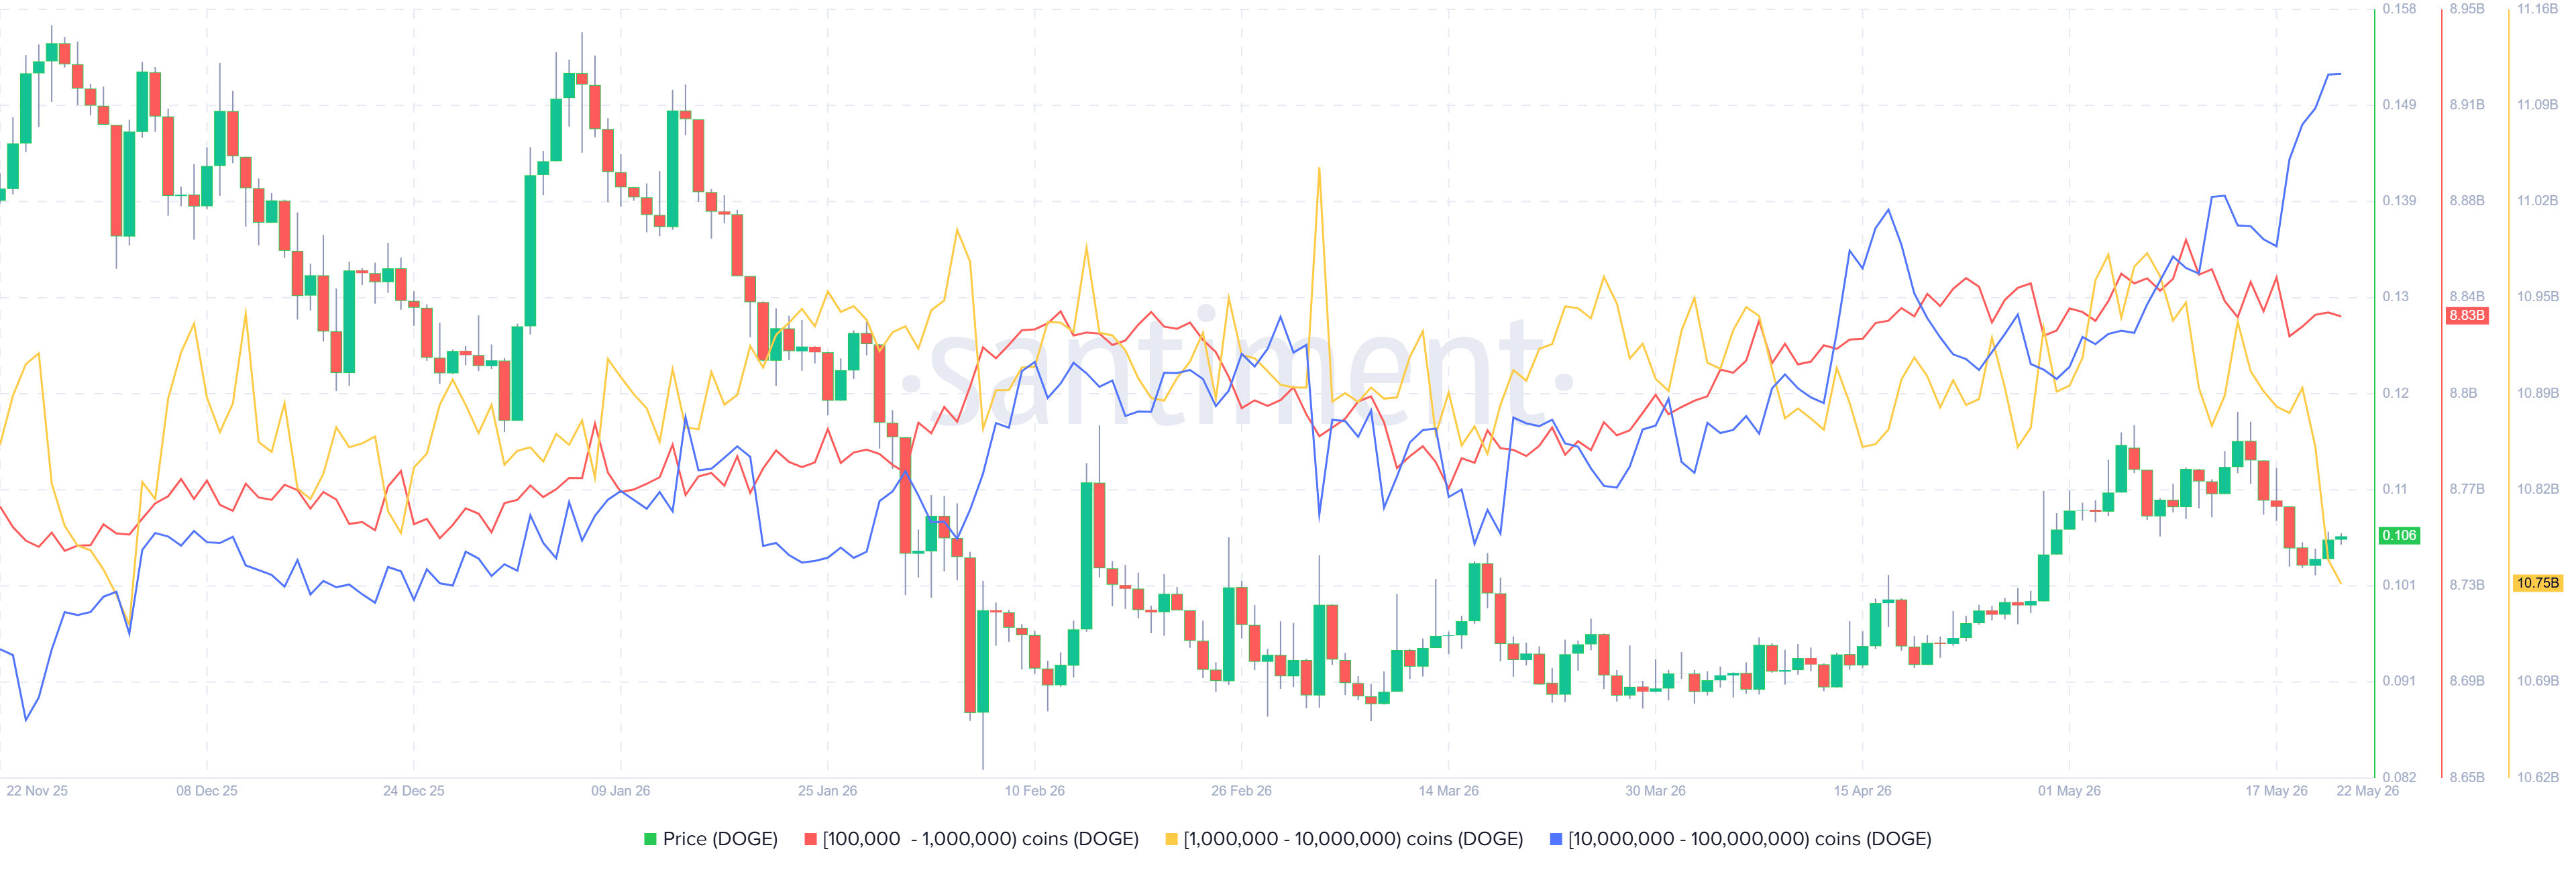
Santiment’s Supply Distribution data shows that large-wallet holders (whales) are buying DOGE during its recent price dips, a move that supports the positive outlook for the token.
The metric indicates that whales holding between 10 million and 100 million DOGE tokens (blue line) have accumulated a total of 500 million tokens since May 17. During the same period, whales holding 100,000 and 1 million tokens (red line) and holdings between 1 million and 10 million tokens (yellow line) have shed a total of 330 million tokens.
This shows that the second cohort of whales could have fallen prey to the capitulation event. In contrast, the first set of wallets seized the opportunity and accumulated DOGE at a discount.
In addition, this buy-the-dip scenario signals continued long-term interest among large-wallet holders, which could act as a cushion.
Mixed derivatives metrics cap DOGE’s recovery
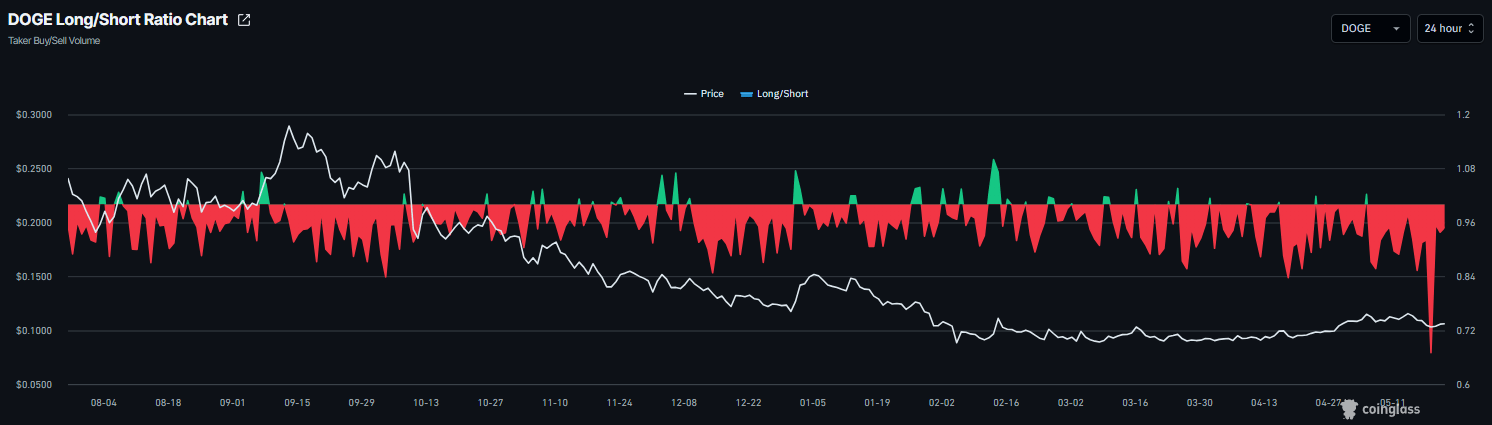
Despite whales accumulating the recent dips, the derivatives metrics show mixed sentiment. CoinGlass’ long-to-short ratio for DOGE reads 0.94 on Friday, nearing the lowest level over a month. This ratio, being below one, reflects bearish sentiment in the market, as more traders are betting on the asset’s price to fall.
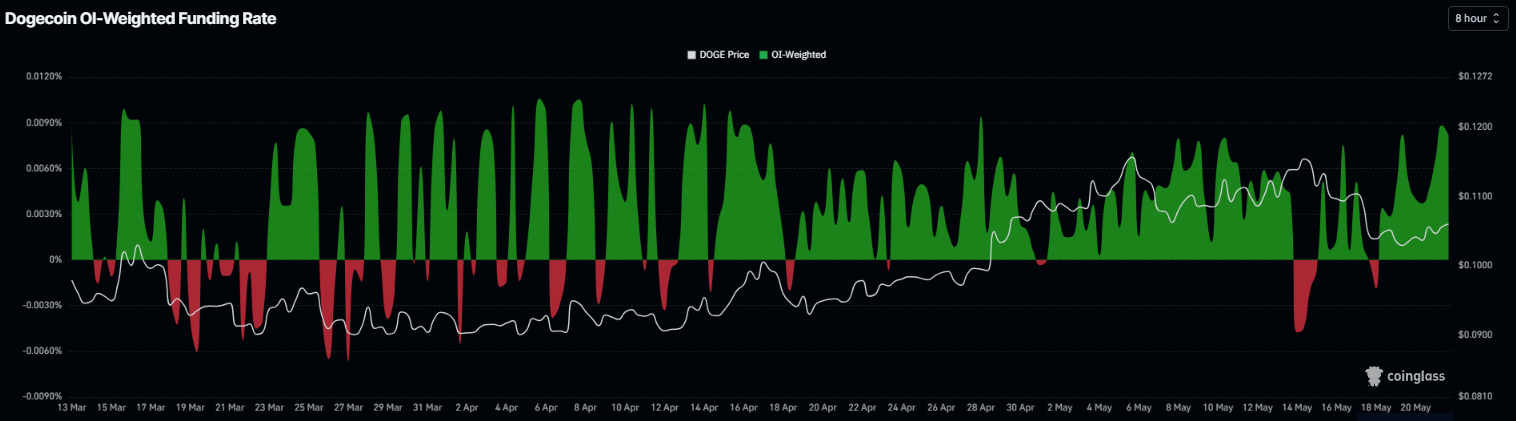
However, the funding rates data for meme coin support improving sentiment. CoinGlass’ OI-Weighted Funding Rate data for DOGE flipped positive on Monday, reading 0.0082% on Friday. This positive rate indicates that longs are paying shorts and projecting a bullish sentiment.
The above-mentioned combination suggests indecision among Dogecoin traders, capping its upside potential.
Dogecoin Price Forecast: DOGE holds strong at key support
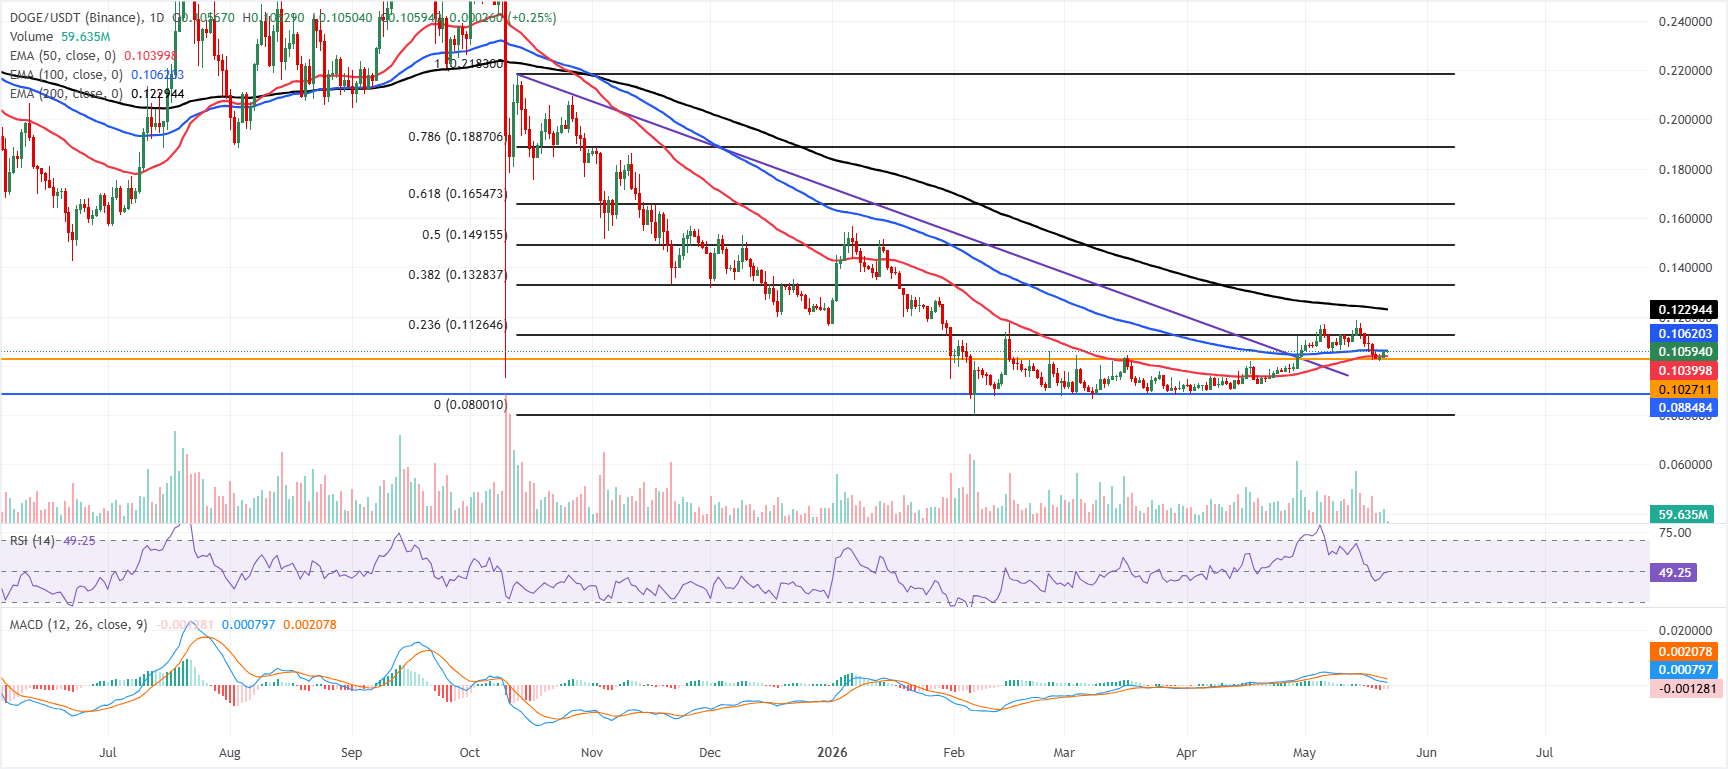
Dogecoin price trades at $0.105 on Friday, holding a neutral-to-bearish tone as it fluctuates between nearby Exponential Moving Averages (EMAs).
The meme coin remains above the 50-day EMA at $0.104, which offers initial dynamic support, but it is capped just overhead by the 100-day EMA at $0.106 and well below the 200-day EMA at $0.122, keeping the broader structure under pressure.
The Relative Strength Index (RSI) sits near 49, reflecting directionless momentum. At the same time, the Moving Average Convergence Divergence (MACD) remains marginally negative, suggesting tentative buying interest as the pair trades beneath the higher EMAs and the overarching descending trendline resistance.
On the topside, immediate resistance is seen at the 100-day EMA at $0.106, with a break higher exposing the 23.6% Fibonacci retracement of the broader downswing at $0.112, followed by the 200-day EMA near $0.122 and higher Fibonacci levels that align with the prevailing downward trendline.
On the downside, the 50-day EMA at $0.104 is the first support to watch, ahead of horizontal demand around $0.102; a daily close below this area would open the door toward the more distant floor at $0.0885, where previous buying interest emerged.
(The technical analysis of this story was written with the help of an AI tool.)

يعتمد أكثر من مليون مستخدم على FXStreet للحصول على بيانات سوقية لحظية، وأدوات رسوم بيانية، ورؤى خبراء، وأخبار الفوركس. يساعد تقويمهم الاقتصادي الشامل والندوات التعليمية عبر الويب المتداولين على البقاء على اطلاع واتخاذ قرارات محسوبة. لدى FXStreet فريق يضم حوالي 60 محترفًا موزعين بين مقر برشلونة ومناطق عالمية مختلفة.
اقرأ المزيد


