
Dogecoin Price Forecast: DOGE risks a steeper decline, discounting ETF inflow
بواسطة Vishal Dixit
تم التحديث: 18 Jun 2026


المقالات الشائعة

Dogecoin (DOGE) is trading in the red below $0.08500 for the fourth straight day as broader market interest shifts toward real-world utility tokens. The meme coin is losing retail strength despite a mild institutional inflow on Wednesday after 10 days of silence.
- Dogecoin slips below $0.0850 on Thursday, extending its decline for the fourth consecutive day.
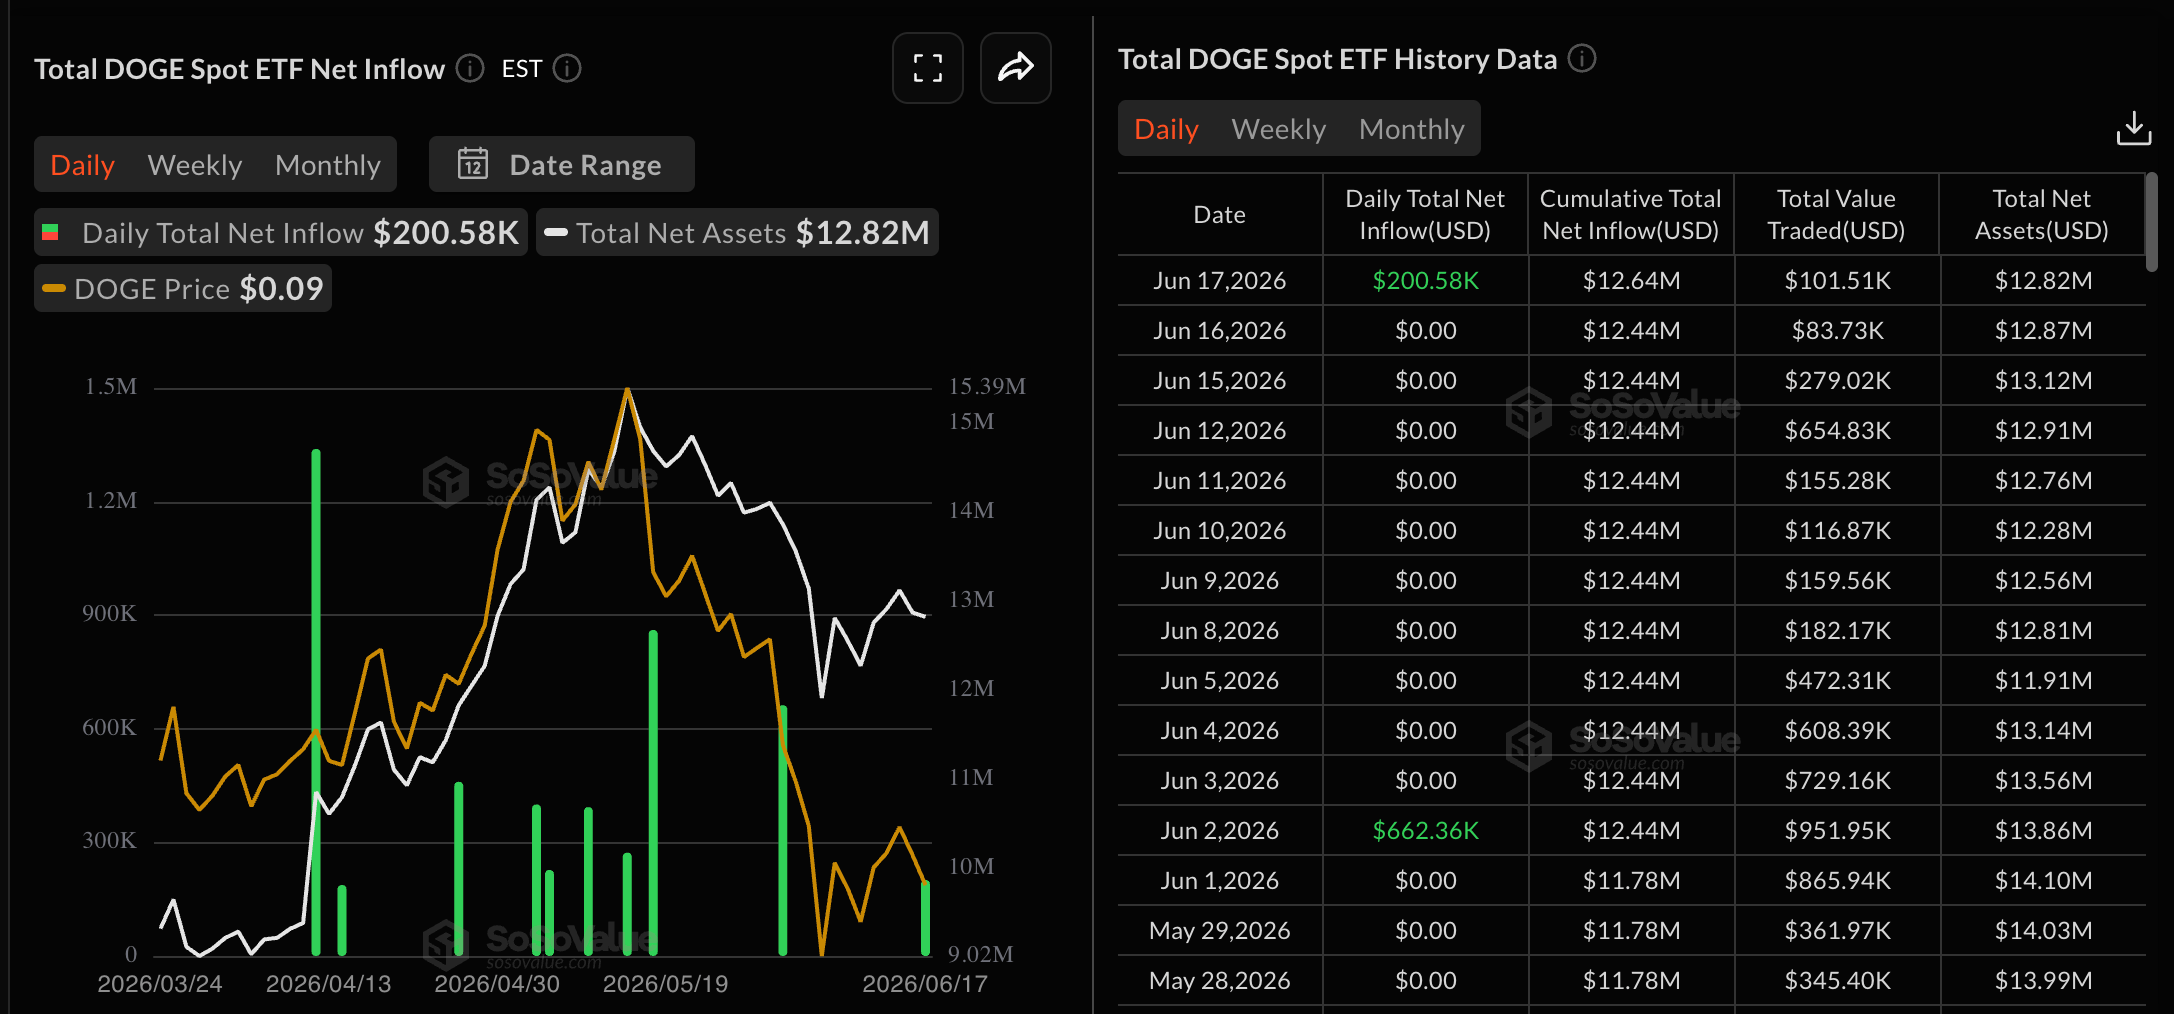
- DOGE ETFs recorded an inflow of about $200,000 on Wednesday, ending the streak of 10 zero-flow days.
- Retail demand weakens in the meme coin as Open Interest wanes and long liquidations rise.
Dogecoin (DOGE) is trading in the red below $0.08500 for the fourth straight day as broader market interest shifts toward real-world utility tokens. The meme coin is losing retail strength despite a mild institutional inflow on Wednesday after 10 days of silence. The technical outlook indicates DOGE is on a bearish slope with further downside potential, likely toward the June 6 low of $0.07766.
Retail interest discounts occasional ETF inflows
Dogecoin is losing its retail strength, a crucial bullish factor for the meme coin, as general crypto investor interest matures toward tokenization, privacy, and AI-themed tokens. CoinGlass data shows that DOGE Open Interest (OI) is down 7% over the last 24 hours to $1.10 billion, suggesting risk-off sentiment amid a decline in active positions.
Corroborating the risk-averse situation, liquidation data shows $4.81 million in long liquidations outpaces $577,030 in short liquidations. This bullish-biased wipeout could continue as the funding rate remains positive at 0.0056%, indicating that traders continue to prefer buying long in the hope of a turnaround.
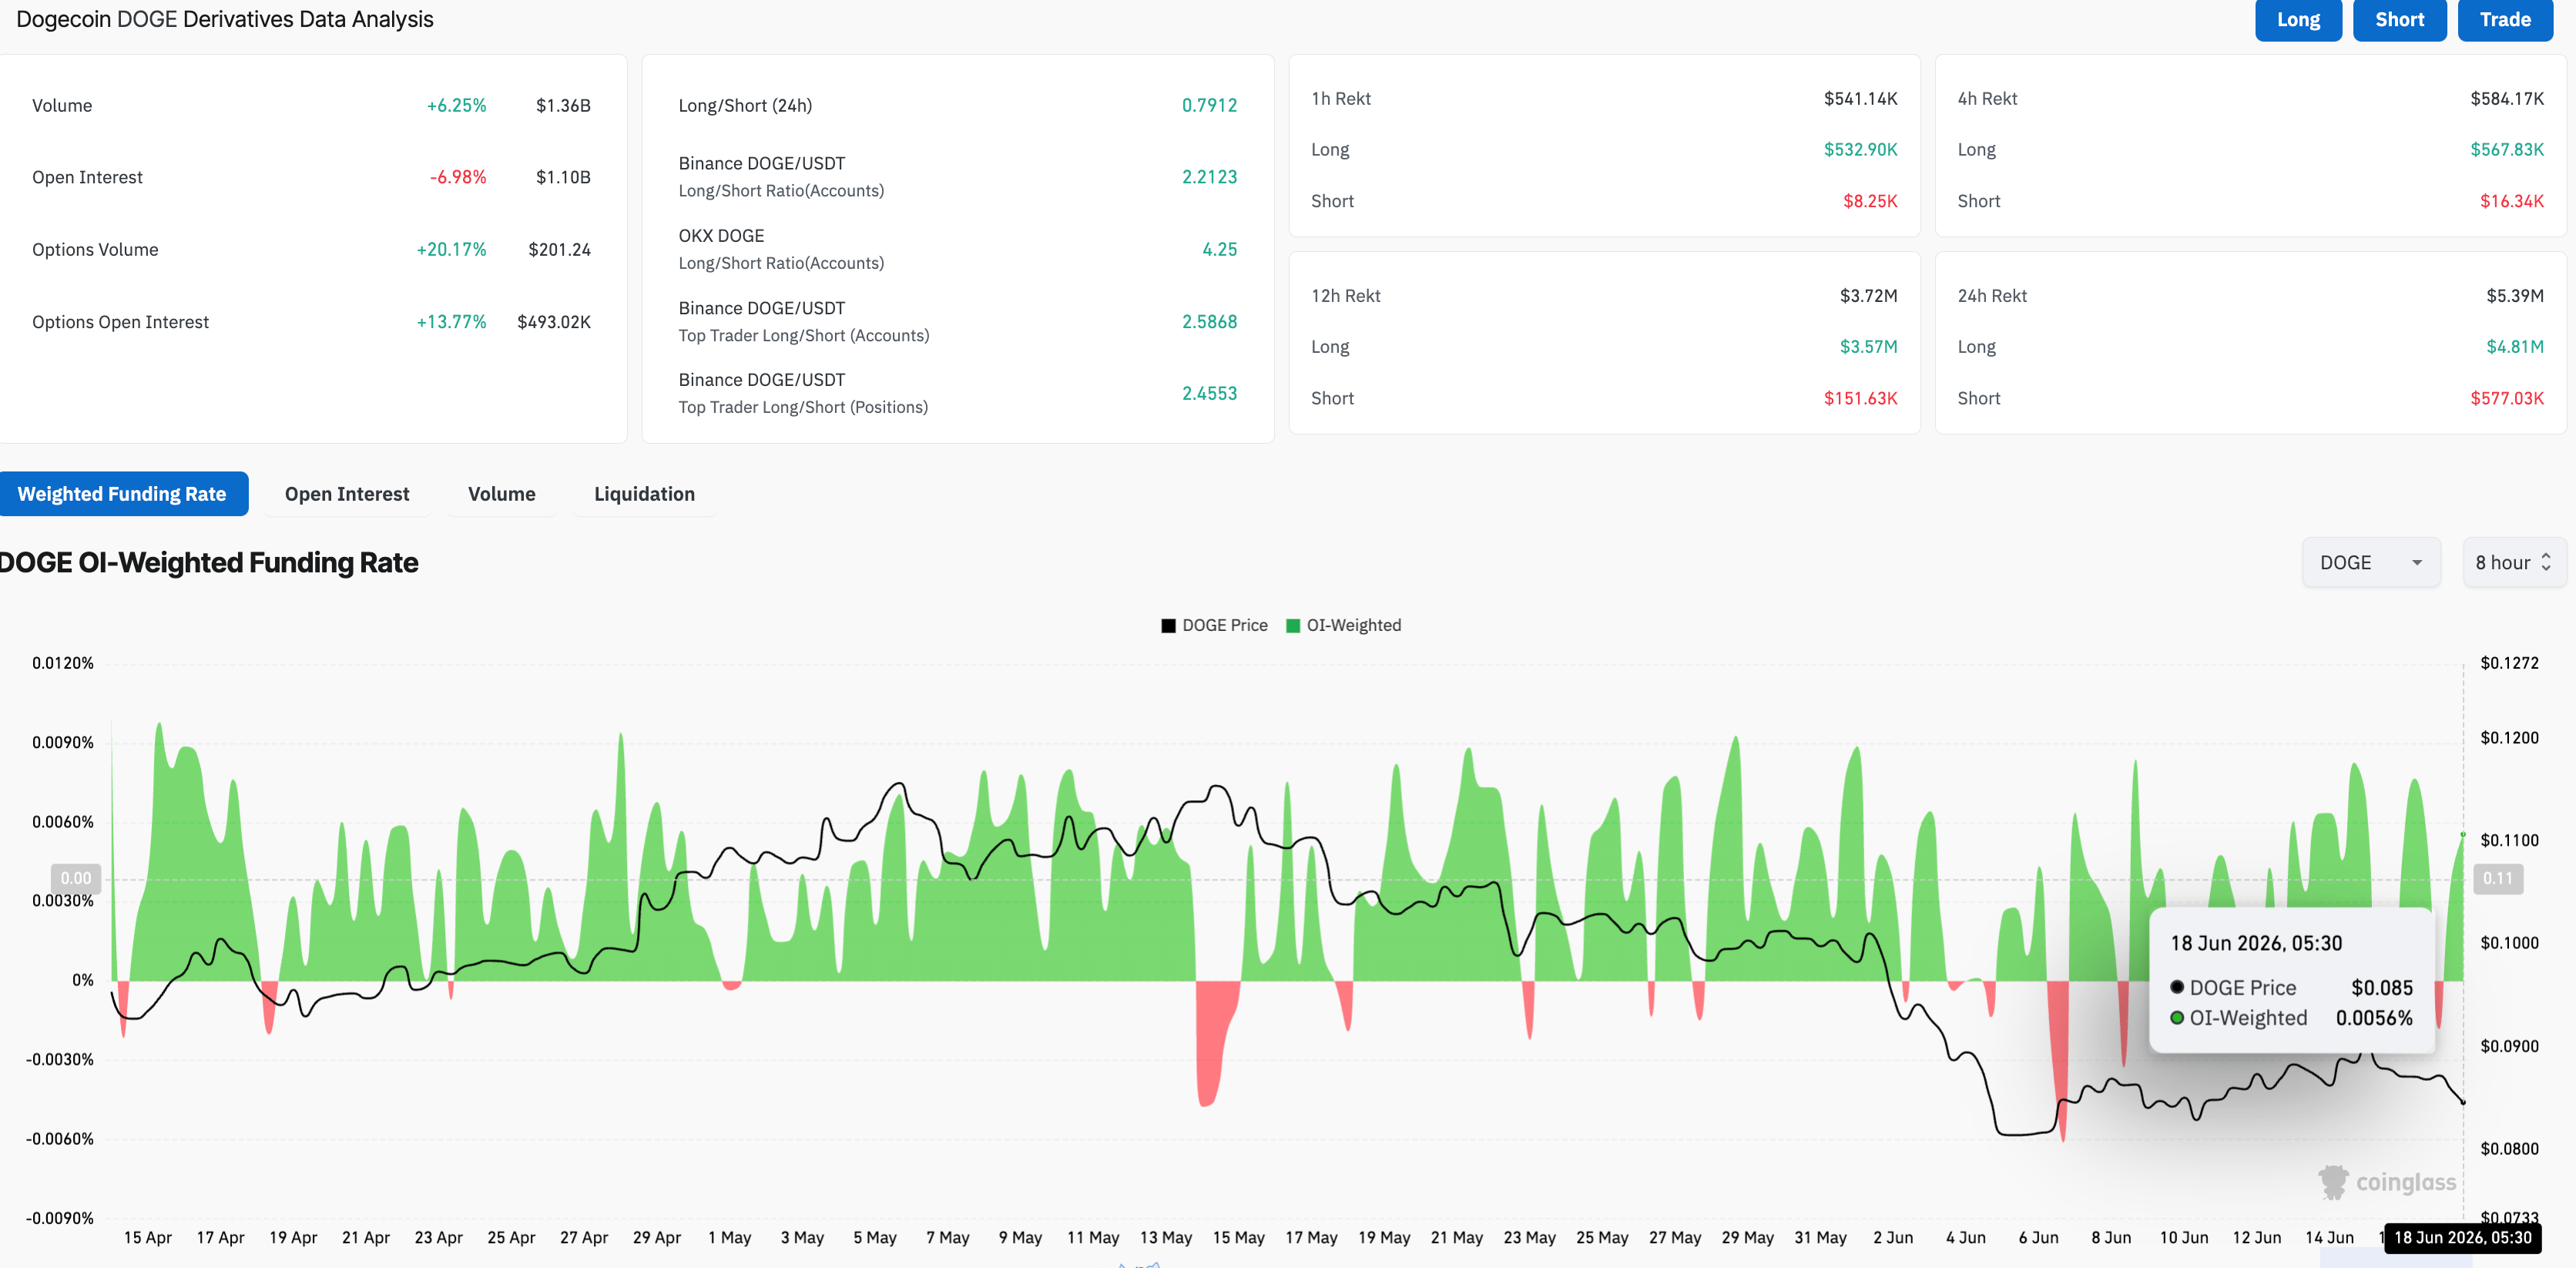
A key reason fueling this hope among investors is the mild inflow of $200,580 recorded by DOGE-focused Exchange Traded Funds (ETFs). However, the inconsistency in inflows after 10 days of zero flows keeps the impact on retail sentiment to a minimum.
Could Dogecoin extend a lower leg?
Dogecoin trades below $0.0850 at press time on Thursday, well below the 50-, 100-, and 200-day Exponential Moving Averages (EMAs), maintaining a bearish near-term tone. The consecutive days of losses reflect a quick bearish turnaround from the $0.0900 round figure, as sellers regained control.
The 14-day Relative Strength Index (RSI) sits near 35 on the daily chart, hinting at weak demand but not yet a clear oversold extreme, while the Moving Average Convergence Divergence (MACD) sits close to its signal line, suggesting only a modest loss of downside momentum within a still-capped structure.
Looking down, the immediate support aligns with the February 6 low of $0.07766, guarding the downside to the $0.0700 round figure followed by the $0.0641 level.
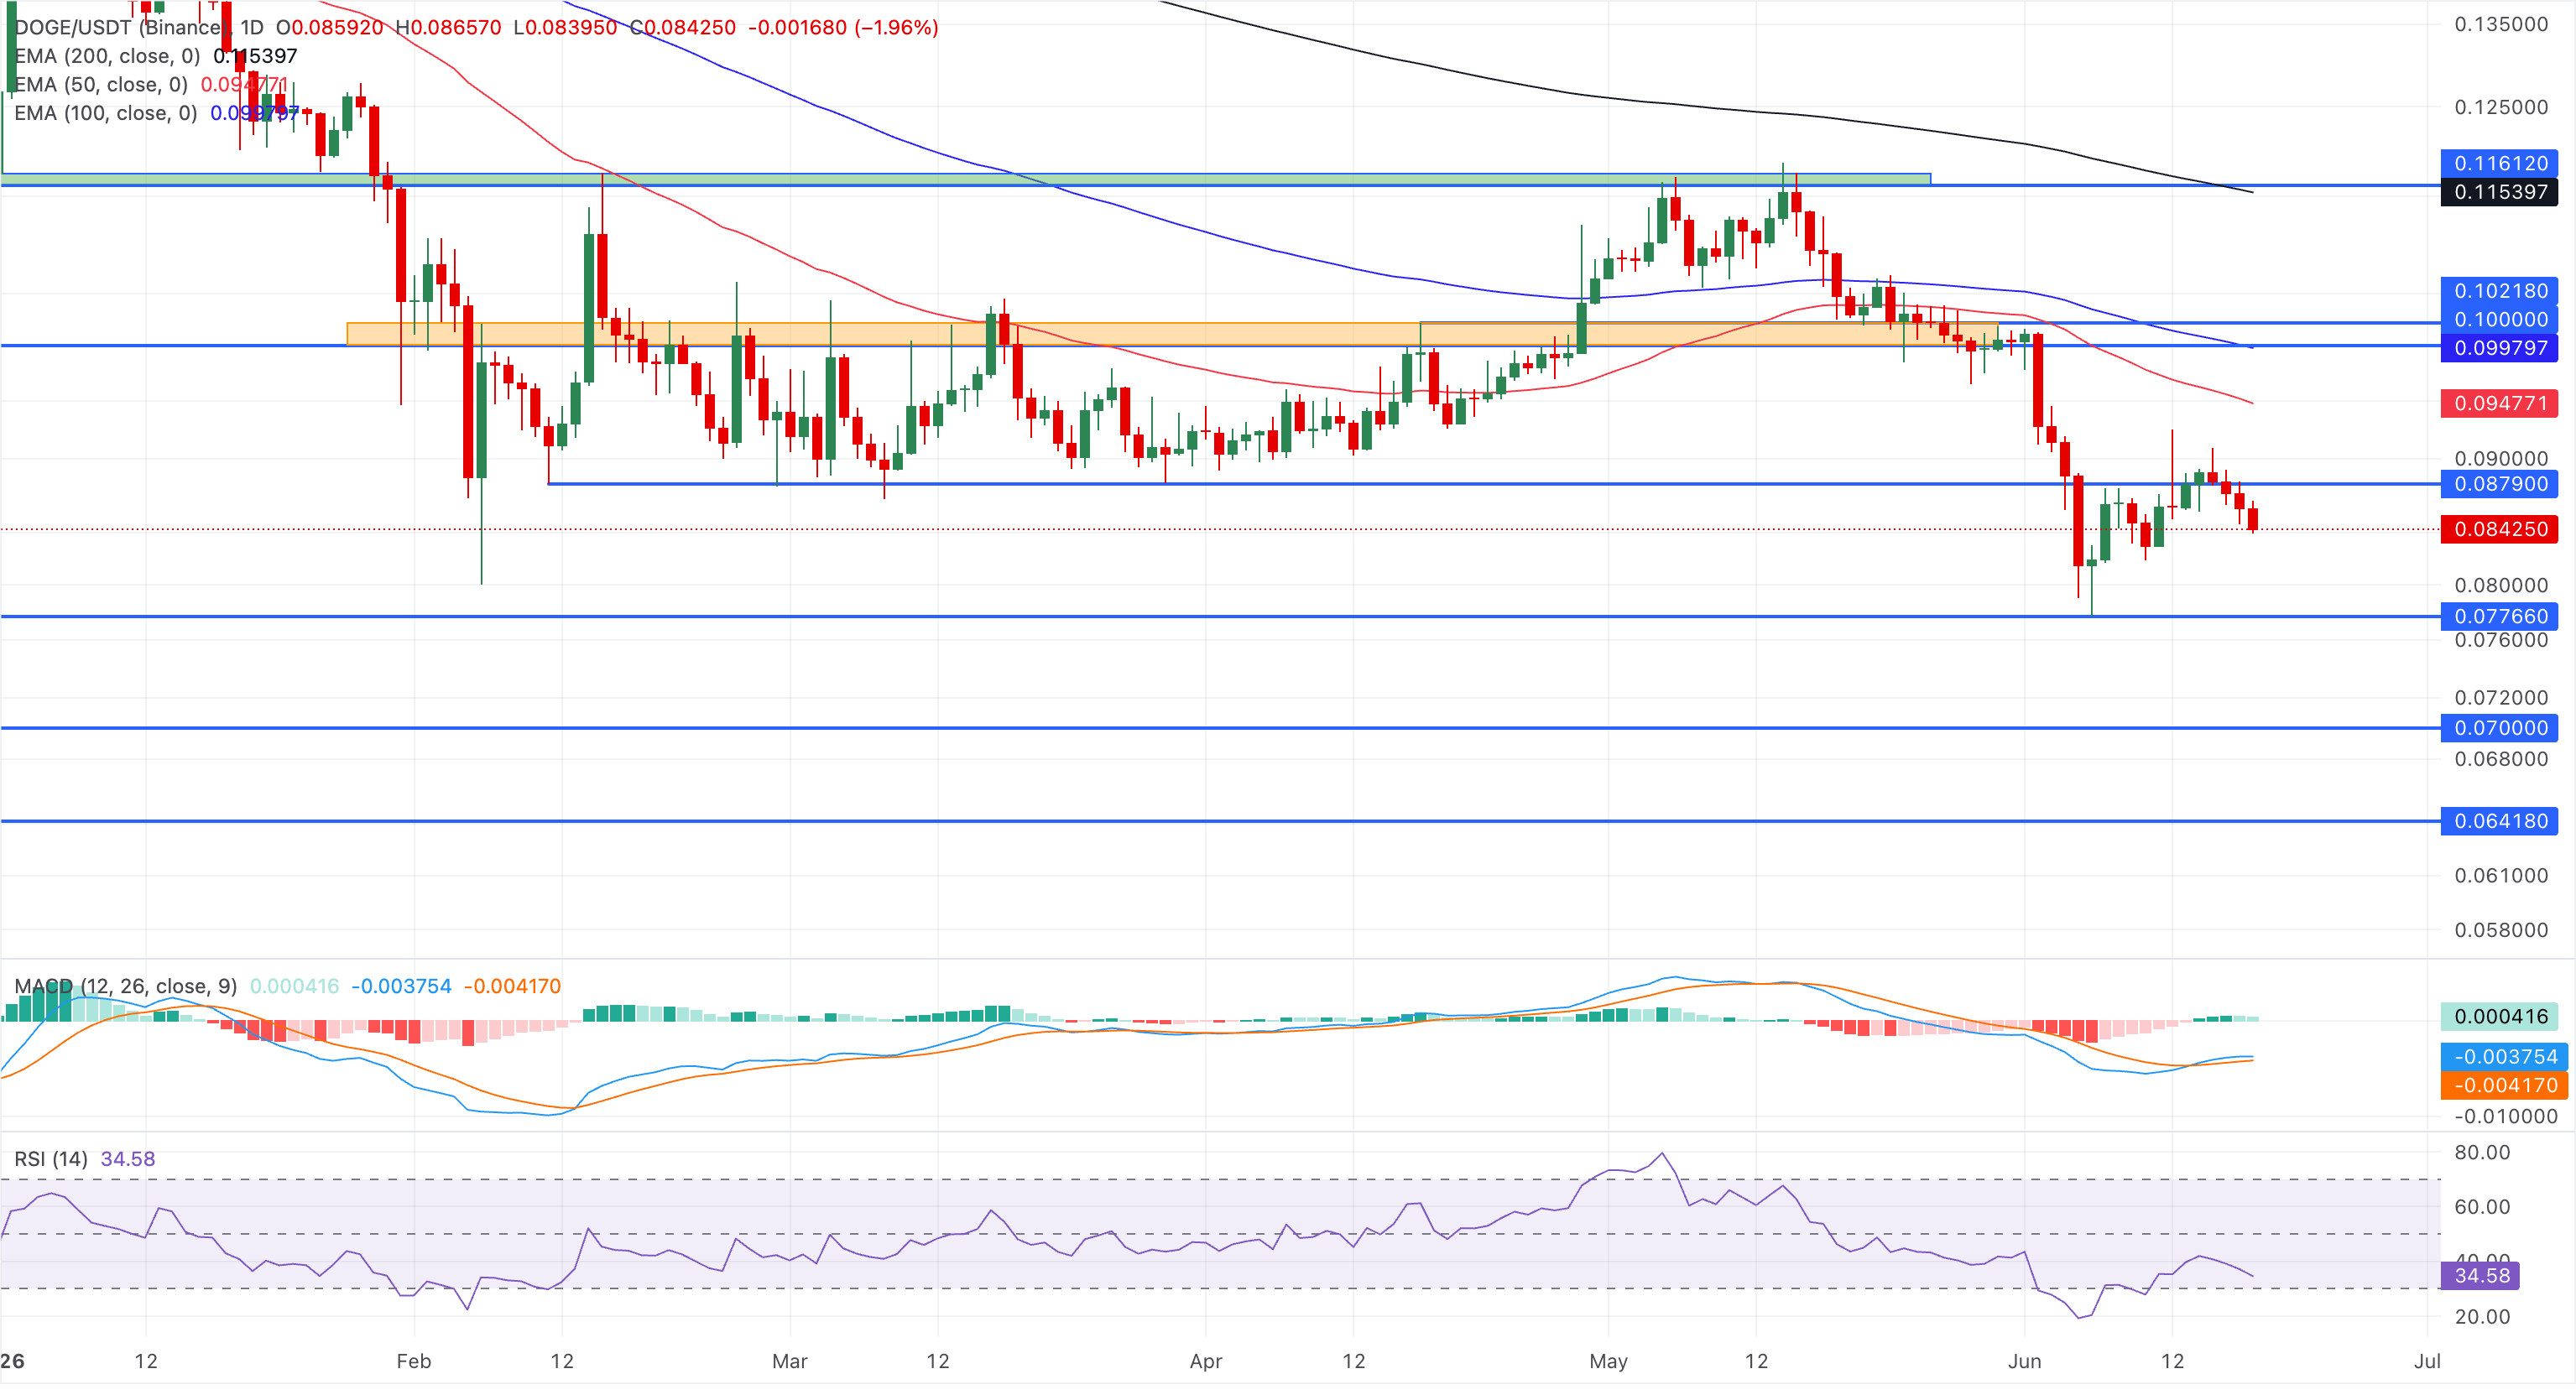
On the topside, initial resistance is seen at the $0.0900 level, followed by the 50-day EMA at roughly $0.094 and the 100-day EMA at roughly $0.0997, reinforcing the broader bearish cap.
(The technical analysis of this story was written with the help of an AI tool.)

يعتمد أكثر من مليون مستخدم على FXStreet للحصول على بيانات سوقية لحظية، وأدوات رسوم بيانية، ورؤى خبراء، وأخبار الفوركس. يساعد تقويمهم الاقتصادي الشامل والندوات التعليمية عبر الويب المتداولين على البقاء على اطلاع واتخاذ قرارات محسوبة. لدى FXStreet فريق يضم حوالي 60 محترفًا موزعين بين مقر برشلونة ومناطق عالمية مختلفة.
اقرأ المزيد


