

Dow Jones Industrial Average buys the Iran deal Trump described, not the one being negotiated
- The Dow tagged a fresh record near 51,050 on Friday as Trump teased imminent sign-off on the Iran framework.
- The terms Trump laid out in his Truth Social post differ sharply from what Iranian state media say is in the MOU.
- Iran's state TV this morning reiterated it still controls Hormuz transit, contradicting Trump's "unrestricted" framing.
The Dow Jones Industrial Average (DJIA) punched out a fresh intraday record near 51,050 with the bid traceable to a Truth Social post in which President Donald Trump declared he would be in the Situation Room making a "final determination" on the US-Iran agreement and laid out terms that sounded suspiciously like a finished deal. The catch, and it is becoming a daily ritual, is that the terms Trump described are not the terms Iran has agreed to. Markets have decided to trust the salesman over the contract.

Two deals, one headline
Read Trump's post and you get a clean, victorious framework: Iran "must agree" never to have a nuclear weapon, the Strait of Hormuz "must be immediately open, no tolls, for unrestricted shipping traffic, in both directions," any remaining mines will be "terminated," the US naval blockade "will now be lifted," and roughly 900 pounds of highly-enriched uranium will be "DESTROYED." Read the actual draft memorandum of understanding (MOU) as reported through US officials and you get something far softer: a 60-day extension of the ceasefire, a synchronized and gradual reopening of Hormuz over that window, the blockade rolled back in steps rather than scrapped in one go, and 60 days of negotiation about how to dispose of the uranium stockpile, not its immediate destruction. The former US ambassador to Israel even pointed out publicly that the deal Trump described in his post is not the deal on the table; the MOU simply opens the negotiating window.
Iranian state media is making the same point with less diplomacy. Outlets close to the Revolutionary Guard have called Trump's "fully reopened" framing inconsistent with the latest exchanged text, with one agency reporting the strait will not return to pre-war status under the agreement. This morning, Iran's state broadcaster doubled down: 24 ships had transited Hormuz over the prior 24 hours, but only with Iran's permission, only along "designated routes, at specified times, and under permits and conditions set by Iran." Vessels entering without authorization, the report warned, would face "a strong response." That is not "no tolls, unrestricted, both directions." That is Tehran restating the status quo while Washington's president describes a status quo that does not exist. Iran's Supreme Leader, meanwhile, has not given final approval, and Israeli officials reportedly do not believe he has signed off on the MOU either.
The actions still don't match the words
For a ceasefire about to be formalized, the shooting is awfully active. Iran's Revolutionary Guard launched a ballistic missile at Kuwait late Wednesday, intercepted by air defenses, and the Islamic Revolutionary Guard Corps (IRGC) said Thursday it had struck the US airbase from which the Bandar Abbas strikes originated. The Treasury, on the same day the MOU was supposedly being finalized, threatened sanctions on Oman for any role in a Hormuz tolling scheme. Diplomatically, this is the stretch of a negotiation where small things blow up large; markets are pricing it as if both sides are already at the lectern with pens out.
The data the bid keeps ignoring
The macro backdrop is not doing the bulls any favors either. Yesterday's core Personal Consumption Expenditures Price Index (PCE) climbed to 3.3% YoY, a multi-year high, with headline at 3.8% YoY, and this morning the Chicago Purchasing Managers Index (PMI) exploded to 62.7 against a 50.6 consensus, a four-year high and the largest monthly jump since 2020. Hot manufacturing on top of sticky inflation is not a Federal Reserve (Fed) cutting profile; it is closer to a Fed staying on hold into late 2026 with some Federal Open Market Committee (FOMC) members still floating hikes. Equities are simultaneously pricing a peace dividend the negotiators have not signed and a dovish Fed that neither the data nor the policy guidance support. Both bets can be wrong at the same time.
Trading the breakout
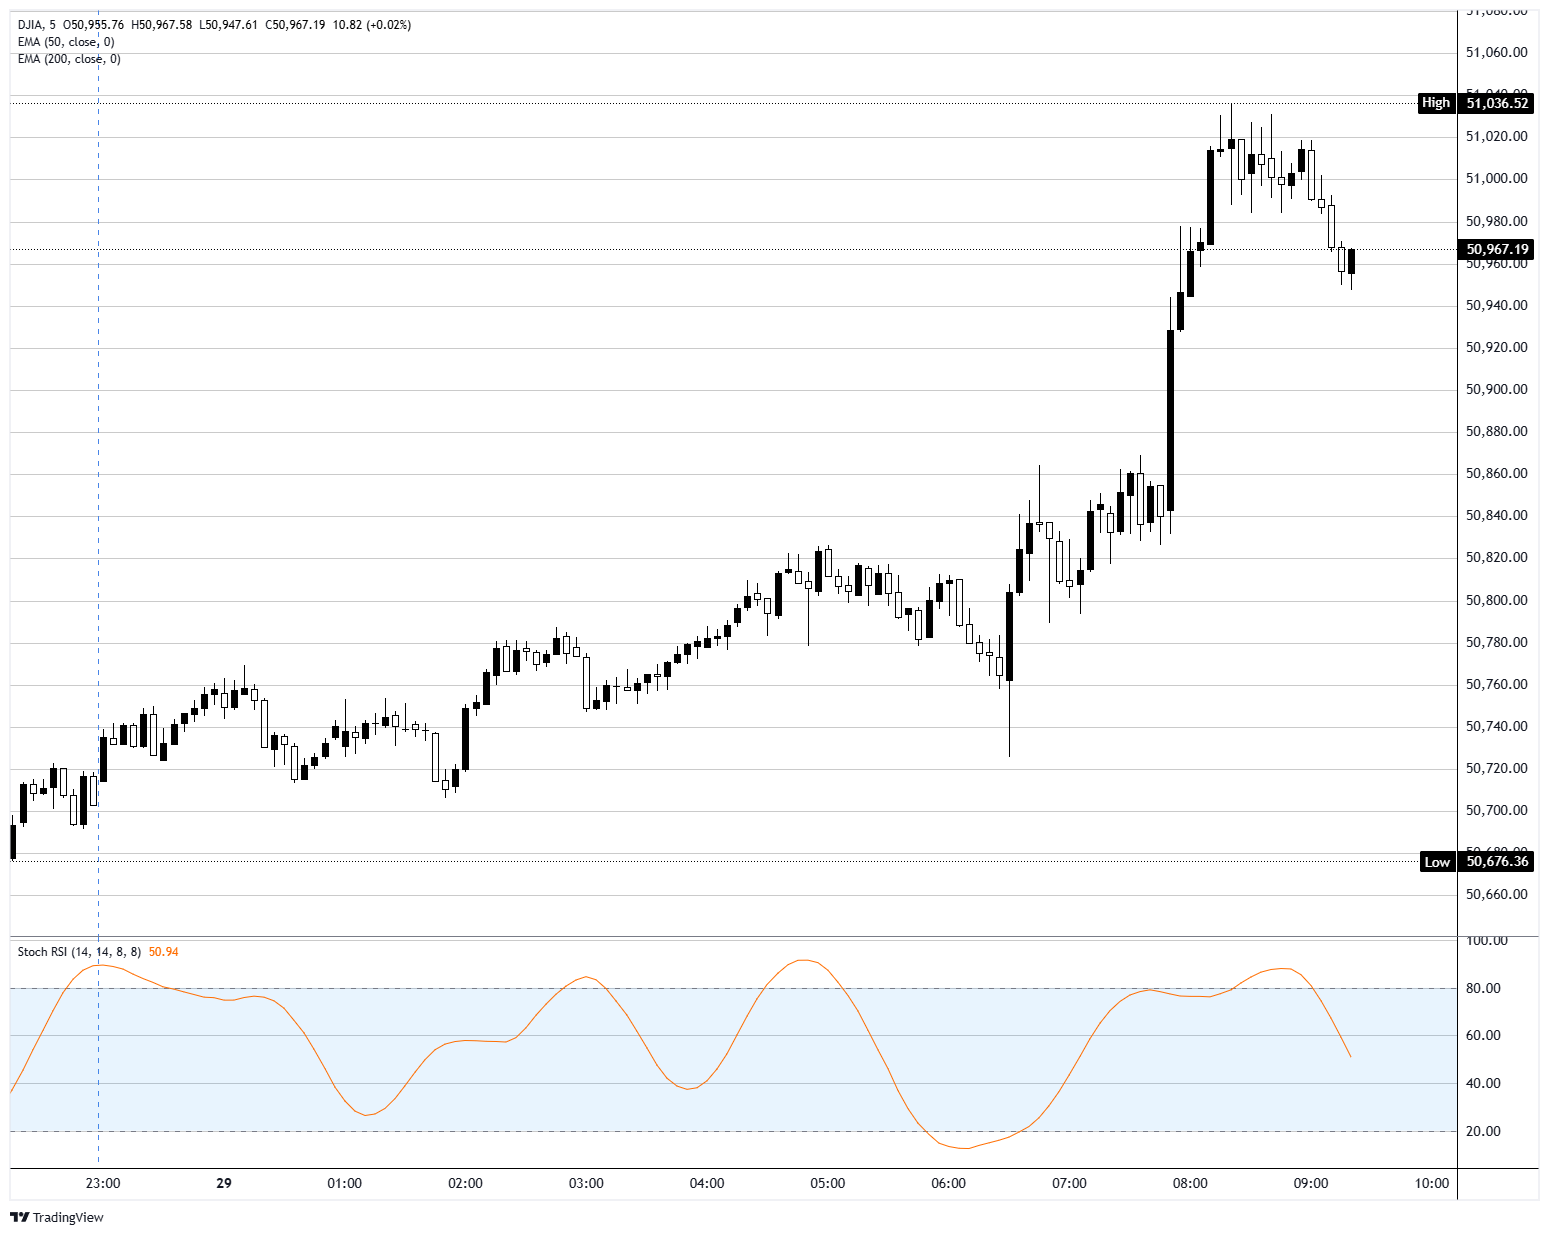
The trend remains up, and the technical picture is clean. The overnight push took out the 51,000 record zone called out as resistance yesterday, printed close to 51,050, then pulled straight back to test the breakout from above. That is textbook bull behavior so long as 51,000 holds; lose it and the breakout becomes a failure pattern. The daily 50-period Exponential Moving Average (EMA) sits near 49,250 and the 200 EMA close to 47,550, miles below, so the broader uptrend is in no danger. Momentum, though, is fading on the short timeframe: the 5-minute Stochastic Relative Strength Index (Stoch RSI) has rolled over from above 80 toward 60, signaling the rally is running on fumes after the overnight breakout.
The framework writes itself. First support is the 51,000 breakout retest; lose it and 50,500 (yesterday's defended level) becomes the magnet, with 50,000 the deeper psychological floor and the 50 EMA the trend line of last resort. Resistance above is open air toward the next round figure near 51,500. The catalyst risk is entirely political. A genuine Trump signature with Iranian ratification extends the breakout; Iranian state media surfacing a meaningful rejection, or a fresh missile incident, hands the tape back to the bears in a hurry. The calendar offers no cover, the rest of the day thins to a parade of Fed speakers (Schmid, Bowman, Paulson, Daly), none of them red-band. Lean with the trend, keep stops tight under 51,000, and treat every Truth Social notification as a potential market event, because right now that is exactly what they are.
Dow Jones 5-minute chart
Dow Jones FAQs
The Dow Jones Industrial Average, one of the oldest stock market indices in the world, is compiled of the 30 most traded stocks in the US. The index is price-weighted rather than weighted by capitalization. It is calculated by summing the prices of the constituent stocks and dividing them by a factor, currently 0.152. The index was founded by Charles Dow, who also founded the Wall Street Journal. In later years it has been criticized for not being broadly representative enough because it only tracks 30 conglomerates, unlike broader indices such as the S&P 500.
Many different factors drive the Dow Jones Industrial Average (DJIA). The aggregate performance of the component companies revealed in quarterly company earnings reports is the main one. US and global macroeconomic data also contributes as it impacts on investor sentiment. The level of interest rates, set by the Federal Reserve (Fed), also influences the DJIA as it affects the cost of credit, on which many corporations are heavily reliant. Therefore, inflation can be a major driver as well as other metrics which impact the Fed decisions.
Dow Theory is a method for identifying the primary trend of the stock market developed by Charles Dow. A key step is to compare the direction of the Dow Jones Industrial Average (DJIA) and the Dow Jones Transportation Average (DJTA) and only follow trends where both are moving in the same direction. Volume is a confirmatory criteria. The theory uses elements of peak and trough analysis. Dow’s theory posits three trend phases: accumulation, when smart money starts buying or selling; public participation, when the wider public joins in; and distribution, when the smart money exits.
There are a number of ways to trade the DJIA. One is to use ETFs which allow investors to trade the DJIA as a single security, rather than having to buy shares in all 30 constituent companies. A leading example is the SPDR Dow Jones Industrial Average ETF (DIA). DJIA futures contracts enable traders to speculate on the future value of the index and Options provide the right, but not the obligation, to buy or sell the index at a predetermined price in the future. Mutual funds enable investors to buy a share of a diversified portfolio of DJIA stocks thus providing exposure to the overall index.














