
Ethereum Price Forecast: Long-term holders' capitulation drives ETH below $1,800
Ethereum price today: $1,760
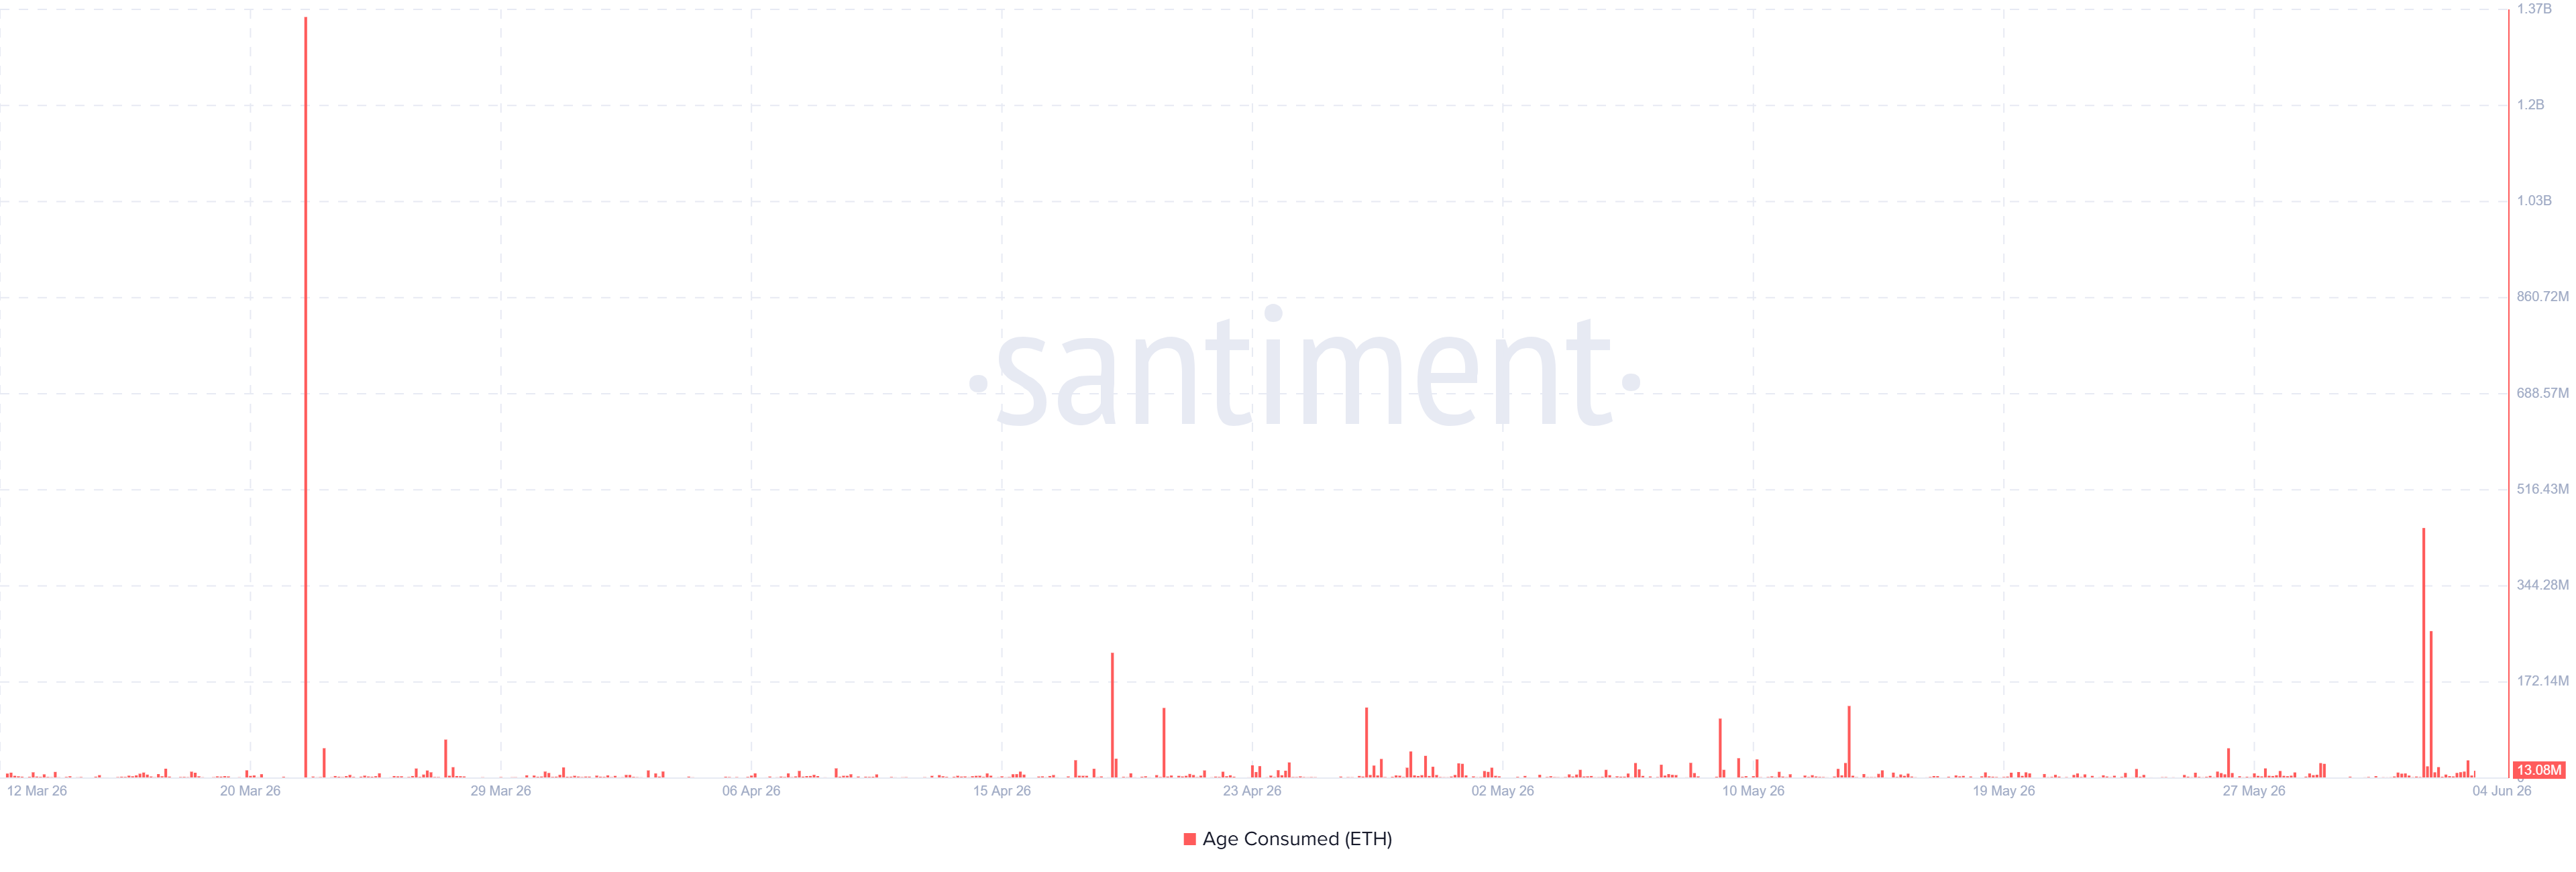
- Ethereum Age Consumed metric recorded notable spikes over the past two days, signaling increased selling from long-term holders.
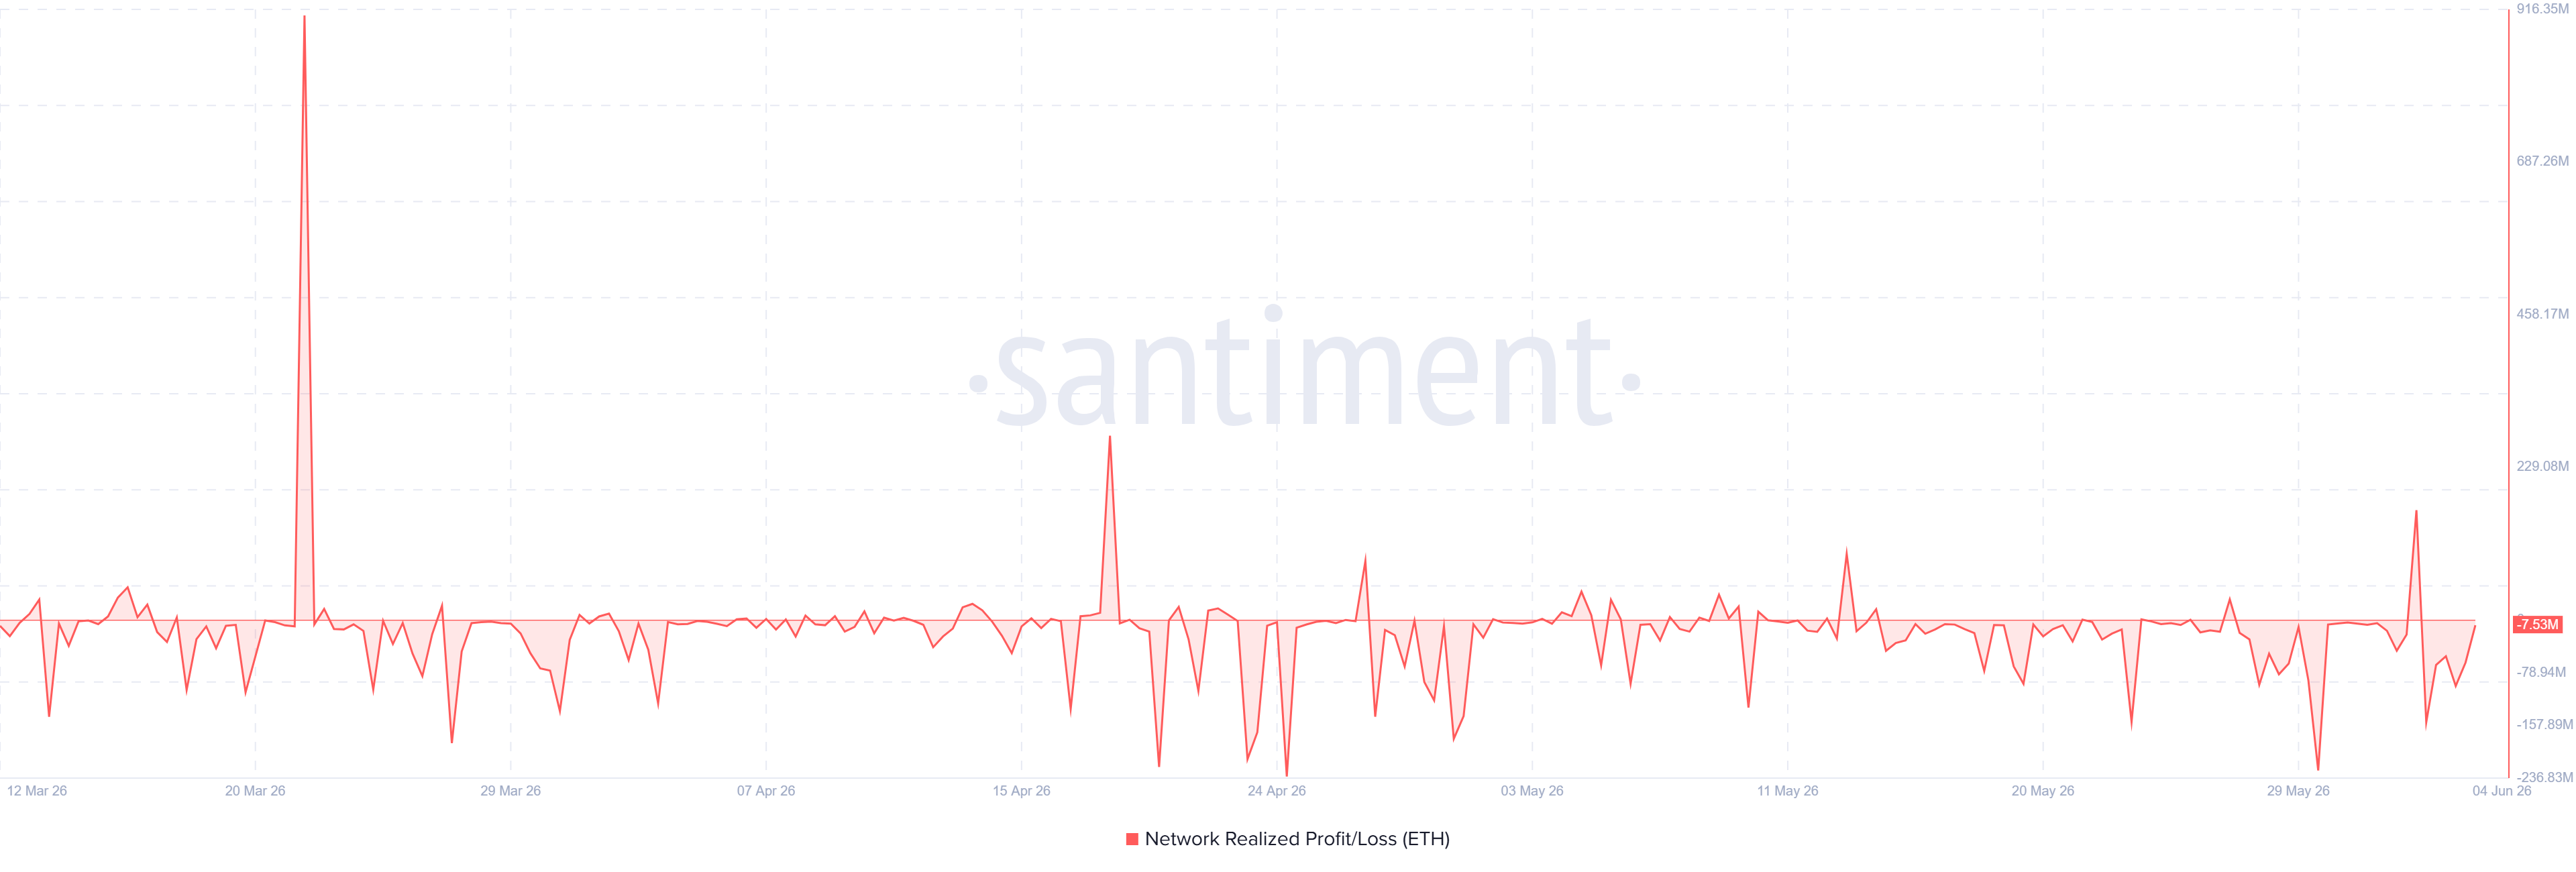
- Most of the selling is coming from underwater coins, driving an increase in realized losses.
- ETH could bounce off $1,740.
Ethereum (ETH) has fallen below $1,800 on Wednesday, the first time since May 2025 following accelerated spot selling pressure and distributions from long-term holders.
The Age Consumed metric, which tracks the movement of previously idle tokens or long-term holders' (LTHs) coins, spiked over the past two days as prices declined, indicating increased selling activity among this cohort. Historically, selling pressure accelerates when LTHs are distributing.

The majority of recent sales are coming from underwater coins, as evidenced by the realized profit/loss metric. Although moderate on a daily basis, realized losses have been consistent since April, indicating most distributions over the past few months have been driven by risk-off sentiment.
On the institutional side, US spot Ethereum exchange-traded funds (ETFs) have recorded sixteen consecutive days of net outflows, their longest negative streak since launching in July 2024, according to FarSide Investors data.
On the derivatives side, open interest continues to hover above 15 million ETH, even as funding rates remain positive despite a decline in ETH prices. The move indicates a derivatives market dominated by long positioning.
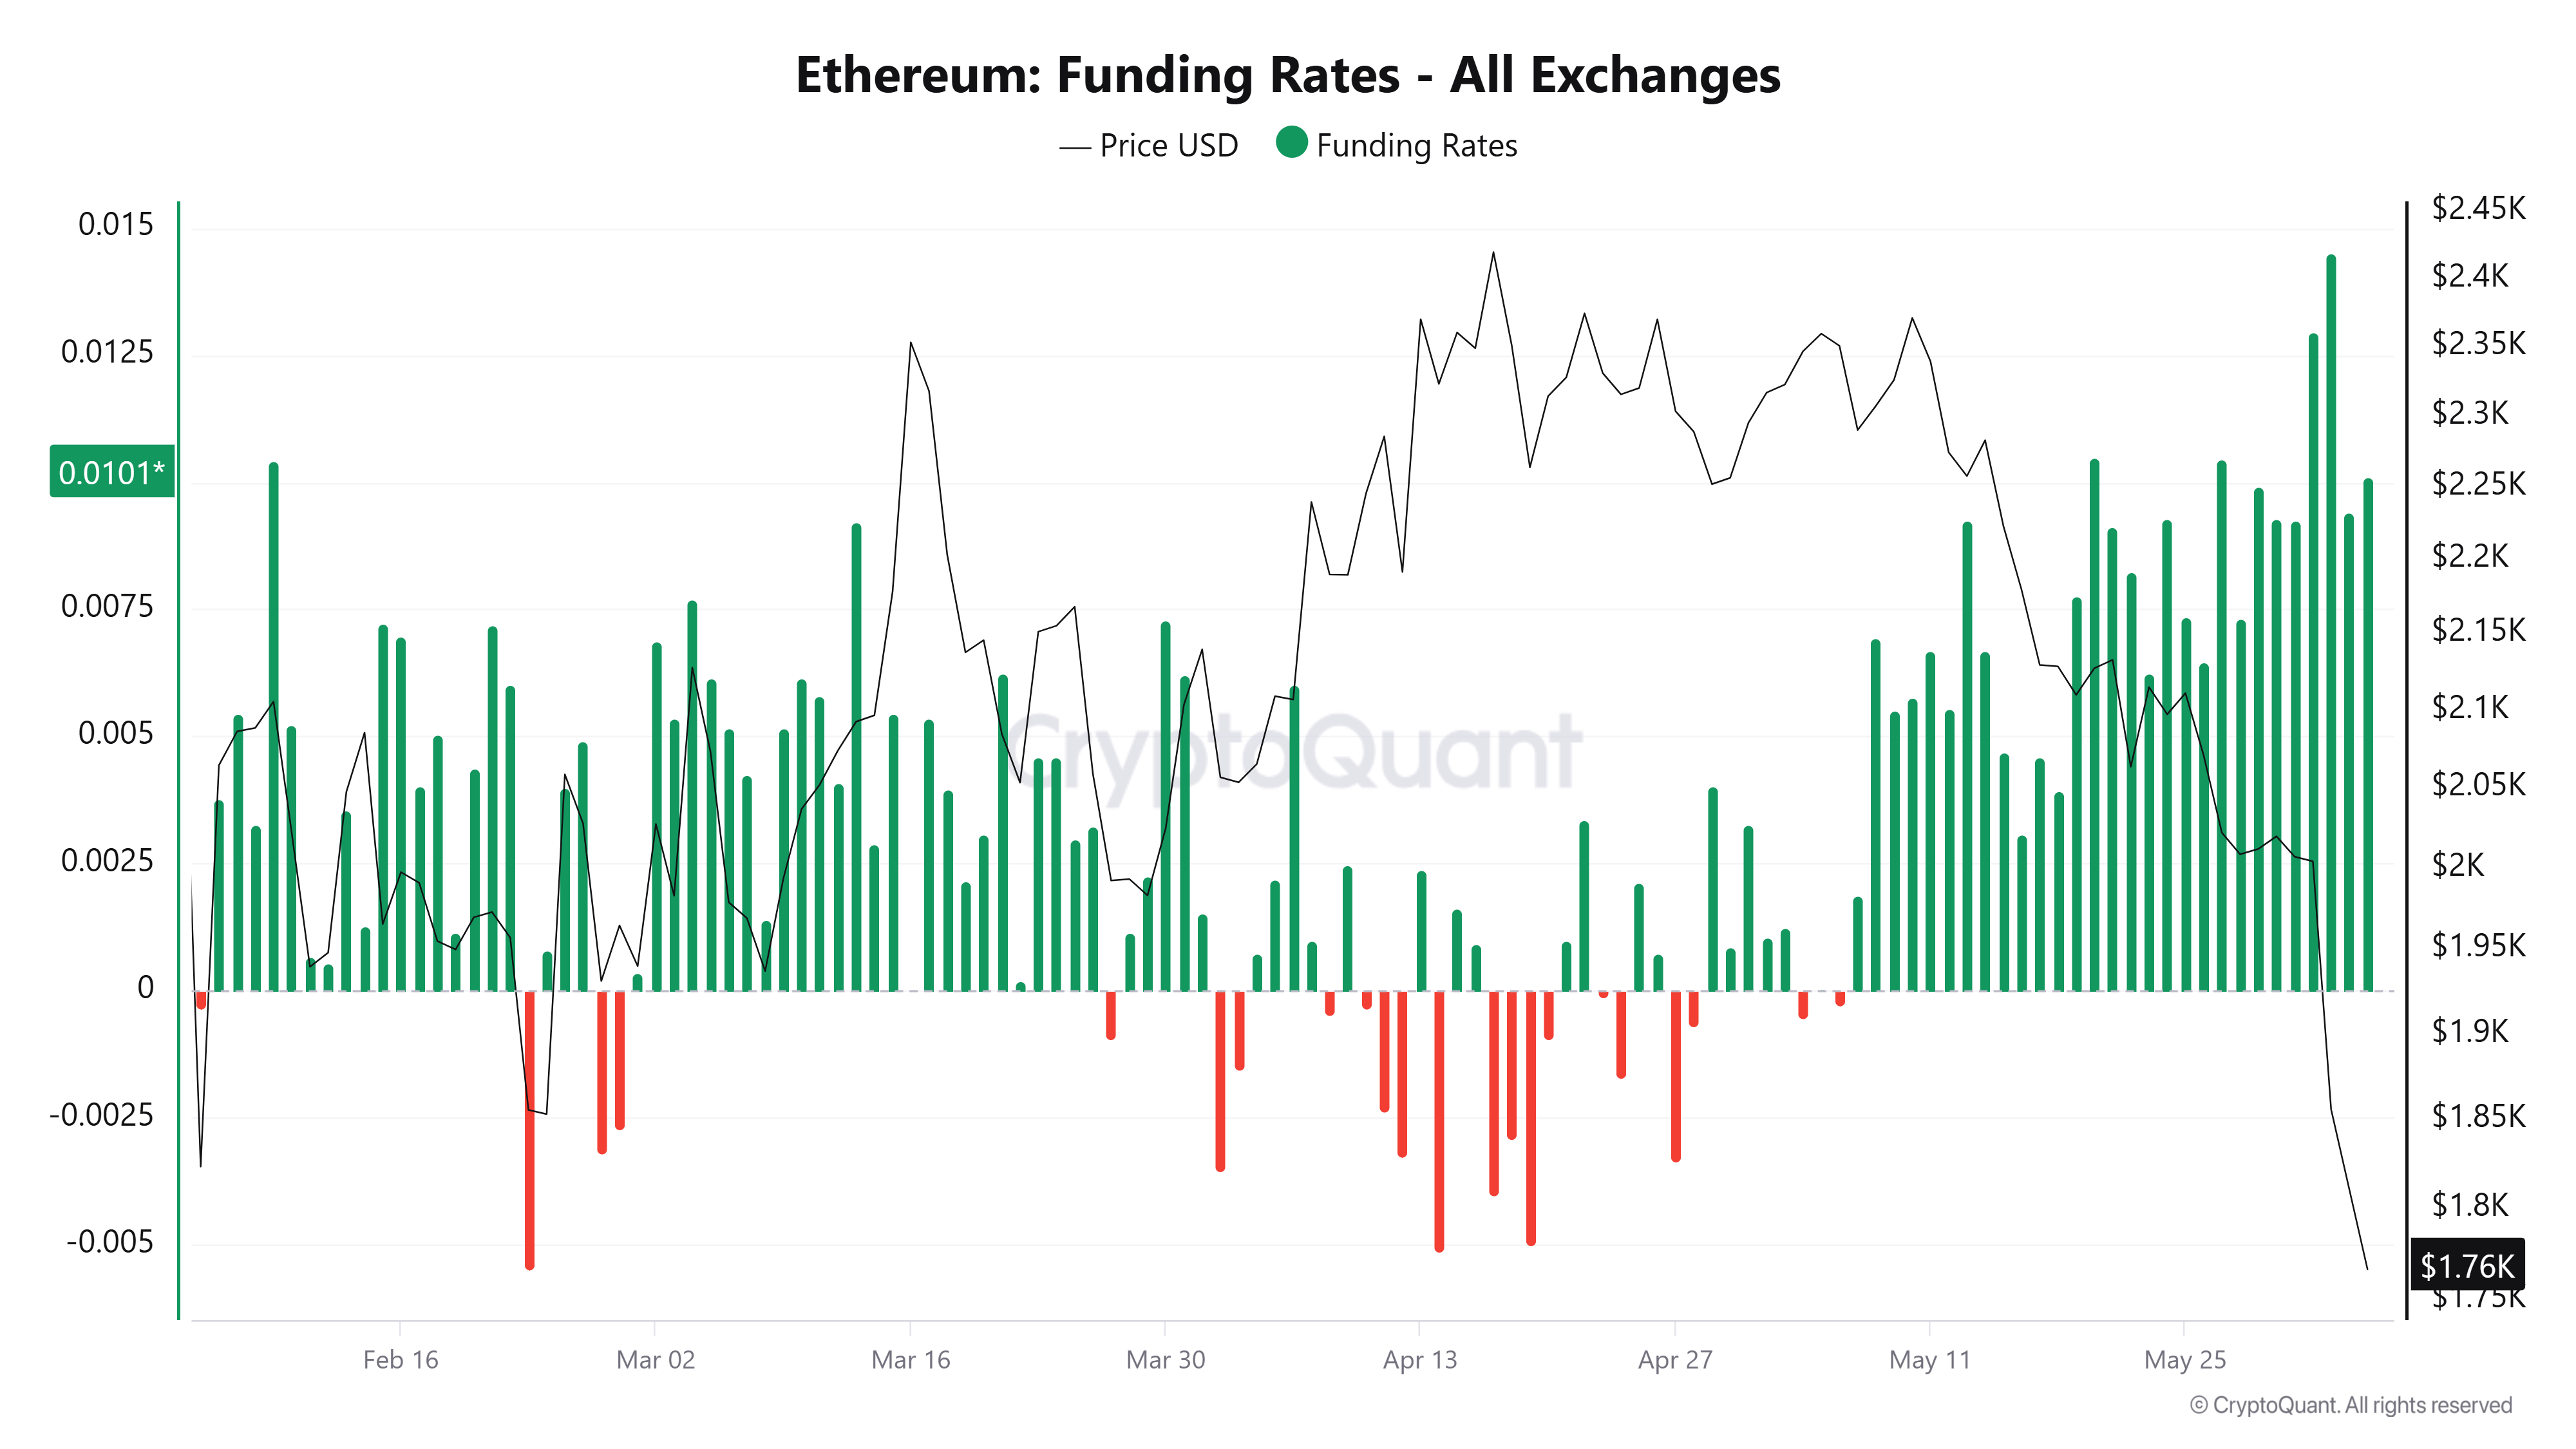
"The rise in funding rates to these levels suggests that many traders anticipate a near-term price rebound, prompting them to increasingly enter long positions. However, this optimism coincides with Bitcoin's continued decline and the overall weakness in the market, creating a discrepancy between price action and trader behavior in the derivatives market," noted CryptoQuant analyst Arab Chain in a Wednesday report.
"Furthermore, high funding levels during a weak market may indicate that the market is overcrowded with long positions. This means that any further decline in Bitcoin could force traders to close their positions, potentially exacerbating volatility and putting downward pressure on Ethereum and other altcoins."
Ethereum Price Forecast: ETH breaks below $1,800, targets $1,740 support
On the daily chart, ETH is extending its bearish bias as price remains well below the 20-, 50-, and 100-day Exponential Moving Averages (EMAs), clustered between roughly $2,030 and $2,245. This configuration suggests the broader downtrend remains dominant despite deeply oversold conditions, with the 14-day Relative Strength Index (RSI) hovering near 21 and the Stochastic also lodged in oversold territory, hinting that any rebound could initially be corrective within a capped structure.
On the topside, initial resistance emerges at $1,909, ahead of $2,018 and the 20-day EMA near $2,030. Beyond that, the 50-day EMA at $2,134 and the horizontal barrier at $2,107 form a thicker supply band, before higher caps at $2,211, the 100-day EMA around $2,244 and $2,388.
On the downside, immediate support is seen at $1,740, with a break exposing $1,524. Below there, a deeper slide could target the structural floor around $1,404.
(The technical analysis of this story was written with the help of an AI tool.)


