
EUR/USD Price Forecast: Falls toward 1.1500 near seven-month lows
بواسطة Akhtar Faruqui
تاريخ النشر: 9 Mar 2026 | تاريخ التعديل: 9 Mar 2026


المقالات الشائعة

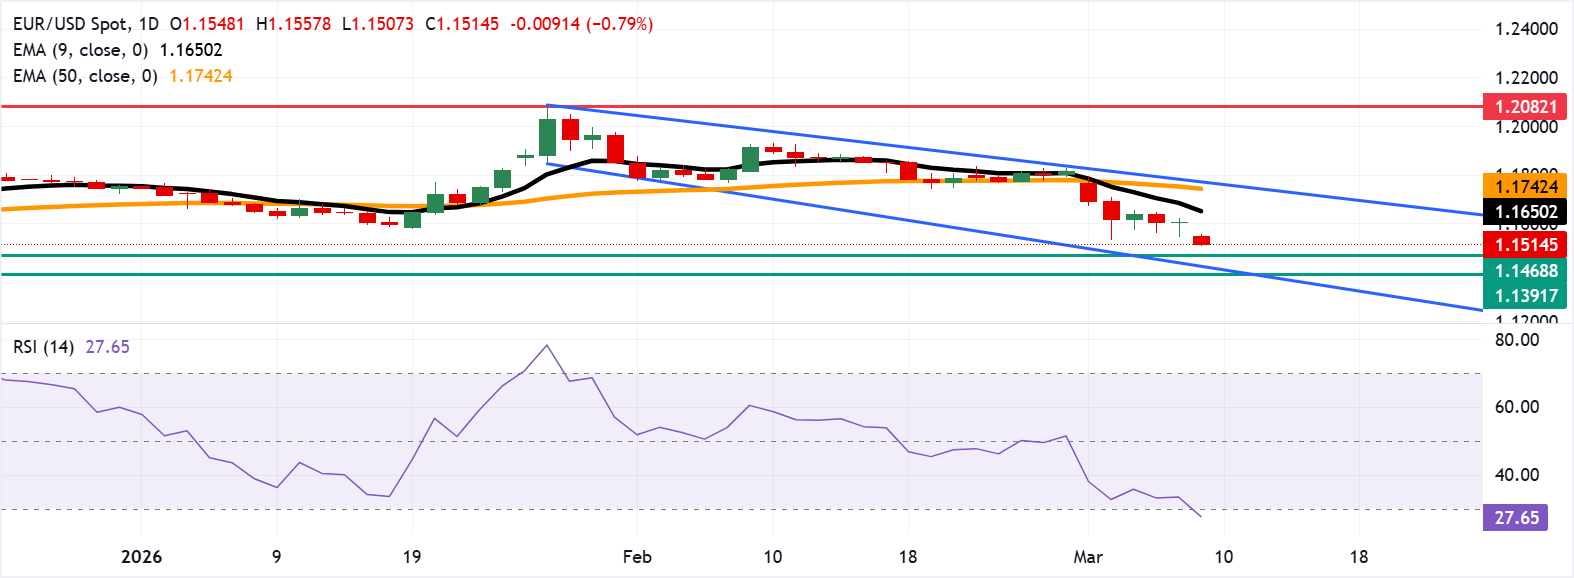
EUR/USD edges higher after registering little gains in the previous session, trading around 1.1520 during the Asian hours on Monday. The technical analysis of the daily chart suggests an ongoing bearish bias as the pair remains within the descending channel pattern.
- EUR/USD may find the initial support at the seven-month low of 1.1468.
- The 14-day Relative Strength Index falls below 30, signaling oversold conditions.
- Initial resistance is seen at the nine-day EMA around 1.1650.
EUR/USD edges higher after registering little gains in the previous session, trading around 1.1520 during the Asian hours on Monday. The technical analysis of the daily chart suggests an ongoing bearish bias as the pair remains within the descending channel pattern.
The near-term bias is bearish as the pair extends its decline below the nine-day Exponential Moving Average (EMA), which has turned lower and now tracks well above spot, reinforcing short-term downside pressure. Price also holds beneath the 50-day EMA, keeping the broader trend tilted to the downside despite earlier consolidation.
The 14-day Relative Strength Index (RSI) momentum indicator has slipped below 30, signaling oversold conditions. Yet, the persistent deterioration from mid-range readings indicates sellers remain in control for now rather than a completed exhaustion phase.
The primary support lies at the seven-month low of 1.1468. Further declines would put downward pressure on the EUR/USD pair to test the lower boundary of the descending channel around 1.1430, followed by the nine-month low of 1.1391.
On the upside, the EUR/USD may approach the initial resistance at the nine-day EMA of 1.1650, where any rebound would face a first technical hurdle within the prevailing downtrend. A more meaningful recovery would require a daily close back above the 50-day EMA at 1.1742, followed by the upper descending channel boundary around 1.1790, to ease bearish momentum and open the path toward 1.2082, the highest level since June 2021.
(The technical analysis of this story was written with the help of an AI tool.)
Euro Price Today
The table below shows the percentage change of Euro (EUR) against listed major currencies today. Euro was the weakest against the Canadian Dollar.
| USD | EUR | GBP | JPY | CAD | AUD | NZD | CHF | |
|---|---|---|---|---|---|---|---|---|
| USD | 0.76% | 0.71% | 0.60% | -0.20% | 0.45% | 0.47% | 0.56% | |
| EUR | -0.76% | -0.05% | -0.18% | -0.96% | -0.31% | -0.30% | -0.21% | |
| GBP | -0.71% | 0.05% | -0.11% | -0.91% | -0.26% | -0.25% | -0.16% | |
| JPY | -0.60% | 0.18% | 0.11% | -0.81% | -0.16% | -0.14% | -0.05% | |
| CAD | 0.20% | 0.96% | 0.91% | 0.81% | 0.66% | 0.67% | 0.76% | |
| AUD | -0.45% | 0.31% | 0.26% | 0.16% | -0.66% | 0.01% | 0.11% | |
| NZD | -0.47% | 0.30% | 0.25% | 0.14% | -0.67% | -0.01% | 0.09% | |
| CHF | -0.56% | 0.21% | 0.16% | 0.05% | -0.76% | -0.11% | -0.09% |
The heat map shows percentage changes of major currencies against each other. The base currency is picked from the left column, while the quote currency is picked from the top row. For example, if you pick the Euro from the left column and move along the horizontal line to the US Dollar, the percentage change displayed in the box will represent EUR (base)/USD (quote).

يعتمد أكثر من مليون مستخدم على FXStreet للحصول على بيانات سوقية لحظية، وأدوات رسوم بيانية، ورؤى خبراء، وأخبار الفوركس. يساعد تقويمهم الاقتصادي الشامل والندوات التعليمية عبر الويب المتداولين على البقاء على اطلاع واتخاذ قرارات محسوبة. لدى FXStreet فريق يضم حوالي 60 محترفًا موزعين بين مقر برشلونة ومناطق عالمية مختلفة.
اقرأ المزيد


