
EUR/USD Price Forecast: Remains above nine-day EMA, 1.1550
بواسطة Akhtar Faruqui
تاريخ النشر: 23 Mar 2026 | تاريخ التعديل: 23 Mar 2026


المقالات الشائعة

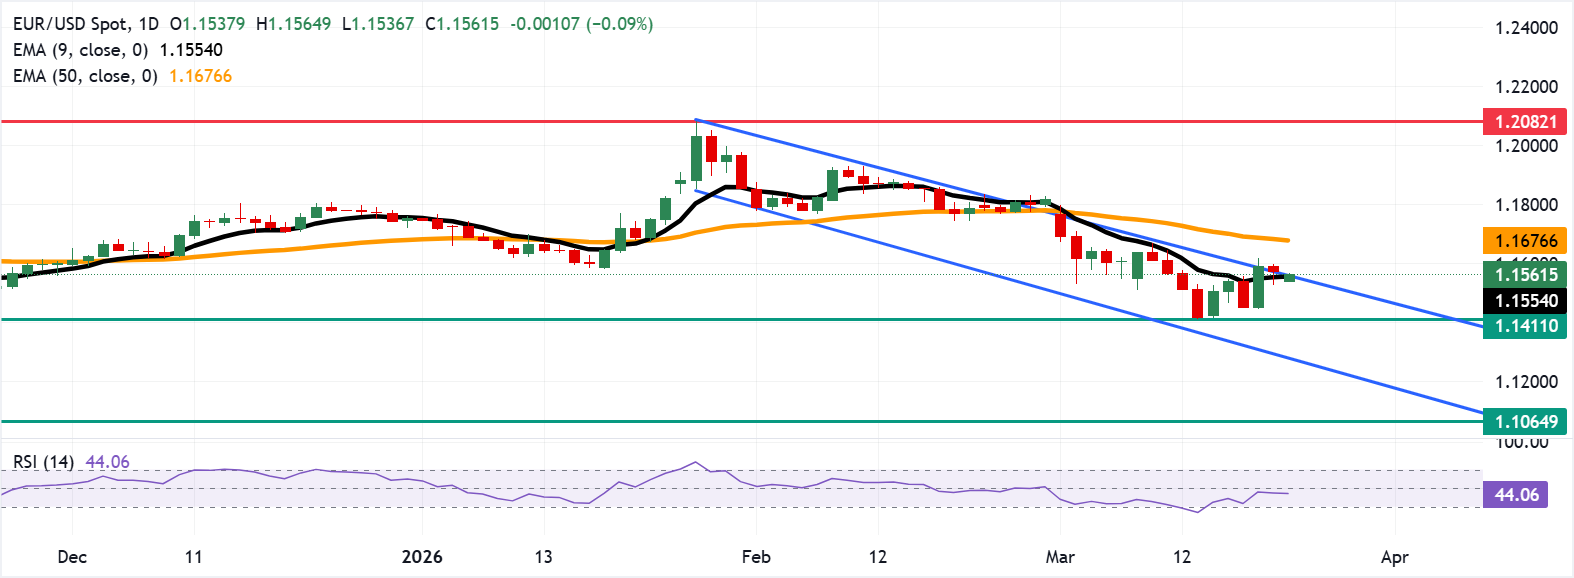
EUR/USD recovers its daily losses after opening at a gap down, trading near 1.1560 during Asian hours on Monday. Daily chart technical analysis indicates a potential bullish reversal as the pair is testing the upper boundary of the descending channel pattern.
- EUR/USD tests the upper descending channel boundary around 1.1570.
- The 14-day Relative Strength Index is at 44, signaling continued selling pressure and weak momentum.
- A break below the nine-day EMA would push the pair toward the seven-month low of 1.1411.
EUR/USD recovers its daily losses after opening at a gap down, trading near 1.1560 during Asian hours on Monday. Daily chart technical analysis indicates a potential bullish reversal as the pair is testing the upper boundary of the descending channel pattern.
Price action suggests a mixed bias, trading above the nine-day Exponential Moving Average (EMA) but below the 50-day EMA. This indicates short-term bullish momentum within a broader bearish trend, with gains likely limited unless price breaks above the medium-term average decisively.
The 14-day Relative Strength Index (RSI) momentum indicator at 44 remains below the 50 midline and points to persistent selling pressure.
The EUR/USD pair is testing the immediate resistance at the upper descending channel boundary around 1.1570. A break above the channel would strengthen the market bias and support the pair to approach the 50-day EMA at 1.676.
On the downside, the immediate support lies at the nine-day EMA of 1.1554. A break below the short-term average would strengthen the bearish bias and put downward pressure on the pair to test the seven-month low of 1.1411, recorded on March 13, followed by the lower boundary of the descending channel around 1.1290.
(The technical analysis of this story was written with the help of an AI tool.)
Euro Price Today
The table below shows the percentage change of Euro (EUR) against listed major currencies today. Euro was the weakest against the Canadian Dollar.
| USD | EUR | GBP | JPY | CAD | AUD | NZD | CHF | |
|---|---|---|---|---|---|---|---|---|
| USD | 0.11% | 0.00% | 0.06% | -0.16% | 0.34% | 0.18% | 0.00% | |
| EUR | -0.11% | -0.11% | 0.00% | -0.27% | 0.34% | 0.06% | -0.11% | |
| GBP | -0.00% | 0.11% | 0.09% | -0.16% | 0.45% | 0.17% | -0.01% | |
| JPY | -0.06% | 0.00% | -0.09% | -0.22% | 0.26% | 0.04% | -0.08% | |
| CAD | 0.16% | 0.27% | 0.16% | 0.22% | 0.47% | 0.21% | 0.11% | |
| AUD | -0.34% | -0.34% | -0.45% | -0.26% | -0.47% | -0.28% | -0.33% | |
| NZD | -0.18% | -0.06% | -0.17% | -0.04% | -0.21% | 0.28% | -0.14% | |
| CHF | -0.00% | 0.11% | 0.01% | 0.08% | -0.11% | 0.33% | 0.14% |
The heat map shows percentage changes of major currencies against each other. The base currency is picked from the left column, while the quote currency is picked from the top row. For example, if you pick the Euro from the left column and move along the horizontal line to the US Dollar, the percentage change displayed in the box will represent EUR (base)/USD (quote).

يعتمد أكثر من مليون مستخدم على FXStreet للحصول على بيانات سوقية لحظية، وأدوات رسوم بيانية، ورؤى خبراء، وأخبار الفوركس. يساعد تقويمهم الاقتصادي الشامل والندوات التعليمية عبر الويب المتداولين على البقاء على اطلاع واتخاذ قرارات محسوبة. لدى FXStreet فريق يضم حوالي 60 محترفًا موزعين بين مقر برشلونة ومناطق عالمية مختلفة.
اقرأ المزيد


