
EUR/USD Price Forecast: Tests 50-day EMA support after slipping below 1.1700
بواسطة Akhtar Faruqui
تم التحديث: 5 May 2026


المقالات الشائعة

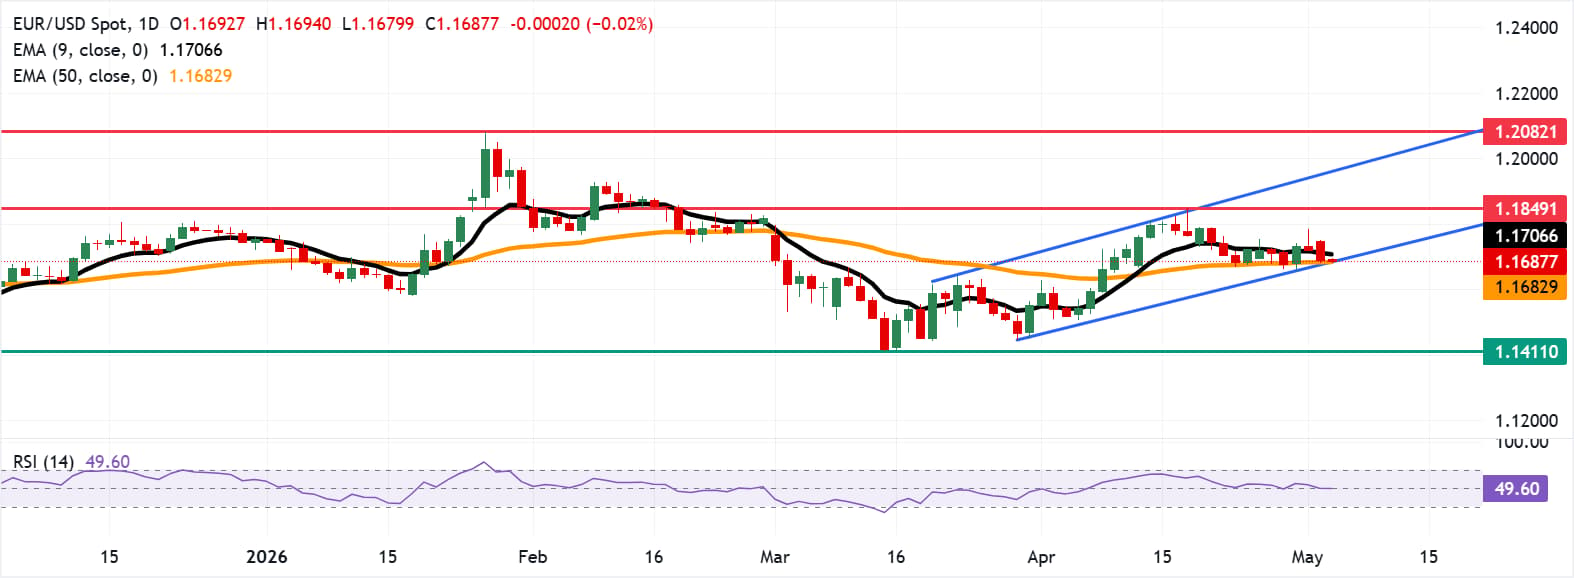
EUR/USD moves little after two days of losses, trading around 1.1690 during the Asian hours on Tuesday. The daily chart technical analysis indicates a potential for a bearish reversal, as the pair is testing the lower boundary of the ascending channel.
- EUR/USD tests immediate support at the 50-day EMA near 1.1682.
- The 14-day Relative Strength Index nears 50 underscores neutral momentum.
- The immediate barrier lies at the nine-day EMA around 1.1706.
EUR/USD moves little after two days of losses, trading around 1.1690 during the Asian hours on Tuesday. The daily chart technical analysis indicates a potential for a bearish reversal, as the pair is testing the lower boundary of the ascending channel.
However, a neutral near-term stance prevails as the EUR/USD pair hovers just above the 50-period Exponential Moving Average (EMA) but is capped by the nine-period EMA. This tight EMA split suggests consolidation rather than a clear trend.
The 14-day Relative Strength Index near 50 reinforces the idea of balanced momentum after the recent recovery.
The EUR/USD pair is testing the immediate support at the 50-day EMA of 1.1682, aligned with the lower ascending channel boundary. A sustained break below the channel would put downward pressure on the pair to navigate the region around the nine-month low of 1.1411, recorded on March 13.
On the upside, the immediate barrier lies at the nine-day EMA of 1.1706. A break above the short-term average would support the pair to the 11-week high of 1.1849, reached on April 17, followed by the upper boundary of the ascending channel around 1.1960. Further advances above the channel would lead the pair to explore the region around 1.2082, the highest since June 2021, reached on January 27.
(The technical analysis of this story was written with the help of an AI tool.)
Euro Price Today
The table below shows the percentage change of Euro (EUR) against listed major currencies today. Euro was the strongest against the New Zealand Dollar.
| USD | EUR | GBP | JPY | CAD | AUD | NZD | CHF | |
|---|---|---|---|---|---|---|---|---|
| USD | -0.01% | 0.00% | -0.03% | -0.04% | 0.04% | 0.05% | -0.04% | |
| EUR | 0.01% | 0.00% | -0.02% | -0.03% | 0.04% | 0.05% | -0.01% | |
| GBP | -0.01% | -0.00% | -0.02% | -0.05% | 0.05% | 0.05% | -0.02% | |
| JPY | 0.03% | 0.02% | 0.02% | -0.01% | 0.06% | 0.08% | 0.03% | |
| CAD | 0.04% | 0.03% | 0.05% | 0.01% | 0.08% | 0.08% | 0.02% | |
| AUD | -0.04% | -0.04% | -0.05% | -0.06% | -0.08% | 0.02% | -0.04% | |
| NZD | -0.05% | -0.05% | -0.05% | -0.08% | -0.08% | -0.02% | -0.07% | |
| CHF | 0.04% | 0.01% | 0.02% | -0.03% | -0.02% | 0.04% | 0.07% |
The heat map shows percentage changes of major currencies against each other. The base currency is picked from the left column, while the quote currency is picked from the top row. For example, if you pick the Euro from the left column and move along the horizontal line to the US Dollar, the percentage change displayed in the box will represent EUR (base)/USD (quote).

يعتمد أكثر من مليون مستخدم على FXStreet للحصول على بيانات سوقية لحظية، وأدوات رسوم بيانية، ورؤى خبراء، وأخبار الفوركس. يساعد تقويمهم الاقتصادي الشامل والندوات التعليمية عبر الويب المتداولين على البقاء على اطلاع واتخاذ قرارات محسوبة. لدى FXStreet فريق يضم حوالي 60 محترفًا موزعين بين مقر برشلونة ومناطق عالمية مختلفة.
اقرأ المزيد


