
Eurozone and Germany Composite PMIs revised higher: Here’s what it means for EUR/USD
Eurozone’s HCOB Composite Purchasing Managers’ Index (PMI) has been revised higher to 48.5 in May, better than the flash reading and estimates of 47.5. This signifies that the overall business activity continues to contract, but at a moderate pace. A figure below the 50.0 threshold is considered as a contraction in the business activity.
The German Composite PMI has also improved to 48.8 from the preliminary estimate of 48.6. An improvement in the overall Eurozone and the German Composite PMI appears to be the outcome of an also revised higher Services PMI. Eurozone’s Services PMI lands higher at 47.7 against the preliminary reading of 46.4.

The revised figures for the Eurozone and Germany HCOB Composite PMIs have come in higher than preliminary estimates, a scenario that showcases higher business output and should improve the appeal of the Euro (EUR). However, there seems to be no positive impact on the major currency, as the data confirmed that the Eurozone's HCOB Composite PMI fell at the sharpest pace in 18 months in May, marking back-to-back months of contraction for the first time since the end of 2024. Chris Williamson, Chief Business Economist at S&P Global Market Intelligence, notes that "With business activity in the eurozone falling for a second successive month in May, it is looking increasingly likely that the economy will slip into contraction in the second quarter. The PMI data are indicating a 0.2% quarterly GDP decline barring any significant change in June". As of writing, EUR/USD trades 0.17% lower to near 1.1610.
Euro Price Today
The table below shows the percentage change of Euro (EUR) against listed major currencies today. Euro was the weakest against the Japanese Yen.
| USD | EUR | GBP | JPY | CAD | AUD | NZD | CHF | |
|---|---|---|---|---|---|---|---|---|
| USD | 0.16% | 0.09% | -0.27% | 0.12% | 0.21% | 0.46% | 0.26% | |
| EUR | -0.16% | -0.07% | -0.43% | -0.04% | 0.06% | 0.29% | 0.10% | |
| GBP | -0.09% | 0.07% | -0.34% | 0.02% | 0.12% | 0.35% | 0.17% | |
| JPY | 0.27% | 0.43% | 0.34% | 0.33% | 0.42% | 0.64% | 0.48% | |
| CAD | -0.12% | 0.04% | -0.02% | -0.33% | 0.10% | 0.34% | 0.14% | |
| AUD | -0.21% | -0.06% | -0.12% | -0.42% | -0.10% | 0.23% | 0.03% | |
| NZD | -0.46% | -0.29% | -0.35% | -0.64% | -0.34% | -0.23% | -0.18% | |
| CHF | -0.26% | -0.10% | -0.17% | -0.48% | -0.14% | -0.03% | 0.18% |
The heat map shows percentage changes of major currencies against each other. The base currency is picked from the left column, while the quote currency is picked from the top row. For example, if you pick the Euro from the left column and move along the horizontal line to the US Dollar, the percentage change displayed in the box will represent EUR (base)/USD (quote).
What do Eurozone’s HCOB Composite PMI data mean for the EUR/USD?
The Eurozone’s Composite PMI data is a key indicator of the continent’s overall demand, which has been dampened lately due to the Middle East crisis. Elevated energy prices due to restricted oil flows have prompted inflationary pressures and have diminished households’ spending.
A slew of European Central Bank (ECB) officials have highlighted the need to raise interest rates to tame escalating inflation concerns. This should be Euro supportive. However, markets are currently focusing on the US-Iran headlines before placing fresh directional bets.
Technical Analysis: EUR/USD is at a make-or-break near 1.1610
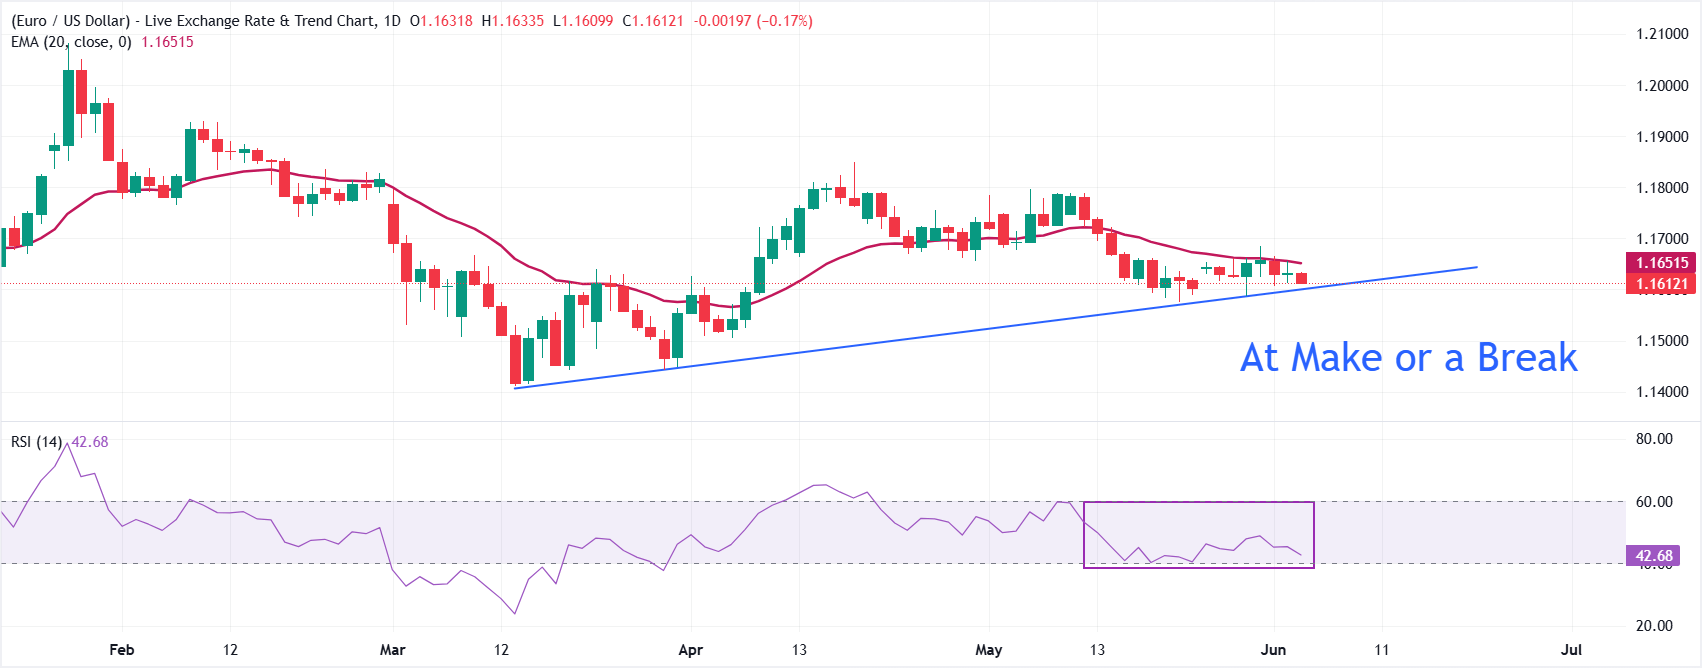
EUR/USD trades lower at around 1.1610 as of writing. The pair is in a mildly bearish trend as it holds below the 20-period Exponential Moving Average (EMA) at 1.1651 while clinging to trendline support.
The Relative Strength Index (RSI) (14) hovers near 42 on the daily chart, suggesting subdued downside momentum but not yet signaling oversold conditions, which hints that sellers still retain the upper hand unless price can reclaim the nearby EMA resistance.
On the topside, immediate resistance is defined by the 20-period EMA at 1.1651, and a daily close above this barrier would be needed to ease the current bearish pressure and allow a corrective bounce towards 1.1700. On the downside, initial support emerges around the former uptrend floor near 1.1610, and a break beneath this level would expose further weakness toward the May 21 low at 1.1576, followed by 1.1500.
(The technical analysis of this story was written with the help of an AI tool.)
Economic Indicator
HCOB Composite PMI
The Composite Purchasing Managers’ Index (PMI), released on a monthly basis by S&P Global and Hamburg Commercial Bank (HCOB), is a leading indicator gauging private-business activity in the Eurozone for both the manufacturing and services sectors. The data is derived from surveys to senior executives. Each response is weighted according to the size of the company and its contribution to total manufacturing or services output accounted for by the sub-sector to which that company belongs. Survey responses reflect the change, if any, in the current month compared to the previous month and can anticipate changing trends in official data series such as Gross Domestic Product (GDP), industrial production, employment and inflation. The index varies between 0 and 100, with levels of 50.0 signaling no change over the previous month. A reading above 50 indicates that the private economy is generally expanding, a bullish sign for the Euro (EUR). Meanwhile, a reading below 50 signals that activity is generally declining, which is seen as bearish for EUR.
Read more.Last release: Wed Jun 03, 2026 08:00
Frequency: Monthly
Actual: 48.5
Consensus: 47.5
Previous: 47.5
Source: S&P Global


