
GBP/JPY Price Forecast: Ascending Triangle formation reflects broader consolidation
بواسطة Sagar Dua
تم التحديث: 6 Apr 2026


المقالات الشائعة

The GBP/JPY pair trades almost flat at around 210.85 during the early European trading session on Monday.
- GBP/JPY flattens around 210.85 as investors await the outcome of Trump’s Tuesday ultimatum.
- US President Trump threatens to assault Iranian infrastructure if it doesn’t reopen the Strait of Hormuz.
- Both the BoE and the BoJ are unlikely to reduce interest rates in the near term.
The GBP/JPY pair trades almost flat at around 210.85 during the early European trading session on Monday. The pair consolidates as investors await fresh cues on the future of the Strait of Hormuz, a passage to almost 20% of global oil supply, being seized by Iran amid the ongoing war in the Middle East.
United States (US) President Donald Trump has threatened to destroy Iranian power plants and bridges if Tehran doesn’t reopen the Strait of Hormuz by Tuesday, 9:00 PM Eastern time (ET).
Meanwhile, a spokesperson from the Iranian foreign ministry has warned of reciprocal attacks on related US facilities.
Given that both the United Kingdom (UK) and Japan are net energy importers, higher oil prices are an unfavorable situation for them.
On the monetary front, both the Bank of England (BoE) and the Bank of Japan (BoJ) are unlikely to cut interest rates in the near term as higher oil prices have prompted global inflation expectations.
GBP/JPY technical analysis
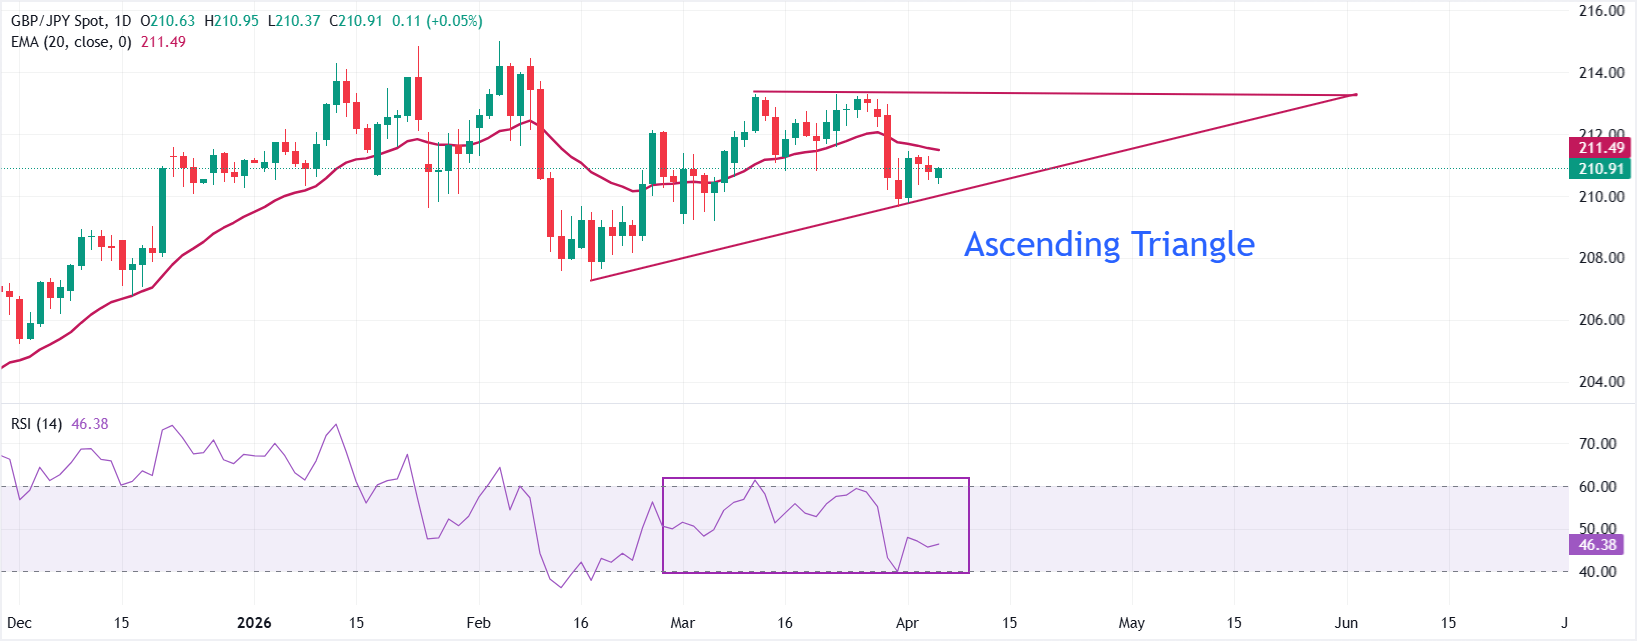
GBP/JPY trades flat at around 210.90 as of writing. The near-term bias is neutral with a slight downside tilt, as price fluctuates just below the 20-day Exponential Moving Average (EMA) near 211.50, losing upside momentum seen earlier in the month. The pair is compressed between an ascending support trend line from 207.26 and a descending resistance line from 213.38, indicating an emerging ascending consolidation rather than a clear trend extension.
The 14-day Relative Strength Index (RSI) inside the 40.00-60.00 signals volatility contraction, aligning with the rangebound tone and capping directional conviction for now.
Initial resistance emerges at the descending trend line near 213.40, with a daily close above this area needed to challenge the February high at 215.00. On the downside, immediate support is located at the March 2 low around 209.00, followed by the February 17 low at 207.24.
(The technical analysis of this story was written with the help of an AI tool.)

يعتمد أكثر من مليون مستخدم على FXStreet للحصول على بيانات سوقية لحظية، وأدوات رسوم بيانية، ورؤى خبراء، وأخبار الفوركس. يساعد تقويمهم الاقتصادي الشامل والندوات التعليمية عبر الويب المتداولين على البقاء على اطلاع واتخاذ قرارات محسوبة. لدى FXStreet فريق يضم حوالي 60 محترفًا موزعين بين مقر برشلونة ومناطق عالمية مختلفة.
اقرأ المزيد


