
GBP/USD Price Forecast: Dark-cloud cover looms as bears eye 1.3500
بواسطة Christian Borjon Valencia
تم التحديث: 12 May 2026


المقالات الشائعة

GBP/USD retreats by over 0.55% on Tuesday amid political turmoil in the UK, as pressure mounts on Prime Minister Keir Starmer to step aside following cabinet resignations. Technically, the formation of a ‘dark-cloud cover’ suggests further downside if sellers drive the pair below 1.3500.
- Dark-cloud cover pattern signals rising downside pressure below 1.3500.
- RSI turns lower, confirming sellers are gaining momentum.
- Break below 1.3500 exposes 1.3482 and 1.3425 support levels.
GBP/USD retreats by over 0.55% on Tuesday amid political turmoil in the UK, as pressure mounts on Prime Minister Keir Starmer to step aside following cabinet resignations. Technically, the formation of a ‘dark-cloud cover’ suggests further downside if sellers drive the pair below 1.3500.
GBP/USD Price Forecast: Technical outlook
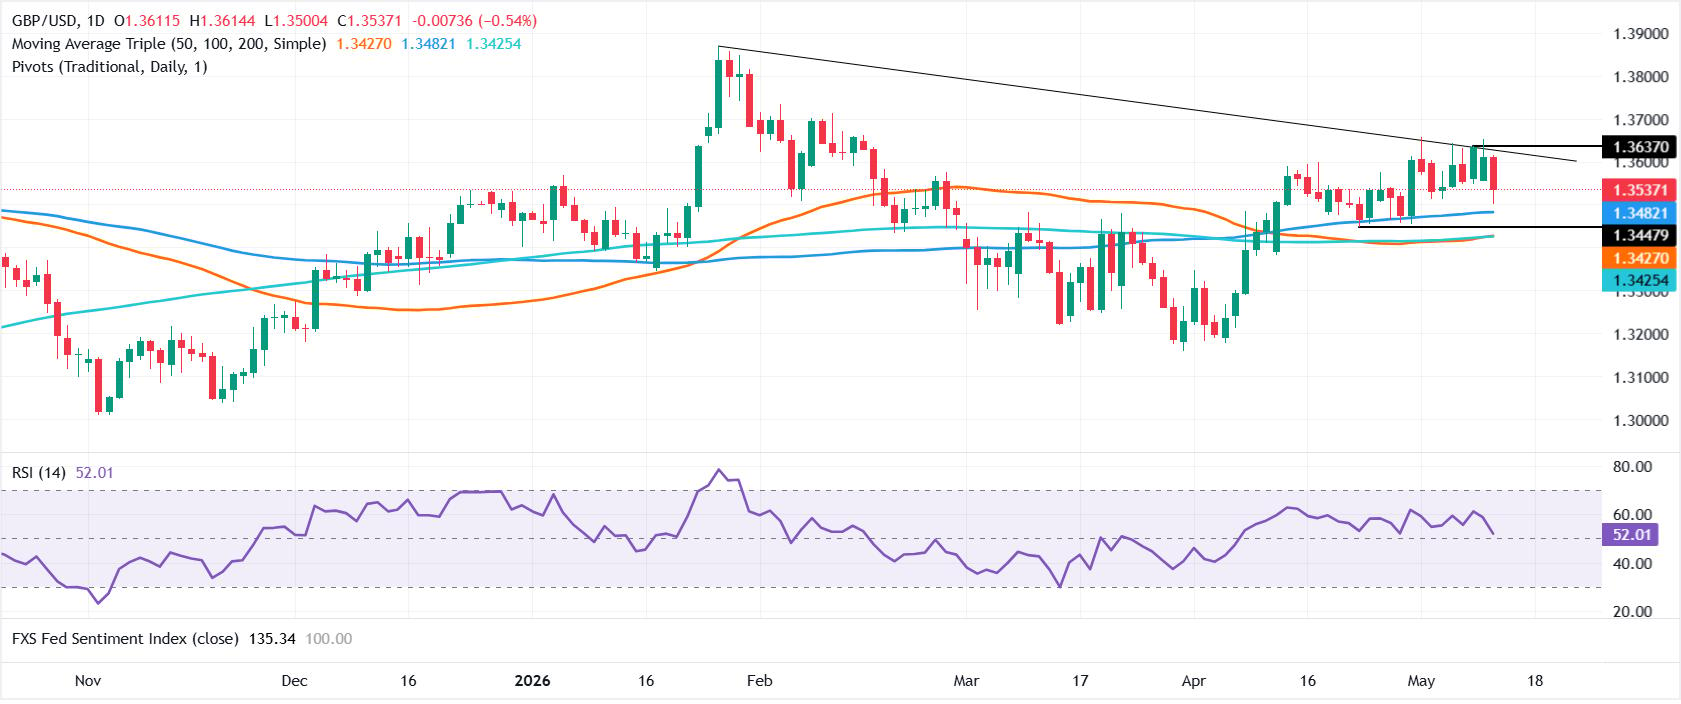
After consolidating around 1.3600, political pressure pushed GBP/USD lower. The Relative Strength Index (RSI) shows that sellers are gaining momentum, as it points downwards, indicating a potential bearish turn.
For a bearish continuation, sellers must keep the GBP/USD below 1.3500. In that outcome, the next support would be the 100-day Simple Moving Average (SMA) at 1.3482, followed by the confluence of the 50- and 200-day SMA near 1.3427/25. On further weakness, the next area of interest would be the 1.3400 mark.
On the flip side, bulls must climb above 1.3550 to challenge the 1.3600 milestone. Above this level, the next area of interest would be the May 8 daily high at 1.3637, followed by key resistance levels 1.3650 and 1.3700.
GBP/USD Price Chart – Daily
Pound Sterling Price Today
The table below shows the percentage change of British Pound (GBP) against listed major currencies today. British Pound was the strongest against the Swiss Franc.
| USD | EUR | GBP | JPY | CAD | AUD | NZD | CHF | |
|---|---|---|---|---|---|---|---|---|
| USD | 0.36% | 0.55% | 0.22% | 0.16% | 0.18% | 0.19% | 0.36% | |
| EUR | -0.36% | 0.19% | -0.11% | -0.21% | -0.19% | -0.18% | -0.00% | |
| GBP | -0.55% | -0.19% | -0.30% | -0.41% | -0.38% | -0.36% | -0.19% | |
| JPY | -0.22% | 0.11% | 0.30% | -0.12% | -0.08% | -0.05% | 0.10% | |
| CAD | -0.16% | 0.21% | 0.41% | 0.12% | 0.03% | 0.06% | 0.21% | |
| AUD | -0.18% | 0.19% | 0.38% | 0.08% | -0.03% | 0.02% | 0.19% | |
| NZD | -0.19% | 0.18% | 0.36% | 0.05% | -0.06% | -0.02% | 0.16% | |
| CHF | -0.36% | 0.00% | 0.19% | -0.10% | -0.21% | -0.19% | -0.16% |
The heat map shows percentage changes of major currencies against each other. The base currency is picked from the left column, while the quote currency is picked from the top row. For example, if you pick the British Pound from the left column and move along the horizontal line to the US Dollar, the percentage change displayed in the box will represent GBP (base)/USD (quote).

يعتمد أكثر من مليون مستخدم على FXStreet للحصول على بيانات سوقية لحظية، وأدوات رسوم بيانية، ورؤى خبراء، وأخبار الفوركس. يساعد تقويمهم الاقتصادي الشامل والندوات التعليمية عبر الويب المتداولين على البقاء على اطلاع واتخاذ قرارات محسوبة. لدى FXStreet فريق يضم حوالي 60 محترفًا موزعين بين مقر برشلونة ومناطق عالمية مختلفة.
اقرأ المزيد


