
GBP/USD Price Forecast: Remains above nine-day EMA near 1.3650
بواسطة Akhtar Faruqui
تاريخ النشر: 11 Feb 2026 | تاريخ التعديل: 11 Feb 2026


المقالات الشائعة

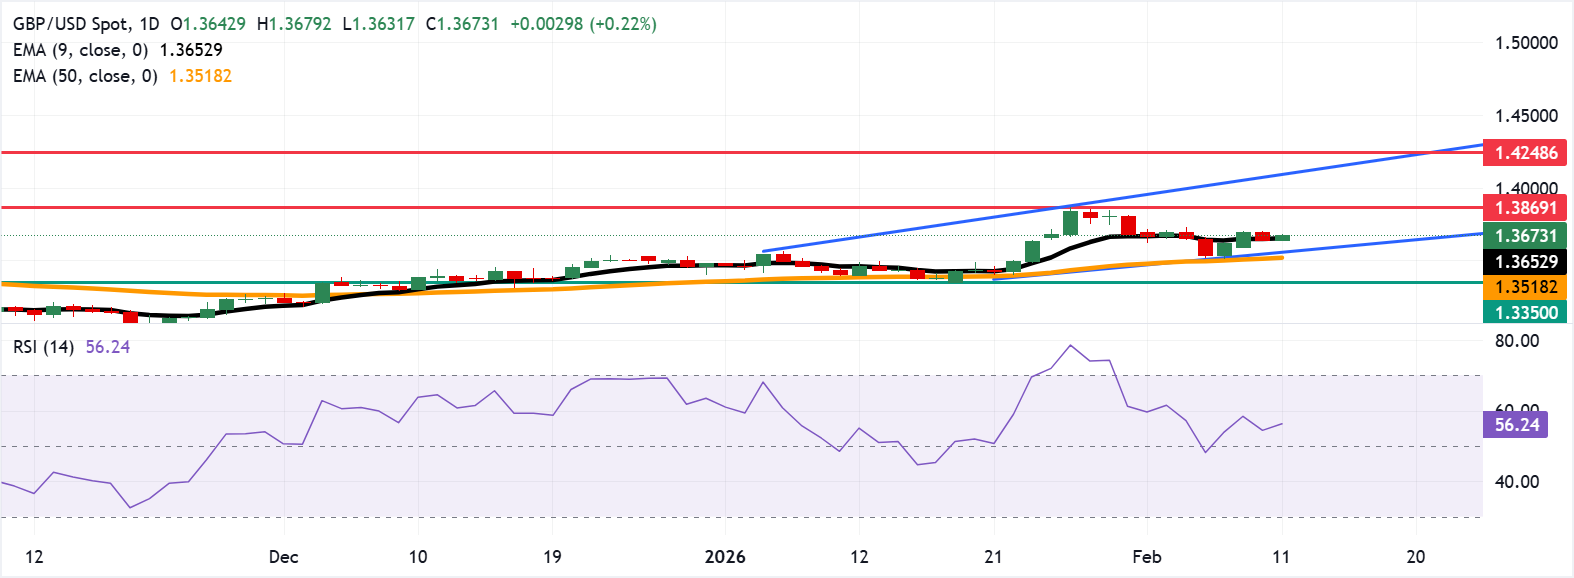
GBP/USD recovers its recent losses from the previous session, trading around 1.3680 during the European hours on Wednesday. The technical analysis of the daily chart indicates a sustained bullish bias, as the pair trades within an ascending channel pattern.
- GBP/USD may explore the region around 1.3869, the highest since September 2021.
- The 14-day Relative Strength Index at 55.94 signals steady bullish momentum.
- The immediate support is seen at the nine-day EMA near 1.3652.
GBP/USD recovers its recent losses from the previous session, trading around 1.3680 during the European hours on Wednesday. The technical analysis of the daily chart indicates a sustained bullish bias, as the pair trades within an ascending channel pattern.
The 14-day Relative Strength Index (RSI), a momentum indicator, at 55.94 sits above the 50 mid-line, confirming steady bullish momentum without overbought stress. The nine-day Exponential Moving Average (EMA) rises above the 50-day EMA at 1.3518, keeping the near-term bias positive as price holds above both gauges. The 50-day EMA trends higher, underlining an improving medium-term backdrop.
A topside extension would target resistance at 1.3869, the highest since September 2021, reached on January 27, followed by the upper boundary of the ascending channel around 1.4110. A break above the channel may trigger a fresh rally toward 1.4248, the highest level since April 2018.
On the downside, the immediate support lies at the nine-day EMA at 1.3652. Further weakness could draw a pullback toward support at the lower boundary of the ascending channel around 1.3570, followed by the 50-day EMA at 1.3518. Further declines would put downward pressure on the GBP/USD pair, testing the support reversal zone around 1.3350.
(The technical analysis of this story was written with the help of an AI tool.)
Pound Sterling Price Today
The table below shows the percentage change of British Pound (GBP) against listed major currencies today. British Pound was the strongest against the US Dollar.
| USD | EUR | GBP | JPY | CAD | AUD | NZD | CHF | |
|---|---|---|---|---|---|---|---|---|
| USD | -0.17% | -0.21% | -0.69% | -0.22% | -0.40% | -0.16% | -0.33% | |
| EUR | 0.17% | -0.04% | -0.55% | -0.05% | -0.23% | 0.00% | -0.17% | |
| GBP | 0.21% | 0.04% | -0.50% | -0.01% | -0.19% | 0.05% | -0.12% | |
| JPY | 0.69% | 0.55% | 0.50% | 0.50% | 0.32% | 0.56% | 0.39% | |
| CAD | 0.22% | 0.05% | 0.00% | -0.50% | -0.18% | 0.06% | -0.11% | |
| AUD | 0.40% | 0.23% | 0.19% | -0.32% | 0.18% | 0.24% | 0.07% | |
| NZD | 0.16% | -0.01% | -0.05% | -0.56% | -0.06% | -0.24% | -0.17% | |
| CHF | 0.33% | 0.17% | 0.12% | -0.39% | 0.11% | -0.07% | 0.17% |
The heat map shows percentage changes of major currencies against each other. The base currency is picked from the left column, while the quote currency is picked from the top row. For example, if you pick the British Pound from the left column and move along the horizontal line to the US Dollar, the percentage change displayed in the box will represent GBP (base)/USD (quote).

يعتمد أكثر من مليون مستخدم على FXStreet للحصول على بيانات سوقية لحظية، وأدوات رسوم بيانية، ورؤى خبراء، وأخبار الفوركس. يساعد تقويمهم الاقتصادي الشامل والندوات التعليمية عبر الويب المتداولين على البقاء على اطلاع واتخاذ قرارات محسوبة. لدى FXStreet فريق يضم حوالي 60 محترفًا موزعين بين مقر برشلونة ومناطق عالمية مختلفة.
اقرأ المزيد


