
Gold falls to YTD low as higher-for-longer interest rate outlook weighs
بواسطة Vishal Chaturvedi
تم التحديث: 11 Jun 2026


المقالات الشائعة

Gold (XAU/USD) slides to a six-month low on Thursday, wiping out all the gains recorded this year as a combination of hawkish central bank expectations and technical selling keeps buyers on the sidelines.
- Gold falls to its lowest level since November 2025, erasing all gains recorded this year.
- Hawkish central bank expectations driven by elevated Oil prices continue to weigh on the non-yielding metal.
- The recent break below the 200-day SMA keeps bears firmly in control.
Gold (XAU/USD) slides to a six-month low on Thursday, wiping out all the gains recorded this year as a combination of hawkish central bank expectations and technical selling keeps buyers on the sidelines.
XAU/USD briefly dropped to $4,023, its weakest level since November 2025, before recovering toward $4,090 at the time of writing.
Is Gold losing its safe-haven appeal?
The US-Iran war has put Gold's traditional safe-haven status to the test, with the US Dollar (USD) emerging as the market's preferred defensive asset. While tensions in the Middle East continue to escalate, the precious metal is down about 25% since the war began in late February and nearly 27% from its January record high near $5,600.
The sell-off has been driven largely by a shift in interest-rate expectations among traders. The Mideast war has pushed Oil prices higher, stoking inflation concerns and increasing pressure on major central banks, particularly the Federal Reserve (Fed), to tighten monetary policy stance or even consider raising interest rates.
US inflation has nearly doubled since the outbreak of the war, rising from 2.4% in January, before the war began, to 4.2% in May, the highest reading since April 2023.
As a result, traders are increasingly pricing in the likelihood of a Fed rate hike this year instead of at least two rate cuts that were expected at the start of 2026.
While Gold is often viewed as a hedge against inflation, higher interest rates tend to weigh on the precious metal because it offers no yield, making interest-bearing assets such as bonds more attractive.
Are bears still in control?
The technical outlook suggests bears hold the upper hand following XAU/USD's recent breakdown below the 200-day Simple Moving Average (SMA).
Renewed hostilities in the Middle East after Tehran downed a US Apache helicopter earlier this week have dimmed hopes for a near-term agreement, raising fears of prolonged disruptions through the Strait of Hormuz. With macro headwinds still intact, the path of least resistance remains to the downside.
Technical analysis: Oversold signals emerge, but the trend remains bearish
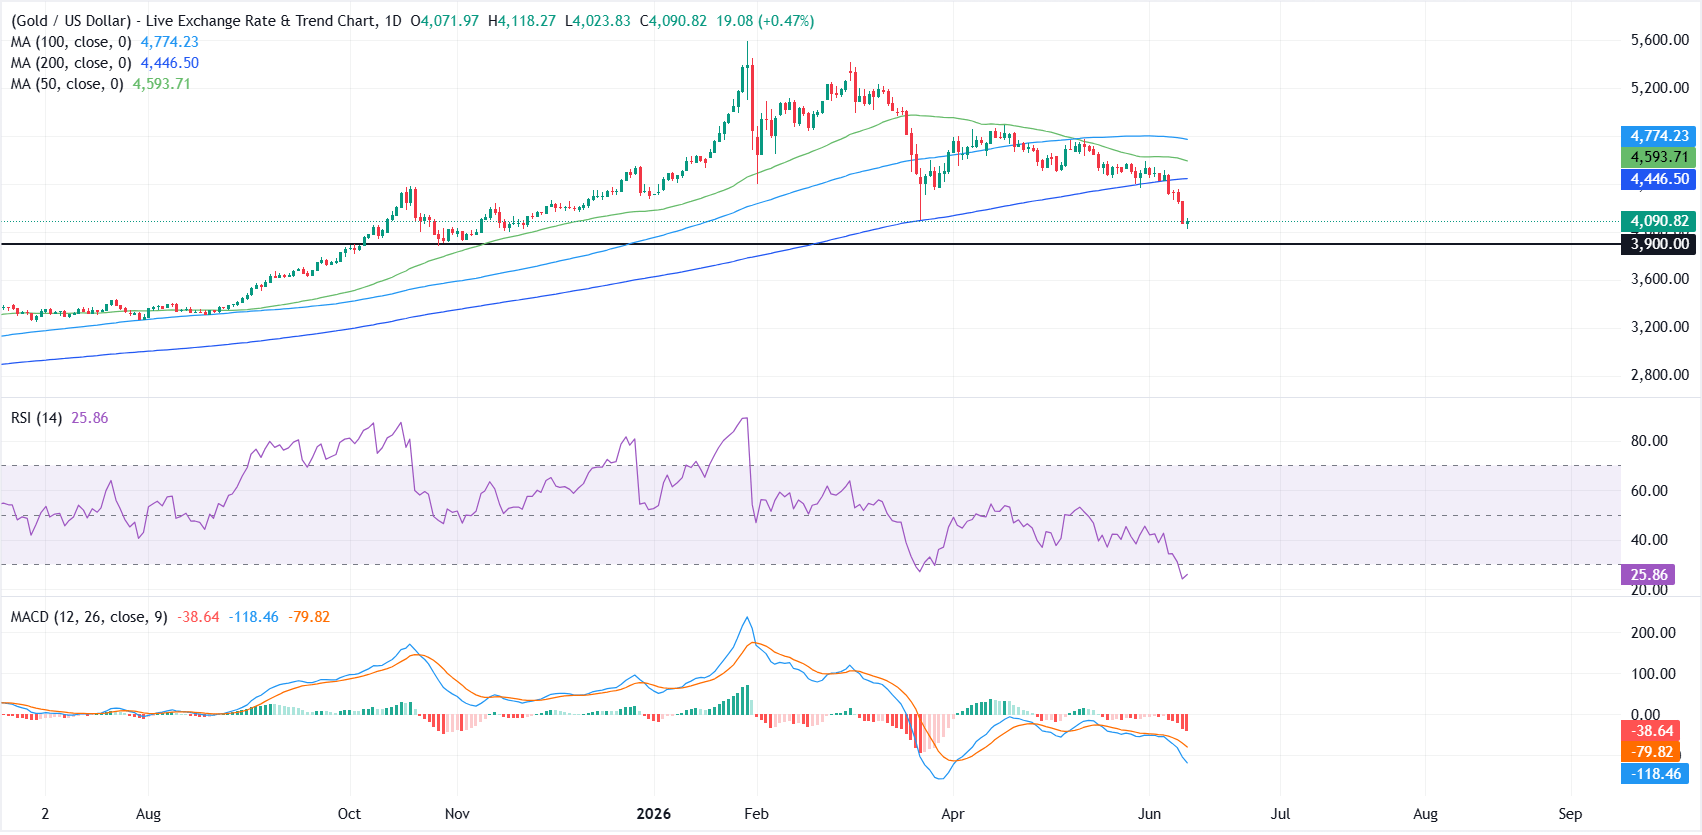
XAU/USD extends its bearish phase as spot holds well beneath the 200-day, 50-day and 100-day Simple Moving Averages (SMAs), which all cluster overhead as a broad supply zone.
The Relative Strength Index (RSI) on the daily chart sits in oversold territory near 26, while the Moving Average Convergence Divergence (MACD) remains deeply negative with the line below its signal and the histogram entrenched in the red, which together suggest strong but stretched downside momentum rather than a confirmed base.
On the topside, initial resistance emerges at the 200-day SMA around $4,446.50, with further barriers at the 50-day SMA near $4,593.71 and the 100-day SMA close to $4,774.23, levels that are likely to cap rebound attempts while the broader tone remains weak. On the downside, the psychological $4,000 level is the immediate support to watch, followed by the horizontal level at $3,900, where a break would reopen the sell-off toward lower cycle lows.
(The technical analysis of this story was written with the help of an AI tool.)
Inflation FAQs
Inflation measures the rise in the price of a representative basket of goods and services. Headline inflation is usually expressed as a percentage change on a month-on-month (MoM) and year-on-year (YoY) basis. Core inflation excludes more volatile elements such as food and fuel which can fluctuate because of geopolitical and seasonal factors. Core inflation is the figure economists focus on and is the level targeted by central banks, which are mandated to keep inflation at a manageable level, usually around 2%.
The Consumer Price Index (CPI) measures the change in prices of a basket of goods and services over a period of time. It is usually expressed as a percentage change on a month-on-month (MoM) and year-on-year (YoY) basis. Core CPI is the figure targeted by central banks as it excludes volatile food and fuel inputs. When Core CPI rises above 2% it usually results in higher interest rates and vice versa when it falls below 2%. Since higher interest rates are positive for a currency, higher inflation usually results in a stronger currency. The opposite is true when inflation falls.
Although it may seem counter-intuitive, high inflation in a country pushes up the value of its currency and vice versa for lower inflation. This is because the central bank will normally raise interest rates to combat the higher inflation, which attract more global capital inflows from investors looking for a lucrative place to park their money.
Formerly, Gold was the asset investors turned to in times of high inflation because it preserved its value, and whilst investors will often still buy Gold for its safe-haven properties in times of extreme market turmoil, this is not the case most of the time. This is because when inflation is high, central banks will put up interest rates to combat it. Higher interest rates are negative for Gold because they increase the opportunity-cost of holding Gold vis-a-vis an interest-bearing asset or placing the money in a cash deposit account. On the flipside, lower inflation tends to be positive for Gold as it brings interest rates down, making the bright metal a more viable investment alternative.

يعتمد أكثر من مليون مستخدم على FXStreet للحصول على بيانات سوقية لحظية، وأدوات رسوم بيانية، ورؤى خبراء، وأخبار الفوركس. يساعد تقويمهم الاقتصادي الشامل والندوات التعليمية عبر الويب المتداولين على البقاء على اطلاع واتخاذ قرارات محسوبة. لدى FXStreet فريق يضم حوالي 60 محترفًا موزعين بين مقر برشلونة ومناطق عالمية مختلفة.
اقرأ المزيد


