
Gold holds firm as US‑Iran ceasefire doubts and US data loom
بواسطة Vishal Chaturvedi
تم التحديث: 9 Apr 2026


المقالات الشائعة

Gold (XAU/USD) holds steady on Thursday as markets closely monitor developments surrounding the fragile ceasefire in the Middle East.
- Gold prices hold steady as markets assess uncertainty surrounding the fragile US-Iran ceasefire.
- Traders await upcoming US data, including PCE inflation, GDP and jobless claims.
- Technically, XAU/USD trades range-bound between key moving averages, signaling a neutral near-term bias
Gold (XAU/USD) holds steady on Thursday as markets closely monitor developments surrounding the fragile ceasefire in the Middle East. At the time of writing, XAU/USD is trading around $4,750 after climbing to a three-week high above $4,800 a day earlier, as doubts over the durability of the US-Iran truce emerge.
Ceasefire doubts rise as Iran flags violations
Iran's Parliament Speaker, Mohammad Bagher Ghalibaf, said that three parts of the ceasefire agreement had already been violated. His comments came after Israeli strikes on Lebanon. Iran says Lebanon is part of the ceasefire, while the US and Israel argue it is not. Tehran has warned it could pull out of the agreement if attacks on Lebanon continue.
Markets now await US-Iran negotiations, with the first round of talks scheduled for Saturday in Pakistan, with the goal of achieving a permanent ceasefire and reopening the Strait of Hormuz.
In the meantime, US President Donald Trump posted on Truth Social that US forces would “remain in place, and around, Iran, until such time as the REAL AGREEMENT reached is fully complied with.”
Rising oil and geopolitics complicate Fed rate path
Uncertainty over whether the two-week ceasefire will hold is weighing on market sentiment, with Crude prices rebounding after a sharp pullback, keeping inflation concerns alive and complicating the Federal Reserve’s (Fed) interest rate path.
Meanwhile, the Fed's Minutes from the March meeting, released on Wednesday, highlighted a two-sided view. “Most participants,” said that a prolonged conflict in the Middle East could weaken labor market conditions, which may warrant additional rate cuts. At the same time, “many participants” flagged the risk of inflation staying elevated for longer, especially if Oil prices continue to rise, which could call for rate hikes.
Looking ahead, traders now await a heavy US economic data docket, including Personal Consumption Expenditure (PCE) inflation data for February, the final Q4 Gross Domestic Product (GDP) reading, Initial Jobless Claims, and Personal Income and Spending data. These releases could drive short-term moves in Gold and the US Dollar (USD), while focus remains on developments around the US-Iran ceasefire.
Technical analysis: XAU/USD holds above 100-day SMA
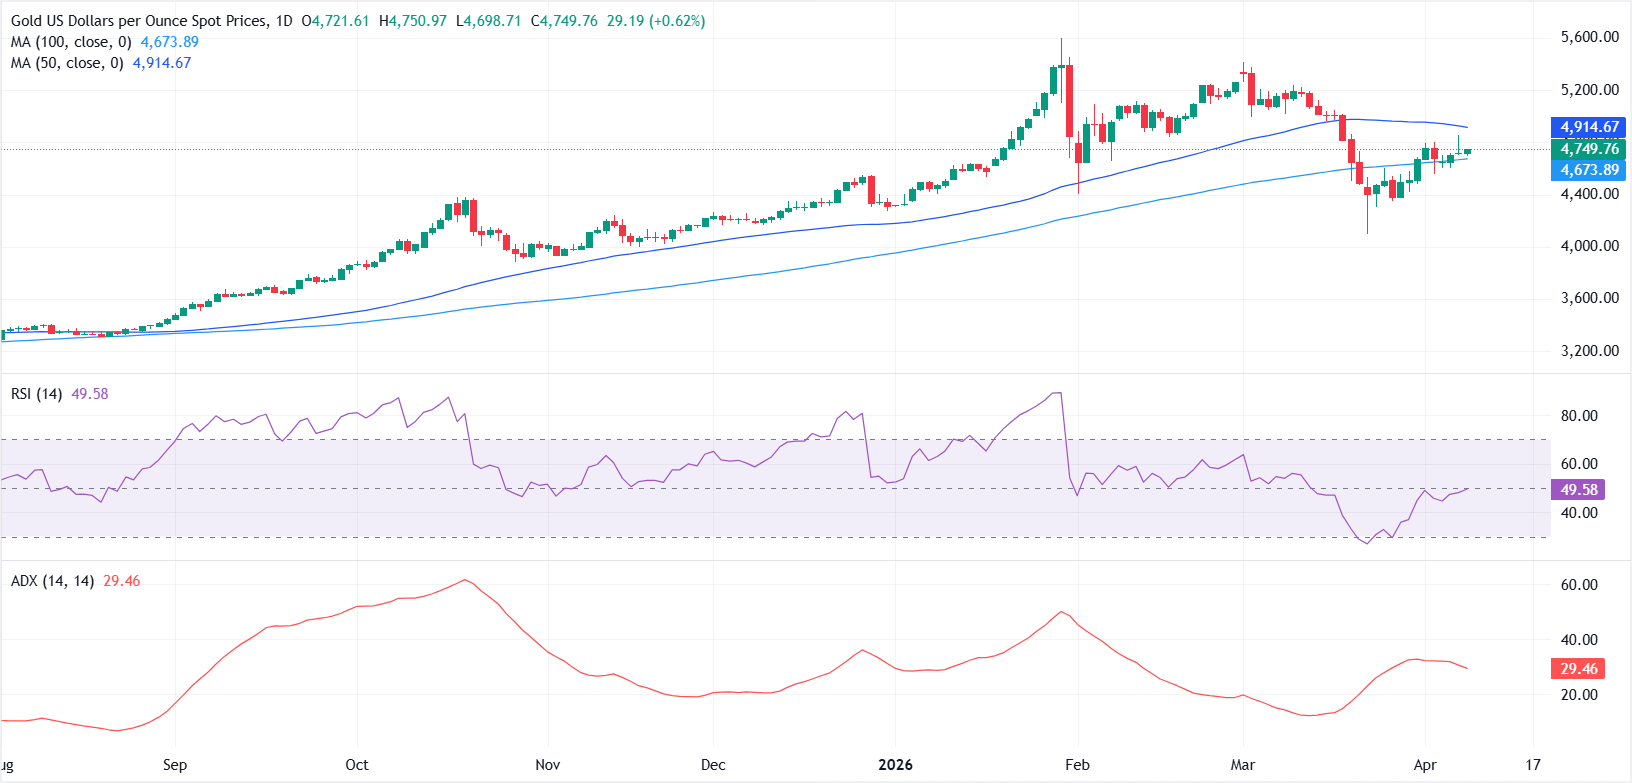
In the daily chart, XAU/USD oscillates between its key moving averages, holding above the 100-day simple moving average (SMA) at $4,673.84 but remaining below the 50-day SMA at $4,914.57, which leaves the near-term tone broadly neutral after the recent pullback. The Relative Strength Index (RSI) at 49.33 is effectively flat around the midline, while the Average Directional Index (ADX) at 29.46 hints at a moderate but not dominant trend, suggesting price may continue to consolidate within this band until a decisive break emerges.
On the topside, immediate resistance is reinforced by the 50-day SMA at $4,914.57; a daily close above this barrier would reopen the path toward the prior highs and shift the bias back in favor of the bulls. On the downside, initial support is seen at the 100-day SMA near $4,673.84; a sustained drop below this latter level would expose XAU/USD to a deeper correction and signal that sellers are regaining control.
(The technical analysis of this story was written with the help of an AI tool.)

يعتمد أكثر من مليون مستخدم على FXStreet للحصول على بيانات سوقية لحظية، وأدوات رسوم بيانية، ورؤى خبراء، وأخبار الفوركس. يساعد تقويمهم الاقتصادي الشامل والندوات التعليمية عبر الويب المتداولين على البقاء على اطلاع واتخاذ قرارات محسوبة. لدى FXStreet فريق يضم حوالي 60 محترفًا موزعين بين مقر برشلونة ومناطق عالمية مختلفة.
اقرأ المزيد


