
Gold Price Forecast: XAU/USD drifts below $4,800 as the US Dollar picks up
بواسطة Guillermo Alcala
تم التحديث: 15 Apr 2026


المقالات الشائعة

Gold (XAU/USD) shows moderate losses on Wednesday, trimming gains following a two-day rally. The precious metal failed to find acceptance above the $4,850 resistance area on Wednesday and pulled back to session lows below $4,800, as the US Dollar Index bounced up amid mixed messages on Iran.
- Gold prices pull back to $4,800 after failing at the $4,850 resistance area.
- The US Dollar picks up as traders ponder mixed messages on Iran.
- XAU/USD maintains a moderate bid tone but remains trading within range.
Gold (XAU/USD) shows moderate losses on Wednesday, trimming gains following a two-day rally. The precious metal failed to find acceptance above the $4,850 resistance area on Wednesday and pulled back to session lows below $4,800, as the US Dollar Index bounced up amid mixed messages on Iran.
US President Donald Trump is showing a positive tone concerning the resolution of the war. Trump suggested on Tuesday that the peace talks are likely to resume soon, and on Wednesday, he said that Iran’s war can be over very soon in an interview on the Fox Business channel.
Meanwhile, the US military affirmed earlier on Wednesday that the blockade of the Strait of Hormuz has been “fully implemented”, and the Washington Post reported that the US administration is considering the deployment of thousands of additional troops to the Middle East. This measure is aimed at pressuring Iran to close a deal, but might also make the peace process teeter.
Technical Analysis: Resistance at $4,850 is capping bulls
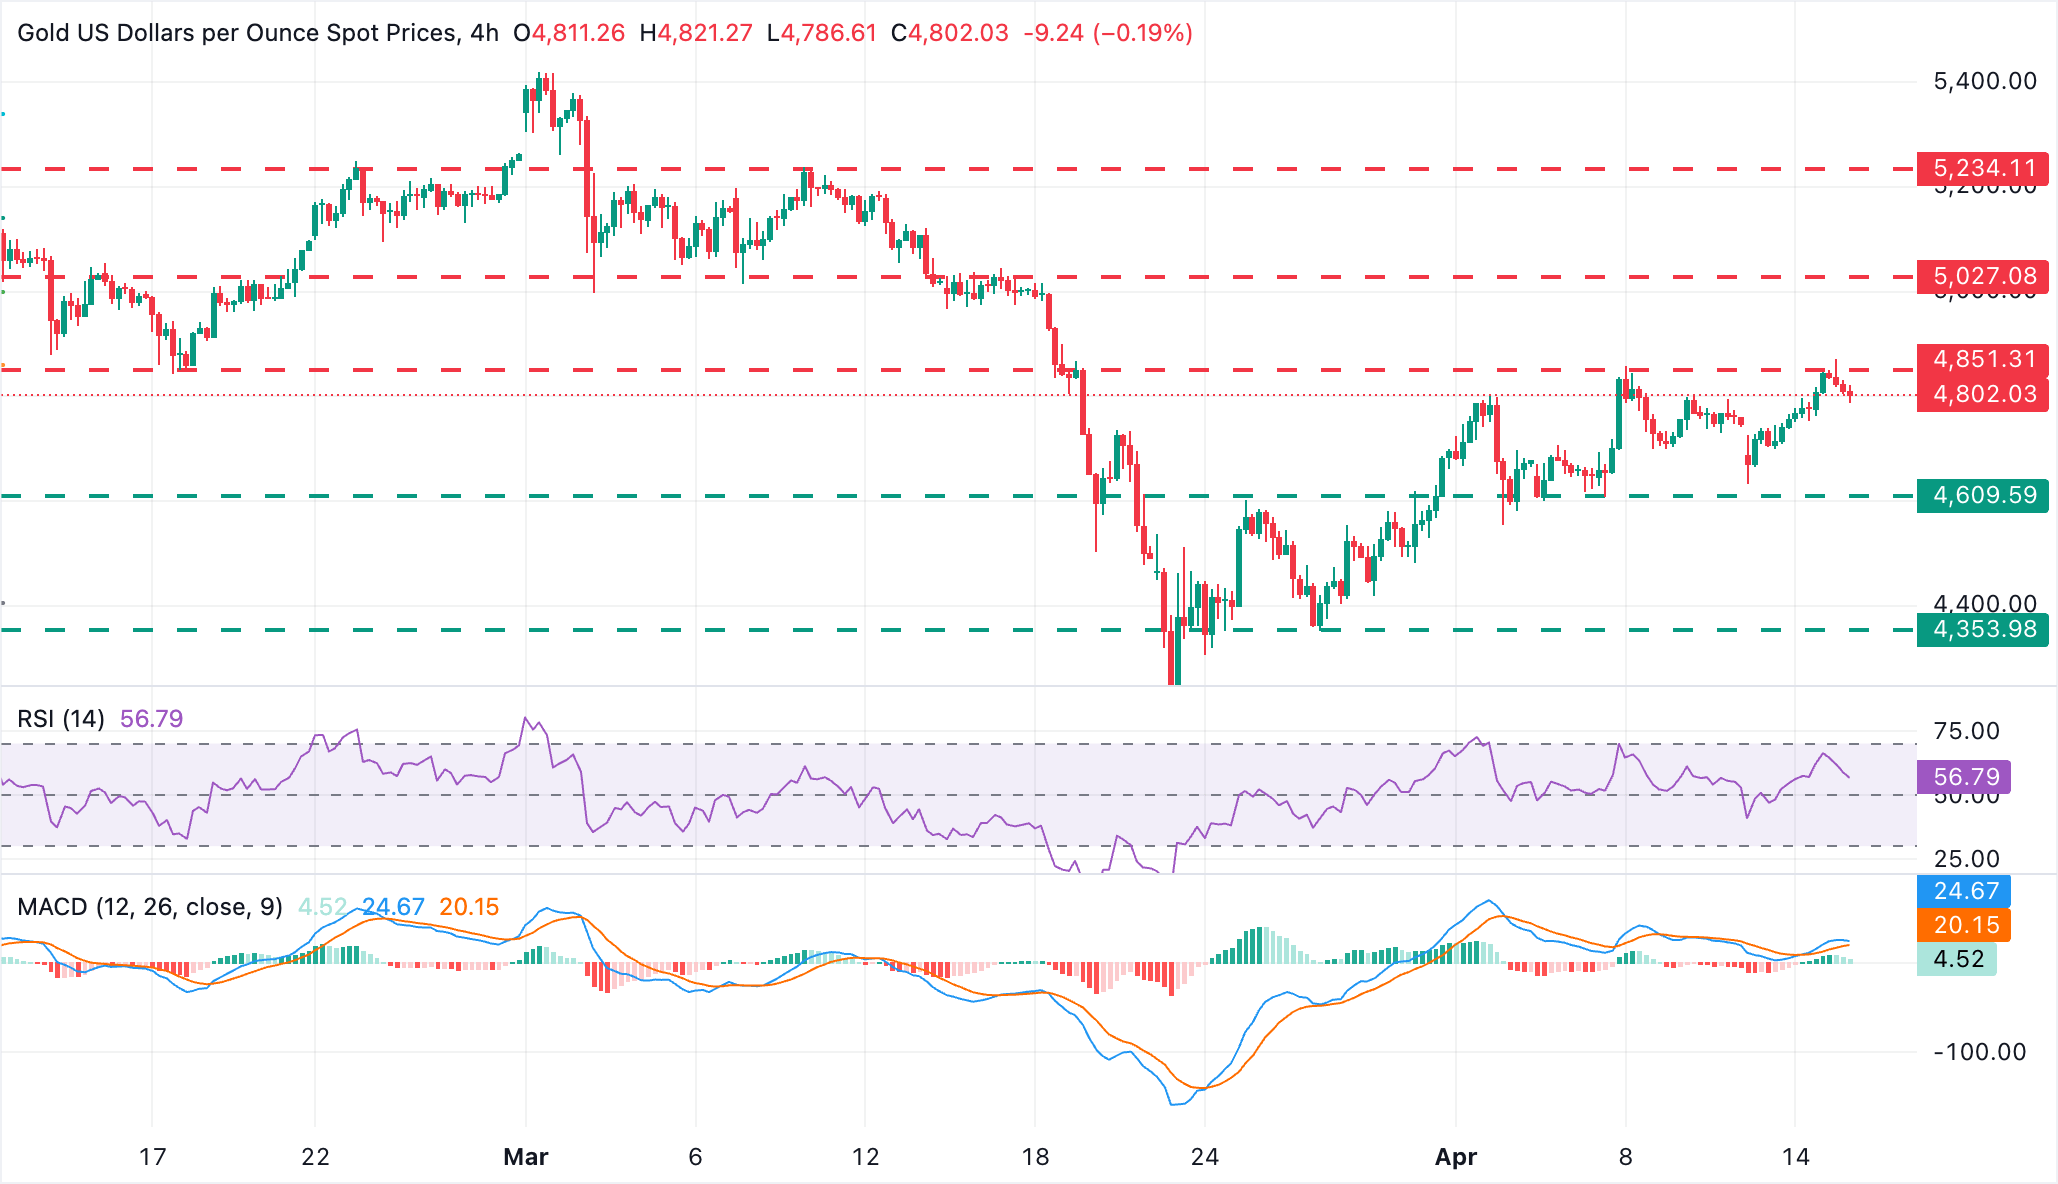
XAU/USD maintains a near-term constructive bias, yet with price action trapped between $4,600 and $4,850. The Relative Strength Index (RSI) in four-hour charts is above the key 50 level but shows a weakening momentum, while the Moving Average Convergence Divergence (MACD) remains in positive territory, highlighting the positive bias.
Bulls, however, need to breach the resistance area above $4,850 to extend their recovery from late March lows, towards a previous support-turned-resistance right above $5,000. Further up, the March 10 high, at $5,235, emerges as the next target.
On the downside, the April 5, 7, and 12 lows, between $4,610 and $4,630, are likely to challenge bears. A confirmation below that area would put sellers in control and increase pressure towards March 26 lows at the $4,350 area.
(The technical analysis of this story was written with the help of an AI tool.)

يعتمد أكثر من مليون مستخدم على FXStreet للحصول على بيانات سوقية لحظية، وأدوات رسوم بيانية، ورؤى خبراء، وأخبار الفوركس. يساعد تقويمهم الاقتصادي الشامل والندوات التعليمية عبر الويب المتداولين على البقاء على اطلاع واتخاذ قرارات محسوبة. لدى FXStreet فريق يضم حوالي 60 محترفًا موزعين بين مقر برشلونة ومناطق عالمية مختلفة.
اقرأ المزيد


