

Japanese Yen falls near multi-decade lows
- USD/JPY trades higher as the US Dollar stays supported by geopolitical risk and caution ahead of the FOMC Minutes.
- Trump’s comments that the Iran memorandum was “over” boosted risk aversion and helped lift the Greenback.
- Japan’s threat of intervention remains a key risk for USD/JPY.
USD/JPY trades higher near 162.50 on Wednesday, after nearing a four-decade high earlier in the day, as the US Dollar (USD) remains supported by geopolitical risk and caution ahead of the Federal Open Market Committee (FOMC) Minutes. The Japanese Yen (JPY) remains under pressure near multi-decade lows, keeping traders alert to possible intervention from Japanese authorities.

Support for the Greenback increased after United States (US) President Donald Trump announced that the interim memorandum of understanding with Iran was "over," indicating his unwillingness to engage with Tehran. This statement boosted safe-haven demand for the USD and caused a rise in oil prices, which heightens concerns over inflation and global risk sentiment.
The focus now shifts to the FOMC Minutes from the meeting held on June 16-17, which was the first under Fed Chair Kevin Warsh. If the tone is hawkish, it could reinforce the view that US interest rates may remain elevated for an extended period, which would support the Dollar and keep USD/JPY near recent highs.
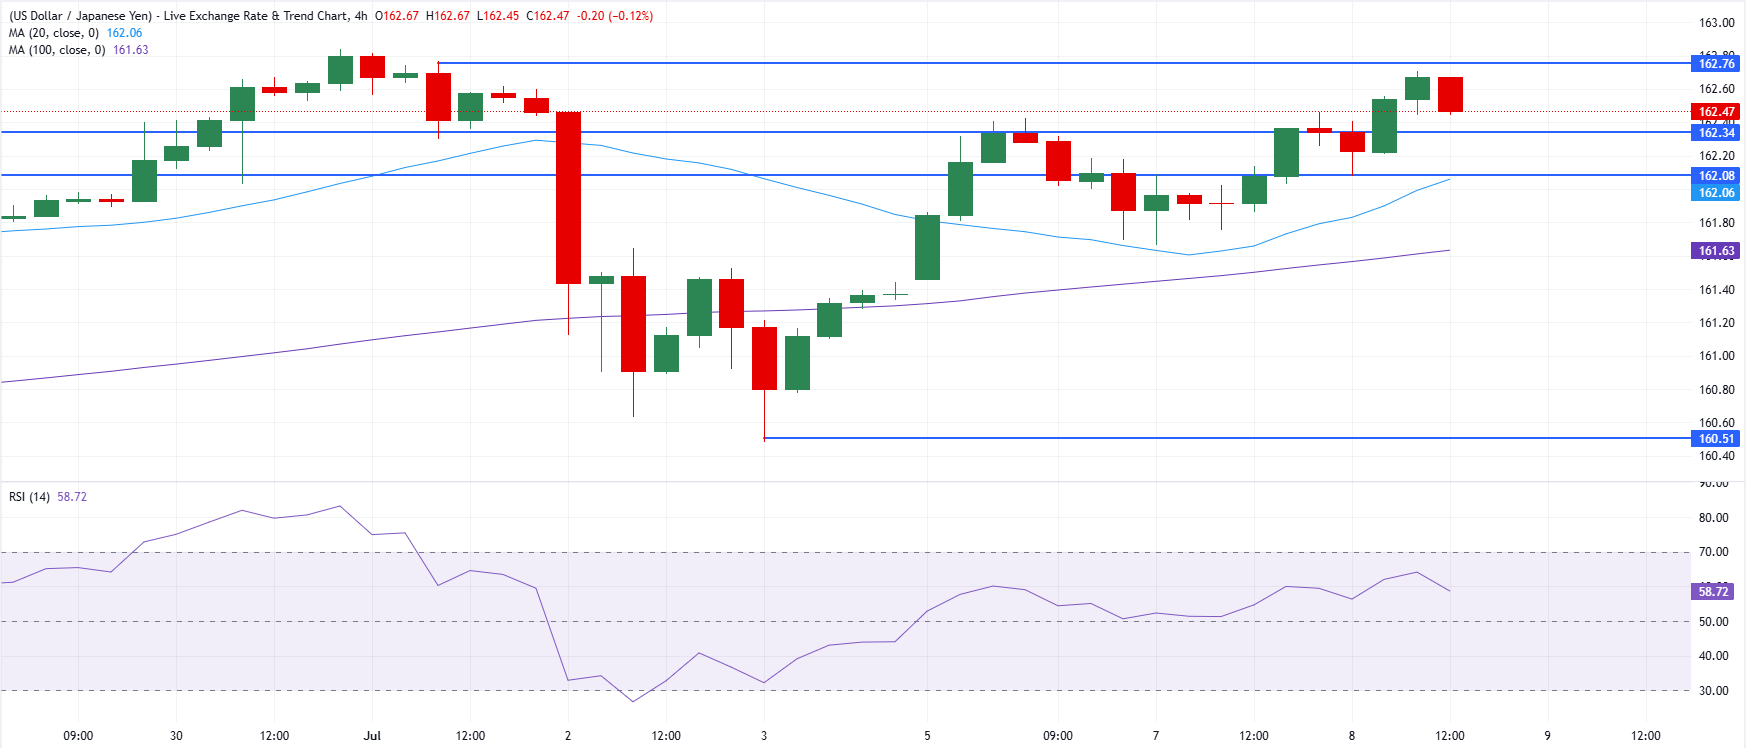
Short-term technical analysis:
On the 4-hour chart, USD/JPY trades at 162.53, maintaining a bullish near-term bias as it holds above both the 20-period Simple Moving Average (SMA) at 162.06 and the 100-period SMA at 161.63. The pair is also supported by a nearby horizontal floor at 162.47, while a firm Relative Strength Index (RSI) reading around 60 suggests steady upside momentum rather than overbought excess.
On the downside, initial support is seen at 162.47, followed by layered demand at 162.34 and 162.08, with the 20-period SMA at 162.06 and the 100-period SMA at 161.63 reinforcing the broader bullish structure. On the topside, immediate resistance is located at the horizontal line around 162.70, and a clear break above this barrier would open the way for an advance toward the recent four-decade high at $162.84 reached on July 1.
(The technical analysis of this story was written with the help of an AI tool. Know more.)














